Effects of stocking rate on quantity and quality of available
forage in a southern mixed grass prairie
-RODNEY K. HEITSCHMIDT, STEVEN L. DOWHOWER, WILLIAM E. PINCHAK, AND STEPHEN K. CANON
AbShCt
The objective of tbie study ~8s to qu8ntify the long-term (25 ye8rs) effecte of be8vy (HC) 8nd modcnte (MC) r8te!3 of &ckin~ on qtmntity 8nd qtmlity of forage 8v8iLble. Study desip required frequent lmrvest of rt8nding crop on 5 r8np rite8 in twice rep& c8ted, 244 ha tre8tment p8eturee. Resulta from the 20montb study lowed 8boveground st8nding crop dynrrmke were aimil8r in botb trerrtments, qu8nthy of8v8ikbk fonp ~8s gre8ter in the MC tbrn HC tr#tment, qtmlity of l v8K8ble forye ~8s gre8ter generally ia tbe HC tb8n MC treatment, 8nd tb8t heavy etocking 18vored a domhunce of w8rm-ee8eon rhortgr8mea u opposed to 8 domi- arace of w8rm-se8son mid-. Averaged acroms drtea 8nd 8djusted for differencea among puturea in rrnp rite composftion, 8boveground berb8ceoue at8nding crop 8ver8ged 1,341 kg/b8 in the HC p8aturee M compared to 1,816 kg/al, in the MC tratment p8stures. Crude protein md 0-c matter digatibility 8venged 8.6% 8nd 49.396, respectively, in the HC p8atura md 7.7% md 46.7% respectively, in the MC p8&um. It ia concluded tb8t the grerter vuiltion among yeur in cow/calf production in the HC tburhtbcMCtrcrrtmentbprimuilybcclrrwforrp8vrilrbllltyin tbe HC treatment is lees tb8n in tbe MC treatment.
Key Words: speder dombunce, r8nge site, stmdding crop, crude protein, o&c nutter digeetibility
Livestock production from rangeland is a function primarily of the the quantity and quality of forage consumed (nutrient intake), which varies primarily as a function of the quantity and quality of forage produced. Although climate is the major factor affecting quantity and quality of forage produced in grasslands (Lauenroth 1979), the major factors within a given climatic regime are the inherent productivity potential of a site (range site) and the kinds and number of plants present (range condition) (Ellison 1960, Sims et al. 1978, Bartolome 1984). A basic premise in range management is that as range condition declines, livestock carrying capacity declines also because quantity and/ or quality of forage produced declines (Stoddard et al. 1975, Danckwerts and Aucamp 1984, Malechek 1984). The objective of this study was to quantify the long-term (25 years) effects of moderate and heavy rates of stock- ing on quantity and quality of forage available in a southern mixed-grass prairie. Subsequent papers will examine the on-going effects of these treatments on quantity and quality of forage con- sumed and ultimately livestock production.
Methods
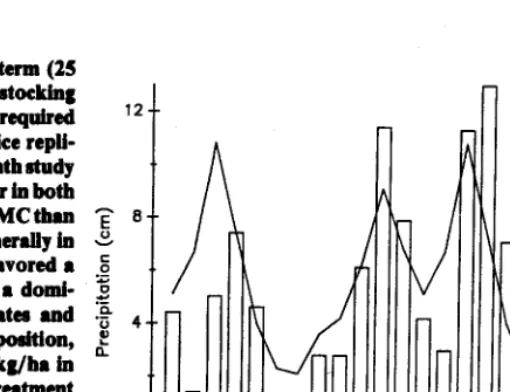
Research was conducted at the Texas Experimental Ranch located (99’14’W, 33’2O’N) on the eastern edge of the Rolling Plains. Climate is continental and semiarid. Precipitation is highly variable and bimodally distributed with peak rainfall occurring in May (9.2 cm) and September (10.6) (Fig. 1). Average annual
Authors arc profesw, research auc&te, amistsnt professor, and rmawch asso- ciate, Texas Agricultural Experiment Station, P.O. Box 1658, Vernon, Texas 76384. Appreciation k expressed to the Swen R. Swcluon Cattk Co. for providing the land, livutock, and facilities for this study and the Texas Experimental Ranch Committee for provid@ finurir a&tance.
Report is
Station, as # A-24071. ubli&d wth approval of the Director, Texas Agricultural Experiment Manwcript aaqtcd 16 March 1989.
0
J A S 0 N OIJ F M A M J J A S 0 N.DIJ F M A M J -
1985
’
:
I
1986 1987
Fig. 1. Monthly (bar graphs) and long-term (conrinrtous line)precipiration (cm) at Texas Experimental Ranch.
precipitation (1960-1987) is 68 cm. Average maximum daily temperatures range from a high of 36’ C in July to a low of 1 lo C in January
Topography at the ranch is rollmg and ranges from broad val- leys (<I% slope) and gentle slopes (l-3%) that lead to nearly level uplands (<l%), to narrow secondary valleys with moderate (3-50/o) to steep slopes (>5%). Soils range from the deep, well-drained clay and clay loams (fine, mixed, thermic Calciustolls, Typic Ustocrepts and Cumulic Haplustolls) found on the uplands, flood plains and gentle slopes, to the shallow, stony clay and clay loams (clayey, mixed, thermic Typic Ustochrepts) found on the steeper slopes. Dominant range sites are Clay Loam, Clayey Upland, Clay Slopes, Shallow Clay, Rocky Hills and Loamy Bottomland (SCS 1984). Elevation ranges from 408 to 463 m.
Vegetation is a mixed-grass complex within a light to moderate stand of honey mesquite [(Rosopisghdulosa (Torr.) var. grCmdu- low)]. Dominant midgrasses are Texas wintergrass (St&w leuco- rricha Trin. & Rupr.), a cool-season perennial; sideoats grama [(Boutelouu curripendulu (Michx.) Torr.], a warm-season peren- nial, and Japanese brome (Bromus japonicus Thunb.), a cool- season annual. Dominant shortgrasses are buffalograsses [(B&z- lee dacryloides (Nutt.) Engelm.] and common curlymesquite [(Hiloria berlungeri (Steud.) Nash], both warm-season perennials. The dominant forb is annual broomweed (Xunrhocephdum spp.). For a more complete description of the climate, soils, and vegeta- tion at the ranch, see Heitschmidt et al. (1985).
Grazing treatments were yearlong continuous stocked with mature Fl Angus/Hereford cows at heavy (HC) and moderate (MC) rates. The twice replicated treatments were initiated in 1960 in 4 pastures of similar condition (Heitschmidt et al. 1985) follow- ing subdivision of a single pasture. Size of pastures ranged from 218 to 266 ha. Average rates of stocking from 1960 through 1984 were about 5 and 7 ha/ cow/ yr, respectively. Recommended rate of
stocking in this region for good condition range is about 8 ha/cow/
yr
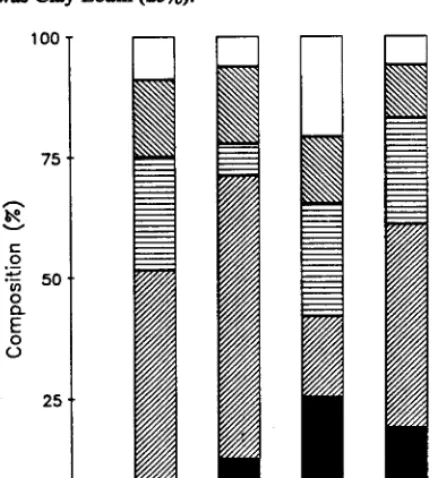
(SCS 1984). During this 2&month study, rates of stock- ing were 5.0 and 6.4 halcowlyr.Range site composition varied among treatment pastures (Fig. 2). The dominant range site in 3 of the 4 pastures was Clay Slopes (48%). In the fourth pasture (HC, Rep II), the dominant range site was Clay Loam (25%).
HC MC
cl
LBk8 RH
El
cutzza
csn
CLHC MC
REPLICATION I REPLICATION II
Fig. 2. Range site composition m) of replicatepastures in herrvy (HC)and m&rate (MC) continuous grasing treatments. LB = Luamy Bortom- land. RH = Rocky Hills. CU q Clayey Upland. CS = Clay Slopes. CL q
Clay Loam.
Aboveground standing crop was sampled on 8 dates during the study. Sample dates were October 1985; January, April, July and November 1986; and February, March, and June 1987. On each sample date, vegetation in 15 (20 X 15 cm) quadrats was harvested at ground level by forage class (grass vs. forb) at 3 locations per range site per pasture (15 quadrats X 3 locations X 5 range sites X 4 pastures = 900 quadrats). The permanent sample locations ranged in size from about 1 to 5 ha depending upon contiguous sire of mapped range site sampled. Quadrats were located within each sample location utilizing a stratified random sampling scheme. The 3 most abundant grass and forb species, in terms of standing crop, were identified and ranked in each quadrat prior to clipping. Buffalograss and common curlymesquite were considered a single species when ranked because the time required to clearly identify relative amounts of each species was excessive.
Following clipping, samples were dried at 60” C to a constant weight and weighed. The 15 grass samples per sample location were then combined and a subsample was collected for live:dead ratio and forage quality determinations (3 locations X 5 range sites 4 pastures = 60 subsamples per sample date). A portion of the sub- sample was hand separated by tissue color (green vs. brown) and weighed for determination of live:dead ratios. The remaining por- tion of the subsample was used for forage quality determinations. Percentage crude protein (CP) was estimated following standard A.O.A.C. (1975) procedures. Percentage in vitro organic matter digestibility (OMD) was estimated according to Tilley and Terry (1963) as modified by van Soest and Wine (1967).
All standing crop and rank data were summarized by location within pasture prior to statistical analyses. Rank indices for each location were calculated for each species from quantitative values
JOURNAL OF RANGE MANAGEMENT 42(6), November 1980
assigned for relative rank in each quadrat. Assigned values were 3 (rank I), 2 (rank 2). 1 (rank 3) and 0 (not ranked). Following summarization, all data were subjected to least squares analysis of variance utilizing a split-split plot model (Little and Hills 1978) to test for the main effect of treatment (HC vs. MC), the split-plot
effect of range site, and the split-split plot effect of date. Pasture summaries were analyzed using a split-plot model following adjustment for diierencs among pastures in range site composi- tion. Percentage CP and OMD estimates were analyzed following arcsine transformations. Tukey Q (KO.05) procedures (Snedecor and Cochran 1967) were used for mean separation of significant (p<O. 10) effects. Standard linear correlation procedures were used to calculate correlation coefficients.
ReSUMS
Dominmt speda
Thirty six species of grasses and 94 species of forbs were ranked at least once during the course of the study. Dominant species, which were defined as those species that had a minimum rank index of 0.5 at any of the 60 sample locations at least 10 times during the course of the study (i.e., 2% of the time), were: the buffalograss-common curlymesquite complex, Texas wintergrass, sideoats grama, hairy grama (Bourelouu hirsutu Lag.), Japanese brome, silver bluestem [(Borhrichlw succaroides (Swartx) Rydb.], red threeawn (Ariszidu longtieru Stcud.), annual broomweed, southwest carrot (Daucus pusillw Michx.), and western ragweed
(Ambrosiapsilostachya DC.).
The buffalograss+urlymesquite shortgrass complex and Texas wintergrass were the dominant species on all sites except the Rocky Hill site, where they were subdominants (Table 1). Sideoats grama was the dominant species on the Rocky Hills site and subdominant on all other sites. Japanese brome was a subdominant on the Clay Loam, Clayey Upland and Loamy Bottomland sites. Hairy grama and silver bluestem were subdominants on the Rocky Hills site whereas red threeawn was a subdominant on the Clay Loam site. The dominant forb on all sites was annual broomweed. Western ragweed was a subdominant on the Clay Loam site.
Averaged across range sites, rank indices were significantly greater in the HC than MC treatment for buffalograss-curly- mesquite, hairy grama, and annual broomweed ‘and were signfi- cantly less for Texas wintergrass, Japanese brome, and western ragweed (Table 1). However, when rank indices were weighted in proportion to range site composition of pastures, only the buffalograss-curlymesquite, Texas wintergrass and annual broom- weed indices varied significantly between treatments (Table 1).
The effect of sample date on rank indices was significant for all species except sideoats grama, hairy grama, silver bluestem and western ragweed (Table 2). Generally, variation across dates was related to the functional attributes of each species. For example, the rank indices for Japanese brome, the dominant cool-season annual grass, were greatest during winter and spring and least during summer whereas indices for Texas wintergrass, the domi- nant cool-season perennial grass, were greatest generally during spring and early summer and least during fall and early winter. However, because the rank indices for each species were a measure of relative abundance, the biological significance of differences among species across dates was difficult to assess. But the general absence of significant treatment X date interactions effects indi- cated species standing crop dynamics were similar in both treat- ments.
Herbage Stmdin~ Crop
Statistical analyses of the herbage standing crop data prior to adjusting for differences among pastures in range site composition revealed significant range site, date, and range site X date interac-
Table 1. Mean rank Uca for doodnent specke averaged acrom ssmpk data.
Common Name
Gra!3%%3
ChY
Loam
Ra ngc Site’
Clayey Clay Rocky Loamy Treatment* Treatment3
upland Slopes Hills Bottomland HC MC HC MC
Buffalograss- curlymesquite
Texas wintergrass
Sidcoatr 8rama Japanese bromc Hairy grama Silver bluestem
Red threeawn Forbs
l.llY 1.4ab
l&i 1.8a
0.7b 0.5c
0.4b OSb
CO.lb <O.lb O.lcd <O.ld
0.5a 0.2C
1.3b 1Sb 0.8b 0.3C <O.lb 0.2C 0.3b 0.74 0.4c 1.4a O.ld 0.4a 0.4a 0.3b 1.4a 1.5b 0.8b 0.7a <O.lb 0.3b O.lb 1.4a l.la 0.8 0.3a O.la 0.2 0.3 l.Ob 1.6b 0.8 0.4b <O.lb 0.2 0.2
l&l l.lb 1.2a 1.7b
0.8 0.6
0.3 0.4
0.1 0.1
0.1 0.2
0.3 0.3
Southwestern carrot O.lab O.lab O.lbc CO.lc O.la 0.1 0.1
Annual broomweed 0.4 0.5 0.5 0.4 0.5 0.6a 0.4b 0.1 0.1
Western ragweed 0.3a <O.lc <O.lc <O.lbc O.lab O.la 0.4b 0.6a 0.1 0.5b 0.4
‘Averaged across grazing treatments and dates. ~Avemged acmes range sites and dates.
aAveraged. across datn,and adjusted for differences among treatmeot pastures in range site composition.
‘Means w~thm a mw unthin raoge sites or treatments followed by different letters are significantly different at X0.05.
Table 2. Meao rank iadica for dominant specke l vereged NKIUII range sitee end grazing treatments.
Species Grasses
Buffalograss~urlymesquitc Texas wintergrass
Sideoats grama Japanese brome Hairy grama Silver bluestem Red threeawn Forbs
Date
Get 85 Jan 86 Apr 86 July 86 Nov 86 Feb 87 Mar 87 June 87
1.3al 1.3b 0.8 0.5ab 0.1 :::b 1.3a 1.3b 0.8 0.7a co. 1
0.2 0.3ab O.!% 1.4ab 0.8 0.6a 0.1 0.2 0.3ab 1.3a l/tab 0.8 <O.ld 0.1 0.2 0.3ab 1.2ab 1.3b 0.8 O.ld 0.1 0.2 0.3ab 1% 1.4ab 0.8 0.4bc 0.1 0.2 0.2b l.Obc 1.5a 0.8 0.6a 0.1 0.2 0.3ab 1.2ab 1.5a 0.7 0.3c 0.1 0.2 0.4a
Southwestern carrot <O.lc <O.lc <O.lc Annual broomweed 0.9b 0.9b 0.4c
Western ragweed 0.3 0.3 0.3
‘Means within a row followed by diierent letters are signikantly different at KO.05.
Oc <O.ld 0.2 <O?d 0:2 <O?d 0.1 0.4a 0.2C 0.2 0.3b 1.7a 0.3
Table 3. Herbage standiog crop (kg/ha) averaged across sempk dates.
Category Live grass Deadgrass Total Forbs
Total
Ra ngc Site’
Clay Clayey Clay Rocky Loamy Treatment* Treatment3 Loam upland Slopes Hills Bottomland HC MC HC MC
629b’ 617bc 544c 269d 759a 505 622 496a 6Olb 991b 768c 776c 453d 997a 628 966 606a 961b ---
162Ob 1385c 132Oc 722d 1756a 1133 1588 1102a 1562b 222 221 230 219 334 247 244 239 254 ---
1842b 1606c 155Oc 941d 209Oa 1380 1832 1341a 1816b
‘Averaged across grazing treatments and dates. ZAveraged across noge sites and dates.
aAveraged across dates and adjusted for diiereoces among treatment
4Meam within a mw within range sites and treatments followed by d
gastures in range qite ,compositipn.
erent letters arc s~gmticantly d&rent at KO.05.
Table 4. Percentage crude protein, organ& matter di~atibbby and percentage Hve gnu atmdhg crop
l
vmged ~UOSS data.Ra nge Sit&
Clay Clayey ClaY Rocky Loamy Treatment* Treatment3
Category Loam upland s10pca Hills Bottomland HC MC HC MC
Crude Protein (%) 8.2b4 8.7a 8.Ob 7.4c 8.3b 8.5 8.6a
Organic matter 48.3 41.2 48.7 49.3 47.3 49.5 2:: 49.3 23”
digcsibiity (%)
Live (%I) 37% 42Sa 38.9l.s 36.4c 41.9ab 41.2 37.7 41.6 36.9
~Averaged across grazing treatments and dates. *Averaged acro8s nngc &es and dates.
aAveraged across dates and jWified for diiercnm among treatment Weans within a row within range sites and treatmenta followed by d
run3 in range a+ ympositi?n.
ercnt letter8 arc s~gmfiintly dlffercnt at KO.05.
tion effects but no treatment, treatment X range site, treatment X date, or treatment X range site X date interaction effects. Live, dead, total grass (live + dead) and total (grass + forbs) standing crops were greatest on the Loamy Bottomland sites and least on the Rocky Hills site (Table 3). Standing crop was greater generally on the Clay Loam than the Clayey Upland and Clay Slopes sites. There were no significant differences among sites in forb standing crop. Although there were no significant treatment effects when the data were averaged across dates and range sites, standing crops were significantly greater in the MC than HC treatment pastures after adjustment for differences among pastures in range site com- position (Table 3).
The significant date effects reflected the effect of clitic condi- tions on rates of herbage growth and disappearance. The sign&
2.-
a
e 8
E'
f
0 N DIJ F Y A Y J J A 5 0 N DIJ F Y A Y J J
1966 1966 1967
Fig. 3. Grass and total (grass + forbs) standing crops (kgJha)forpastures in heavy (HC) and modhate (MC) continuous grasing treatments. jrtcotment effects were signi#kant (X0.10) (QJ = 7 % 51 for grass and total standing crop, respectivelyJ Date effects were signifiant KO.05) (a = 480 % 432, respectively). Zkeatment by &te interaction was not signi@ant in either analysts.
JOURNAL OF RANGE MANAGEMENT 42(6), November 1080
cant date X range site interactions that occurred when standing crops were averaged across treatments were considered to be of minor importance when F-values were examined. For example, F-values for range site and date were 4- to 8-fold greater than F-values for the date by range site interaction. Moreover, when standing crops were adjusted for differences among treatment pastures in range site composition, only the main effects of treat- ment and date were significant. Thus, at the pasture level, standing crop of live and dead grass, total grass, and total herbage were significantly greater in the MC than HC treatment on all dates (Fig. 3). There was no difference between treatments in forb stand- ing crop.
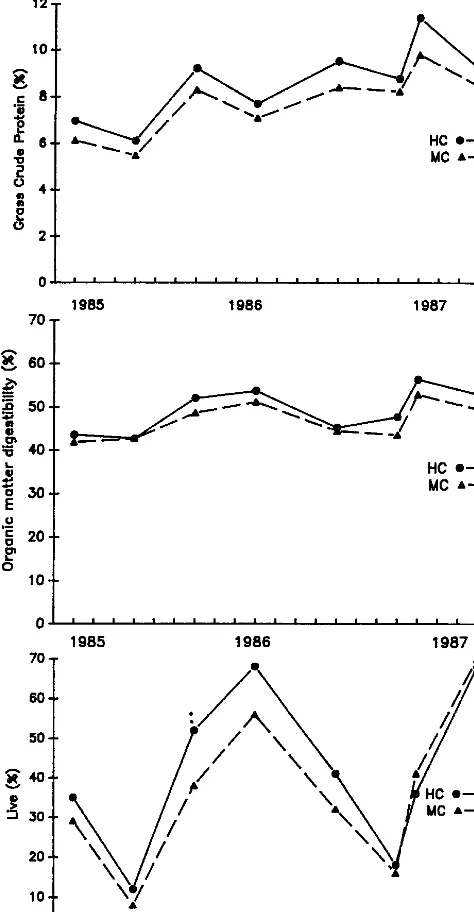
Percentage CP of the grass standing crop varied significantly among range sites and dates but not treatments when averaged across range sites (Table 4). Averaged across dates, percentage CP ranged from a high of 9.3% on the Clayey Upland site to a low of 7.4% on the Rocky Hills site. Averaged across range sites, percen- tage CP ranged from a high of 10.4% in March 1987 to a low of 5.8% in January 1986. Although there was a significant range site X date interaction effect, the effect was minor in that percentage CP was greatest on all dates, except June 1987, on the Clayey Upland site and least on all dates, except October 1985, on the Rocky Hills site. When the percentage CP data were adjusted for differences among treatment pastures in range site composition, percentage CP varied significantly between treatments (Table 4) and among dates (Fig. 4). There was no significant treatment X date interac- tion effect.
Percentage OMD of the grass standing crop did not vary signifi- cantly among range sites or between treatments (Table 4) regard- less of method of summarixation. However, percentage OMD did vary significantly among dates (Fig. 4) in a pattern similar to percentage CP. Although there was a significant range site X date interaction effect, no definitive pattern of variation was apparent in that percentage OMD ranged across dates from 49 to 65% on the Loamy Bottomland and Clay Slopes sites, 49 to 62% on the Clay Loam site, 50 to 64% on the Rocky Hill site, and from 51 to 65% on the Clayey Upland site. Moreover, there was considerable varia- tion among range sites when they were ranked within a date according to percentage OMD. For example, ranks over the 8 dates ranged from 1 (greatest) to 5 (least) for the Clayey Upland and Rocky Hills sites, 2 to 5 for the Clay Loam and Loamy Bottomland sites and from 1 to 4 for the Clay Slopes site.
There was a relatively strong relationship between percentage CP, OMD and live standing crops (Fig. 4, Table 4). Correlation
1965 1966 1967 70
T
g 60 J
HC e-e MC A-A
1965 1966 1987 707
60--
OJ
m 0 0 0 0 0 s 0 m a m a a 0 m n 1 n n 1 n 1ONDJFYAYJJASONDJFMAYJJ
1965 1966 1967
Fig. 4. Percentage CP, OMD andlive (green)standing cropforpastures in heavy (HC) and moderate (MC) continuous grasing treatments. neat- ment effcs were significant (P<O.IO) in analyses of grass % CP (Qa = 1.2). Date effects were signifiant (X0.05) in all analyses @a= 1.1,5.9 and 12.4for % CP. % OMDand% live respectively). Trecrtment by date interaction was not signt@ant in either anacllyses.
coefficients were 0.53,0.41, and 0.54 (n = 478, KO.001) between percentage CP and OMD, percentage CP and live standing crop, and between percentage OMD and live standing crop, respectively. This was as expected because previous research at the ranch has shown %CP and %OMD are greater for live than dead grass tissue (Heitschmidt et a. 1981, 1987).
Discussion and Conclusions
We conclude from the results of this study that: (1) standing crop in the HC pastures was characteristically dominated by warm- season shortgrasses and Texas wintergrass whereas standing crop in the MC pastures was characteristically dominated by Texas wintergrass and a mixture of warm-season short- and midgrasses
(Table 1); (2) aboveground standing crop dynamics were similar in both treatments (Fig. 3); (3) quantity of available forage was greater in the MC than HC treatment (Fig. 3, Table 3); and (4) forage quality was greater generally in the HC than MC treatment (Fig. 4, Table 4).
Although species composition was not measured directly in this study, we believe the greater abundance of shortgrasses in the HC treatment was the result of a general shift in species composition from a Texas wintergrass/ warm-season midgrass complex (good range condition) to a Texas wintergrass/ warm-season shortgrass complex (fair range condition). Previous research in these same pastures (Heitschmidt et al. 1985) supports this conclusion in that it showed frequency of buffalograss and end-of-season standing crop of warm-season shortgrasses inside temporary exclosures was substantially greater in the HC than MC pastures on most range sites. Standing crop dynamics were similar between treatments because species composition by functional group (cool-season vs. warm-season species) was similar. Quantity of available forage was greater in the MC than HC treatment, probably because of the combined effects of both reduced forage demand (stocking rate) and greater aboveground net primary production (ANPP). Al- though the vegetation sampling scheme utilized in this study was not conducive for estimating ANPP, previous research in these same study pastures (Heitschmidt et al. 1985) has shown single year (1982) ANPP estimates of 3,285,2,640, and 1,850 kg/ha in the HC treatment and 3,110, and 2,940, and 2,505 kg/ ha in the MC treat- ment for Loamy Bottomland, Clay Loam, and Rocky Hills sites, respectively. Quality of forage was greater generally in the HC than MC treatment because the proportional amount of low quality (senesced) forage was greater in the MC (63%) than in the HC treatment (58%).
The results of this study also provide strong evidence as to why cow-calf production is more variable across years in the HC treat- ment than in the MC treatment (Heitschmidt et al. 1988). For example, during the period from 1982 through 1987 production/ cow in the HC treatment averaged 211 kg and production/ha averaged 44 kg as compared to production estimates of 215 kg/cow and 34 kg/ ha in the MC treatment (Heitschmidt et al. 1988). These averages were attained at average stocking rates of 4.9 and 6.4 ha/ cowl yr, respectively, and the feeding of an average of 112 and 24 kg/ cow/ year of a 20% CP range cube during winter in the HC and MC treatments, respectively. However, production/cow, pro- duction/ ha, stocking rate, and amount of winter supplement fed in the HC treatment ranged from 169 to 248 kg/cow, 29 to 5 1 kg/ ha, 4.6 to 5.9 ha/ cow and 67 to 186 kg/ cow, respectively, as compared to respective ranges of 182 to 237 kg/cow, 29 to 38 kg/ ha, 6.2 to 6.4 ha/cow and 0 to 87 kg/cow, in the MC treatment. These data in combination with the results from this study indicate the variation results because quantity of available forage limits nutrient intake more frequently in the HC than MC treatment. This occurs because periodic drought often limits the accumulation of an ade- quate forage reserve in the HC treatment. As a result, livestock production among years is more variable in the HC than MC treatment.
Lastly, we believe the results of this study provide a classic example of how grass-dominated ecosystems generally respond to continuing high levels of herbivory. Because capture of solar energy is the first step required to maintain the integrity of an ecosystem, and because high levels of herbivory (grazing) often limit an ecosystem’s ability to capture solar energy, either a shit in plant species composition or a reduction in herbivore density (forage demand) should be anticipated over time. But because our management strategy in these treatments is focused on maintaining
a constant herbivore density over time, ecosystem response has been limited primarily to a shift in plant species composition. In this instance, the shit is towards a species complex that is generally less palatable (i.e., annual broomweed), less productive (i.e., short- grasses) and more grazing tolerant (i.e., short-grasses).
Literature Cited
Awe. Oft Anal.
Chem. 1975. Gffcial methods of analysis (11th ed.). Assoc. Off. Anal. C&m., Washington, DC.Bartolome, J.W. 1984. Impacts of grazing intensity and grazing systems on
vegetation composition and production. p. 917-215. In: Developing
strategies for rangeland management. Westview Press, Boulder, Colo. Danckwerta, J.E., end A.J. Aucamp. 1986.The effect of range condition on
the grazing capacity of semi-arid South African savanna. p. 229-230. In: Proc. 2nd Int. Bangeland Congress. (eds. P.J. Joss, P.W. Lynch and O.B. Wims), Amt. Acsd. of Sci., Canberra, Australia.
KBlson, Lincoln. 1%8. Influence of graxing on plant succession of rangc- lands. Bot. Rev. 261-78.
Heitschmidt, R.K., R.A. Gordon, and Jd. Bluntxer. 1982. Short duration
grazing at the Texas Experimental Ranch: Effects on forage quality. J. Range Manage. 35:372-374.
Hcitechidt, R.K., S.L. Dowbower, R.A. Gordon, and D.L. Price. 1985. Response of vegetation to livestock grazing at the Texas Experimental Ranch. Texas Agr. Exp. Sta. Bull. 1515.
Heitechmidt, R.K., S.L. Dowbower, and J.W. Walker. 1987.1~vs. 42- paddockrotationalgraxing:Foragequality.J.RangcManagc.40:315-317.
Iieitecbmidt,R.K.,S.K.Canon,W.E.Phbek,andS.L.D0rrb0w~.1~. Effects of ycarlong continuous, deferred rotation, and short duration grazing treatments on cow/calf production at the Texas Experimental Ranch. J. Prod Agr. (In press).
Lawnroth, W.K. 1979. Grassland primary production: North American
grasslands in perspective. p. 3-24. In: Norman R. French (cd.) Penpcc- tivcs in grassland ecology. Springer-Vcrlag, New York.
Little, TM., and F.J. IIRIs. 1978. Agricultural experimentation: Design and analysis. John Wiley and Sons, New York.
M&&k, J.C. 1984. Impacts of graxing intensity and spccialixcd grazing
systems on livestock response. p. 1129-l 158. In: Developing strategies for rangeland management. Westview Press, Boulder, Colo.
Sime, P.L., J.S. Sir&, end W.K. Lauenrotb. 1978. The structure and function of ten w&cm North American grasslands. I. Abiotic and veaetational characteristics. J. Ecol. 66951-285.
Snehcar, G.W., and W.C. Co&ran. 1967. Statistical methods (6th cd.). Iowa St. Univ. Press. Ames.
Soil Comervatlon Service. 1%4. Field offi technical guide. USDA. Abi- lene, Texas.
Stoddud, L.A., A.D. Smith, end T.W. Box. 1975. Range management. McGraw-Hill Book Co.. New York.
TBley,J.M.A.,andR.A.Terry.1%3.Atwo-stagctechniquefortheinvitro digestion of forage crops. J. Brit. Grassland Sot. 18:104-111. Van Sosst. PJ., and R.H. Wine. 1967. Use of detergents in the analyses of
fibrous feeds. IV. The determination of plant cell wall constituents. Assoc. off. Anal. Chem. 5050.
Moving in the near future?
Please send us your change of address as soon as you can so you won’t miss any issues of the Journal or Rangelands.
Please send your old address lable plus the following informa-
tion to Society for Range Management: 1839 York Street, Denver,
CO 80206.
Name New Address C&Y
Stete Zip
ATTACH
OLD ADDRESS
LABEL HERE