MITOCHONDRIAL DNA FROM PROTOZOA1
Y. SUYAMA AND J. R. PREER, JR.
Department of Biology, University of Pennsylvania, Philadelphia
Received July 7, 1965
is known from the extensive genetic studies made in yeast (EPHRUSSI 1958) I;nd Neurospora (WAGNER and MITCHELL 1955) that certain defects associated with mitochondrial proteins are inherited under the control of a cytoplasmic element. However, the chemical nature and the specific location of such an element in the cytoplasm have not yet been elucidated.
I n recent years, evidence has been accumulating that the mitochondrion con- tains deoxyribonucleic acid (DNA) and that this DNA might be capable of functioning in the synthesis of some proteins in the mitochondrion (LUCK and REICH 1964; and see NASS, NASS, and AFZELIUS 1965). Thus, it is likely that the DNA found in the mitochondrion (mitochondrial DNA) is indeed the vector of the cytoplasmic element, mutations of which may result in alteration of some mitochondrial proteins. Attractive as this possibility may be, there is no direct experimental evidence to prove this point. It was however felt that detailed quantitative as well as qualitative studies of the mitochondrial DNA might lead to the elucidation of the function that this DNA possibly implements within the mitochondrion. Furthermore, comparative studies of mitochondrial DNA par- ticularly in related organisms are of special interest in light of the previous finding that the mean base compositions of DNA from related organisms are similar and thus the phylogenetic relations are reflected in DNA base compo- sition (SUEOKA 1962; SCHILDKRAUT, MARMUR and DOTY 1962). I t was hoped that mitochondrial DNA also exhibits such a relationship.
In this paper are reported the isolation and partial characterization of mito- chondrial DNA’s from two related protozoa, Tetrahymena and Paramecium.
MATERIALS A N D METHODS
Culture: A strain of Tetrahymena pyriformis was grown in 2 liter Erlenmeyer flask contain- ing 1 liter medium [2% proteose peptone (Difco) and 0.1 % Basamin-Busch (Anheuser-Busch)] for 4 days at 27°C. A strain (51) of Paramecium aurelia, kappa free, was grown in 2.5 gallon jugs containing an infusion of Scottish grass by the methods described previously (PREER and
PREER 1959).
Both Tetrahymena and Paramecium cells were concentrated by a commercial cream separator a t 1000 xg. The concentrated cell suspension was further centrifuged with an International oil
testing centrifuge tube as described previously (PREER and PEER 1959).
Preparation of mitochondria. All operations were carried out at melting ice temperature. Packed cells were suspended in four volumes of the medium found suitable for isolating intact
1 T h i s work was supported by grants to Y. Suyama from the National Science Foundation to the University of
Pennsylvania and the Atomic Energy Commission, and to J. R. PREER, JR. from the National Science Foundation and Phi Beta Psi.
1052 Y. SUYAMA A N D J. R. PREER, J R .
mitochondria by PREER and PREER (1959). The medium consists of 0.2 M raffinose, 0.25% bovine serum albumin (fraction V, Calbiochem), and 1 mM potassium phosphate buffer at p H 6.2. The cells suspended in this medium were disrupted by forcing through a milk homogenizer. The homogenate was centrifuged for 6 min at 500 xg and the resulting precipitate was discarded. The supernatant was further centrifuged at 5,000 xg f o r 6 min; the supernatant was decanted and the flocculent material running down the centrifuge tube wall was quickly wiped by cheese- cloth. The pellet was resusp-nded in thn same medium, but care was taken so as not to include the bottom layer rcresenting cellular debris. This suspension was centrifuged again at 5,000 xg f o r 6 min, and the pellet was similarly washed again with the same medium. The final pellet was then resuspended in a 4Q ml volume of cold saline-EDTA (0.15 M NaC1,O.l M EDTA, p H 8)
as described by MARMUR (1961).
For determining the number of mitochondrial particles, the mitochondrial suspension a t this stage was properly diluted and mixed with a y2ast cell suspension, the cell density cif which was p:zviously d-temined ta be 2 x 10⁸ cells/ml by hemocytometer counting. The mixture was then examined under the phase contrast microscope and the ratio of the numt >rs of mitochondria to yeast cells was determined. The total mitochondrial number was obtained b y multiplying this ratio by 2 x 10⁸ and also taking into consideration a proper dilution factor and the total volume of the mitochrondrial suspension. Mitochondria in this condition are opaque and round in appear- ance and approximately 1 p in diamzter; therefore, they can be easily identified and counted.
Zsolation of DNA: The isolation methods of mitochondrial DNA were essentially the same as those described by LUCK and REICH (1964). To the mitochondrial suspension, 5% sodium deoxycholate solution was added to give a final concentration of 0.5%. A complete lysis of mite chondria was obtained by this treatment alone; the extra treatment such as freezing, thawing and subsequent heating at 60" for 10 min as described by LUCK and REICH (1964) is not neces. sary. The lysate was centrifuged at 8,000 xg for 10 min to remove any unlysed material.
For isolation of DNA, the supernatant of the deoxycholate lysate was mixed with an equal volume of phenol saturated with saline-EDTA; the mixture was then shaken for a period of 20 to 30 min on a rotary shaker. The phenol layer was separated by centrifugation in an Inter- national clinical centrifuge. The top, aqueous layer was pipetted out and poured into dialysis tubing [ l cm flat-width tubing previously soaked and washed in BPES (0.006 M Na,HPO,, 0 . 0 0 2 ~ NaH,PO,, 0.001 M Na,EDTA, and 0 . 1 7 9 ~ NaCl (CROTHERS 1964)l; the tubing was
subjected to dialysis against 1 liter BPES with t w o or three 1 liter changes within a period of
4.8 hours. After this dialysis, the contents of the tubing were treated with RNase (Worthington Biochem Co.) at a concentration of 5 pg/ml for 20 min at room temperature. The phenol treat- ment and the subsequent dialysis were repeated on this matsrial. The OD,,, loss due to this RNase treatment is large; the total OD usually becomes less than 0.1 of the starting OD. After csncentration of the contents by pervaporation and subsequent dialysis, the ultraviolet (UV) absorption spectrum ;anging from 230 to 280 mF was obtained; usually a ratio of OD,,o/OD2,,
2 2.0 with the absorption peak at a range between 255 and 260 mp was attained.
The Tetrahymena mitochondrial fraction was free of a r y cellular particles except cilia; the Pnrzmecium mitochor,drisl fraction was occasionaiiy contaminated with trichocysts, cilia, and bacteria. However, the number of each of these contaminants was estimated to be less than 108, which is unlikely to contribute sufficient amount of DNA to interfere with the present analysis. Furthermore, the contaminating trichocysts and bacteria are all insensitive to deoxycholate, excluding the possibility that such are the sources of the DNA isolated from the mitochondrial fractions.
Whole cell DNA was isolated from both Tetrahymena and Paramecium as follows. Packed cells collected by the methods described previously were resuspended, 1 mi cells in 20 ml cold saline-EDTA, and immediatdy lysed with addition of sodium d6oxycholaii to a final concentra- tion of 0.5%. Sometimes, cell lysis was effected by sodium lauryl sulfate .Q a concentration of
0.5% (this is much more effective than deoxycholate). T h e lysate was then quickly mixed with
M I T O C H O N D R I A L D N A 1053
glass rod and dissolved in BPES. This solution was treated with RNase (5pg/ml, 20 min a t room temperature), and the same phenol and alcohol treatments were repeated. The final solu- tion was then centrifuged at 8,000 x g for 10 min to remove denatured protein material.
CsCl density gradient centrifugatiom The methods were those described by MESELSON, STAHL and VINOCMD (1957) and SCHILDKMUT et al. (1962). The amount of sample DNA equivalent to 1 to 4.5 pg as calculated on the basis of 50 pg DNA/OD2eoInfl with a standard reference DNA (see below) were mixed with 11 molal solution of CsCl containing 0.02 M Tris buffer, p H 8.0.
The refractive index of the mixture was adjusted to N,=1.4000 at 25" and the solution *as centrifuged at a speed of 4-4,770 rpm in a Spinco Model E centrifuge f o r more than 19 hr at the temperature setting- of 20°C. The centrifuge cell was equipped with a 1" negative wedge upper window. For the two-cell operation, a 1" side wedg- lower window was used in one of the cells. From the mixed image of both cells seen at the front opening of the camera-lens housing cylinder, each cell image was effectively separated by means of a handmade mask. UV absorp- tion photographs were taken separately for each cell.
Determination o4,tbe mean density (gcm-3) of each DNA band was made against the refer- ence DNA (NljHZ B. subtilis DNA) isolated from B. subtilis grown in the Spizizen's minimal medium replacing the respective light components with (N15H4) ,SO, and deuterium oxide. The density ( p = 1.740) of this DNA was previously calibrated against the light B . subtilis DNA ( p = 1.703).
Determination of melting point temperature: 0.7 ml DNA solution containing 0.0195 M Na+
was placed in a I cm path 1 ml quartz cuvette. On top of it, 0.3 ml mineral oil was added to prevent evaporation during heating. The cuvette was heated in the Beckman DU monochrometer cell compartment with circulating hot water within attached thermospacers by the methods of
MARMUR and D o l r (1962), and the hyperchromicity at OD260mp and temperature changes were recorded by a Gilford multiple sample absorbance recorder. Temperature raise was insured before each OD measurement.
RESULTS
Tetrahymena: Microdensitometer tracings of the
UV
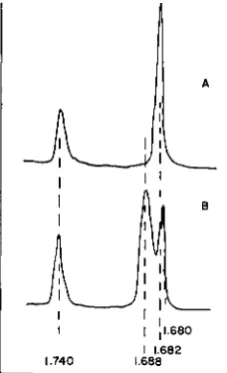
absorption photographsof equilibrated DNA from Tetrahymena mitochondria and the whole cell are shown in Figure 1. The tracings are matched at the standard reference DNA peak, the density of 1.740. A single species of DNA of the density ( p ~ 1 . 6 8 2 ) was obtained from the mitochondrial fraction, which was essentially free of any other DNA. This clean DNA can be obtained from the mitochondria which were not even treated with DNase before lysis. DNase treatment (IO ,ug/ml, 3 m ~ MgCl,, 30 min in ice), however does not affect the DNA within the mitochondria.
DNA fraction isolated from the whole cells of Tetrahymena, shows two peaks in CsCl density gradient centrifugation, one corresponding to the density, p =1.688 and the other, p =1.680. In the tracing shown in Figure 1, however, the lighter peak is seen to be split into two. This split peak is due to an optical artifact, since this effect in the tracing results from a very sharp remarkation line in the original photograph. In addition, this effect was observed only when an excess amount of the material was present. Since no such optical effect has been reported on 'DNA in CsC1, we investigated the matter further. It turned out that the material mas resistant to RNase and DNase and that heating at 100°C
and fast cooling did not alter the banding property of this material; thus this
1054 Y. SUYAMA A N D J. R. PREER, JR.
I 1.682
I
1.740 1.688FIGURE 1 .-Microdensitometer tracings of (A) Tetrahymena mitochondrial DNA (P =I .682)
and (B) whole-cell DNA ( p =1.688) in equilibrated CsCl densjty gradient formed by centrifu- gation at 44,770 rpm f o r 20 hr. The band at the far left is the standard reference DNA of density 1.740. The band with density of 1.680 seen in (B) results from a contaminating material of non- DNA nature (see Text and Figure 2 ) ; this was previously reported to be the nuclear DNA of Tetrahymena (SUYAMA et at. 1965).
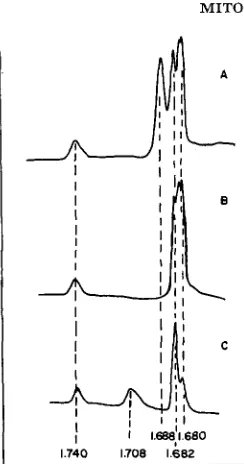
and fast cooling resulted in a complete denaturation as judged by its density increase ( A p =0.020). Figure 2 shows the microdensitometer tracings of the ultraviolet absorption photographs made on whole cell DNA treated with either RNase, DNase or heating and fast cooling in equilibrated CsCl density gradient. It is clear that the density ( p =I .682) of mitochondrial DNA does not correspond to either band obtained from the whole cell DNA fraction.
Paramecium: Microdensitometer tracings of the UV absorption photographs of DNA isolated from Paramecium mitochondria and from the whole-cell in the equilibrated CsCl gradient are presented in Figure 3. The density of the mito- chondrial DNA was calculated to be 1.702; that of the whole-cell DNA was 1.689. This value for the whole-cell DNA corresponds to that reported by SMITH-
SONNEBORN, GREEN and MARMUR (1963) and furthermore to that of Tetrahy- mena whole-cell DNA. The densities of the Paramecium and Tetrahymena of whole-cell DNA's are almost identical, but those of mitochondrial DNA's are markedly different in these two organisms.
MITOCHONDRIAL D N A 1055
1.740 1.708 1.682
FIGURE 2.-Whole cell Tetrahymena DNA was treated with (A) RNase (B) DNase and (C) heating and fast cooling before CsCl density gradient centrifugation with added Tetrahymena mitochondrial DNA ( p =I ,682) and N15HZ B . subti2is DNA (p=1.740) as references. The microdensitometer tracings of the UV absorption photographs of these samples in equilibrated CsCl density gradient were matched at these reference peaks.
A
I
I 1702
I
1.740 I689
FIGURE 3.-Microdensitometer tracings of
the UV absorption photographs of Paramecium (A) mitochondrial DNA ( p =1.702) and (B)
whole-cell DNA ( p =1.689) i n equilibrated CsCl density gradient formed by centrifugation at 44,770 rpm for 19 hrs (A) and 20 hrs (B).
N15Hz B. subfilis DNA ( p =1.740) was used as reference.
corresponded to 1.722, in addition three minor bands were identified and their densities were 1.710,1.698 and 1.695.
Determination of the amount of DNA in a mitochondrion: A total of 9 x lo1"
Tetrahymena mitochondria was mixed with 14 pg of N15HH' B. subtilis DNA before the lysis of the mitochondria. This mixture was then subjected to an entire isolation procedure f o r mitochondrial DNA as described in MATERIALS AND METHODS. After the purification of DNA, 0.09 OD,,, ~~ unit of the final solution
was mixed with CsCl solution and the mixture was centrifuged. For the quanti- tative estimation of the individual DNA, areas under the peaks were cut from the tracing paper, each of which was then weighed. The ratio of the average weights (three independent pieces cut from tracing papers) for B. subtilis
DNA to the mitochondrial DNA was 1/2.4; the total amount of DNA present in the 9
x
1 O 1 O mitochondria was 2.4 x 14 = 33.6 pg 'which corresponded to approxi- mately 3.7 xDetermination of the amount of the Paramecium mitochondrial DNA was not made at this time. However, the amount of DNA recovered after the entire isola-
1056 Y . S U Y A M A A N D J. R . PREER, J R .
TABLE 1
Recovery of D N A from mitochondria of Paramecium and Tetrahymena
Final DNA solution OD.XO m p
Total number
of mitochondria OD,,, m p Total volume 10" mitochondria
Paramecium 3.0
x
1011 0.420 2.4 ml 0.33Tetrahymena i 0.75
x l o l l
0.274 1.8 ml 0.6411 1.5 x 10¹¹ 0.436 1.8 ml 0.52
tion procedure is available for both Paramecium and Tetrahymena mitochondria. The data presented in Table 1 suggest approximately an equal amount of DNA present in the mitochondrion of Paramecium as in the mitochondrion of Tetra- hymena.
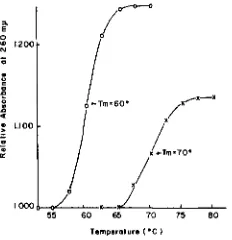
Melting point analysis of mitochondria2 DNA: DNA of the mitochondria of both Tetrahymena and Paramecium were examined for hyperchromicity result- ing from thermal denaturation of the double-stranded DNA. Tetrahymena mito- chondrial DNA (0.0M ODze,) and Paramecium mitochondrial DNA (0.056
OD,,,) contained in cuvettes were heated and changes in ODzeomp were recorded as described. The melting profiles of these DNA's are shown in Figure 4. Tm's for Tetrahymena and Paramecium mitochondrial DNA's were 60" and 70°, respectively; under the same condition of Naf concentration, B. subtilis DNA (p=1.703) shows T m = 73". These Tm's show a good agreement with those expected from the relationship between Tm values and G-C content and Na+ concentration obtained by MARMUR and
DOTY
(1962). Furthermore, OD,,,increases for the Tetrahymena DNA and the Paramecium DNA were 25% and 14%, and their
OD
transition was virtually complete within a period of several minutes, suggesting that they are typically double-stranded, native DNA mole- cules being relatively homogeneous throughout the length of DNA. However, the relatively poorOD
increases observed here may be due to low molecular weight denatured DNA contaminating these preparations.T"..d"re (.C 1
MITOCHONDRIAL D N A 1057
DISCUSSION
The present studies establish that mitochondria from both Paramecium and Tetrahymena indeed possess DNA of double-stranded nature, thus supporting the finding previously made by LUCK and REICH (1964) in Neurospora crassa. However, that the presence of DNA in mitochondria is a universal phenomenon does not need to be newly emphasized here, as it has been amply demonstrated by NASS, NASS, and AFZELIUS (1965) from their electron microscopic studies on a variety of organisms. I t is of interest, however, that it appears to be a general rule that mitochondrial DNA is different from the respective nuclear DNA in their mean densities
(LUCK
and REICH 1964; SUYAMA and BONNER 1965); this may account for some of the observations of the satellite DNA encountered in many species of higher organisms. (SUEOKA 1961 ; SCHILDKRAUT, MARMUR andDOTY 1962).
The amount of DNA present in the Tetrahymena mitochondrion was esti- mated to be approximately 3.7
x
pg. About the same amount of DNA was shown to be present in the Paramecium mitochondrion, and also in the mungbean ( P h a s e o h aureus) mitochondrion ( SUYAMA and BONNER 1965). This amount of DNA is equivalent to several times the amount of DNA of a T2 bacteriophage; if all of it is present as a single molecule, this corresponds to a piece of DNA of mol wt 2.4 x IO*, which then should be able to code for more than several hundred proteins. These results would be expected if one assumes that mitochondrial DNA is responsible for the synthesis of many proteins known to be associated with mitochondria. However, there is no experimental evidence as to what function this DNA plays and what structure, haploid, diploid or poly- tene it may assume within the mitochondrion. However, recent demonstrations of actinomycin D sensitive RNA synthesis with the isolated Neurospora mito- chondria by LUCK and REICH (1964) and of protein synthesis studied by KROON
( 1963)
,
together, allude to the possibility that this DNA is endowed with the essential function of determining some of the properties of mitochondria.The extensive studies made on D N A s from various organisms have brought light to the question of the evolution of DNA. Emphasis has been given to the fact that the DNA’s of related organisms possess similar mean G-C composition; thus DNA reflects the phylogenetic relations between the organisms (SUEOKA
1058 Y. SUYAMA A N D J. R. PREER, JR.
cell; i.e., the coding mechanism is not universal; or very little function is associated with the mitochondrial DNA, nonsense or redundancy is abundant. However, it is still possible that different intranuclear and intramitochondrial environments have led to independent evolution of base compositions. Therefore, before drawing any conclusion concerning these possibilities, it is necessary to examine density distribution of mitochondrial DNA of many more related organisms.
S U M M A R Y
DNA's were isolated from mitochondria of Tetrahymena pyriformis and Para-
mecium aurelia. Their buoyant densities ( g ~ m - ~ ) determined by CsCl density
gradient centrifugation were p =1.682 and p =1.702, respectively. On the other hand, the densities of whole-cell DNA were p =1.688 and p =1.689, both of which differ from that of the corresponding mitochondrial DNA's.
Mitochondrial DNA's of both organisms showed the hyperchromicity charac- teristic of double stranded native DNA upon heating; Tm's (in 0.0195 M N a f )
were 60" and 70°, respectively. The Tetrahymena mitochondrion was estimated to contain 3.7 x 10-lo pg DNA; Paramecium was approximately the same.
The fact that mitochondrial DNA of related organisms differ may bear on the function of the mitochondrial DNA.
L I T E R A T U R E C I T E D
CROTHERS, D. M., 196.F EPHRUSSI, B., 1952 KROON, A. K., 1963
The kinetics of DNA denaturation. J. Mol. Biol. 9: 712-733.
Nucleo-cytoplasmic Relations in Microorganisms. Oxford University Press. Protein synthesis in heart mitochondria. I. Amino acid incorporation into proteins of isolated beef heart mitochondria and fractions derived from them by sonic oscil- lation. Biochim. Biophys. Acta 72: 391-4.02.
LUCK, D. J. L., and E. REICH, 1964 DNA in mitochondria of Neurospora crassa. Proc. Natl. Acad. Sci. U S . 52: 931-938.
MARMUR, J., 1961 A procedure for the isolation of deoxyribonucleic acid from microorganisms.
J. Mol. Biol. 3: 208-218.
MARMUR, J., and P. DOTY, 1962 Determination of the base composition of deoxyribonucleic acid from its thermal denaturation temperature. J. M d . Biol. 5 : 109-118.
MESELSON, M., F. W. STAHL, and J. VINOGRAD, 1957 Equilibrium sedimentation of macro- molecules in density gradients. Proc. Natl. Acad. Sci. U.S. 43: 581-583.
NASS, M. M. K , and S. NASS, and B. A. AFZELIUS, 1965 The general occurrence of mito- chondrial DNA. Exptl. Cell Res. 37: 516-539.
PREER, J. R., and L. B. PREER, 1959 Gel diffusion studies on the antigens of isolated cellular components of Paramecium. J. Protozool. 6: 88-100.
SCHILDKRAUT, C. L., J. MARMUR, and P. DOTY, 1962 Determination of the base composition of deoxyribonucleic acid from its buoyant density in CsC1. J. Mol. Biol. 4: 430-443.
SMITH-SONNEBORN, J., L. GREEN, and J. MARMUR, 1963 Deoxyribonucleic acid base composition of kappa and Paramecium aurelia, stock 51. Nature 197: 385.
SUEOKA, N , 1961 Compositional correlation between deoxyribonucleic acid and protein. Cold Spring Harbor Symp. Quant. Biol. 26: 35-43.
-
1962 On the genetic basis of varia- tion and heterogeneity of DNA base composition. Proc. Natl. Acad. Sci. U.S. 4.8: 582-592.Isolation and characterization of mitochondrial DNA. Abstract presented at the Annual me2tings of Northeastern section for Amer. Soc. of Plant Physiologists, p. 6.
Mitochondrial DNA and its density distribution. Plant Physiol., Suppl. 40: IXV.
SUYAMA, Y., and W. D. BONNER, 1965
SUYAMA, Y., J. R. PREER, JR., and W. D. BONNER, 1965