Self-efficacy and academic performance: a chicken-and-egg conundrum
Kate Talsma and Kimberley Norris, University of Tasmania Benjamin Schüz, University of Bremen
Abstract
Self-efficacy (SE) is widely viewed as critical to student success. Recent modelling shows that SE and academic performance (AP) are reciprocally related over time, with AP the primary antecedent (the AP→SE effect is stronger than the SE→AP effect). However, this research considered only studies measuring SE before AP at each wave of measurement (“SE-first” studies). Focusing on studies with the opposite measurement order (“AP-first” studies), we conducted a follow-up study exploring reciprocity and the comparative strength of directional effects in the relationship. A meta-analytic cross-lagged panel analysis of AP-first studies showed a reciprocal relationship, as found previously. However, the pattern of directional effects was opposite to that in SE-first studies: the SE→AP effect was stronger than the AP→SE effect. The feedback loop in the relationship means that the relative influence of the variables on each other depends on timing of measurement. This highlights the difference between “mastery-informed” and “mastery-naïve” SE, with implications for the calibration of SE with AP.
Introduction
Self-efficacy (SE) refers to one’s perception of their capability to follow the required courses of action to achieve particular outcomes; it is a ‘can do’ belief (Bandura, 1997). Meta-analyses consistently identify positive relationships between SE and academic success (e.g., Richardson, Abraham, & Bond, 2012; Schneider & Preckel, 2017). As such, strong SE beliefs are considered an end in themselves in educational settings (e.g., Ritchie, 2015). However, a focus on unidirectional interpretations (i.e., “believe and you will achieve”) has meant that the chicken-and-egg conundrum regarding the direction of causality between SE and academic performance (AP) has only recently begun to be explored (e.g., Talsma, Schüz, Schwarzer & Norris, 2018). SE is a key construct in educational research, which in turn is an important driver of educational policy (Pajares & Usher, 2008; Zimmerman, 1995). Thus, it is important to understand that the relationship between SE and AP is more complex than much of the existing literature might suggest (Vancouver, Alicke, & Halper, 2018).
with social cognitive theory, which embeds SE in a framework in which behaviour both shapes, and is shaped by, interacting factors (Bandura, 1997). However, the size of the unique SE→AP effect was much smaller than the typically moderate effects reported in cross-sectional correlational analyses. Also, our findings indicated that AP had a considerably stronger effect on SE than the reverse. This suggests that policies and practices aimed at increasing SE in isolation may not have the desired effects (Talsma et al., 2018).
In our original literature search, we located three studies which did not meet inclusion criteria because AP was measured prior to SE at each time point (“AP-first” studies). While such an approach is not consistent with recommendations from self-efficacy theory to measure SE prior to AP (Bandura, 1997), its occurrence provides an opportunity to explore the potential moderating effects of measurement order on the SE↔AP relationship. The purpose of the present paper is to report on follow-up analyses conducted using these AP-first studies.
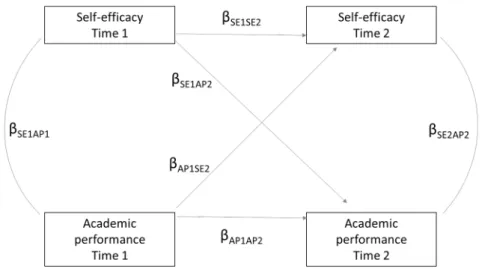
Figure 1. Conceptual diagram of the meta-analytic cross-lagged path model
There are several reasons to suspect that studies measuring AP before SE would have different findings to the original meta-analysis. When participants undertake an AP task before SE is measured, they gain mastery experience which is argued to be the principal source of information used in the formation of SE beliefs (Bandura, 1997). Gist and Mitchell’s (1992) theoretical model of the SE/AP relationship provides a detailed framework for explaining how task experience may affect SE judgements. In their model, SE judgements are based on an analysis of task requirements (what do I have to do?), as well as an attributional analysis of experience (how successfully have I done this before?). These two judgements address the likelihood of successful future AP, and both are likely to be affected by task experience.
generalise their beliefs from more distal and perhaps vaguely recalled experiences thought to be similar to the upcoming AP task, or rely more heavily on more general beliefs about ability (Chen, 2003; Gist & Mitchell, 1992; Mitchell, Hopper, Daniels, George-Falvy, & James, 1994; Pajares & Schunk, 2001).
In the context of this theoretical framework, we posit that AP-first studies may show a stronger relationship between SE at time 1 and AP at time 2, owing to greater accuracy of SE beliefs which are informed by recent mastery experience. Our aims in the present study were:
1. to determine whether measurement order moderated the SE↔AP relationship 2. to determine whether SE and AP were reciprocally related in an AP-first sample of
studies
3. to compare the strength of net cross-lagged effects (βSE1AP2 and βSE2AP1; see Figure 1) in these AP-first studies, and
4. to compare the strength of the cross-lagged paths in the AP-first studies with those in the Talsma et al. (2018) meta-analysis which was based on SE-first studies.
Method
We refer readers to the Talsma et al. (2018) meta-analysis for details regarding the rationale for inclusion criteria. In brief, studies were included if they: Presented data regarding academic SE, measured in accordance with SE theory, at any level of specificity; collected data regarding AP on a specific occasion; collected data on SE and AP using a panel design (Figure 1) providing a set of six correlations; included participants in traditional primary, secondary and tertiary educational settings; and did not conduct any interventions between measurement waves (interventions would obscure cross-lagged effects). Complete details regarding the literature search and coding are also to be found in the Talsma et al. (2018) meta-analysis. In brief, electronic searches were conducted in Scopus, PsycINFO, the Education Resources Information Centre (ERIC) and Web of Science. Three search fields covered terms relating to SE, AP (e.g., school, education, test), and methodological terms (e.g., panel, longitudinal, lag). Manual searches were also conducted using the reference lists of extant meta-analyses.
Using the above criteria, 11 studies (N=2,688) were identified for inclusion in the original meta-analysis. Three studies (N=769) which otherwise met all inclusion criteria were excluded on the basis that AP was measured prior SE at each of the two time points. In the present paper, all 14 studies were included in a preliminary moderator analysis to determine whether measurement order significantly moderated any of the six pooled correlations in the model (Figure 1). A meta-regression analysis was conducted using Metafor for R (Viechtbauer, 2010). The cross-lagged path βSE1AP2 (Figure 1) was significantly moderated by measurement order, Q=7.97, p=.005. Subsequent analyses focused on the three studies which measured AP prior to SE on each measurement occasion (see Table 1 for details).
Muthen, 1998-2012).
The small number of included studies precluded valid analyses of potential bias risk; however, several other steps were taken to assess the risk of bias as far as possible. Risk of bias based on reliability of SE measures was considered to be low, given that all Cronbach’s alphas for included studies exceeded recommended levels (see Table 1). AP data was taken from institutional records and is suggested to be at low risk of bias. Publication bias was assessed with multiple tests which are reported below. Inter-rater agreement on coding of studies was 100% owing to the transparency of coding categories, suggesting a low risk of author bias.
Results
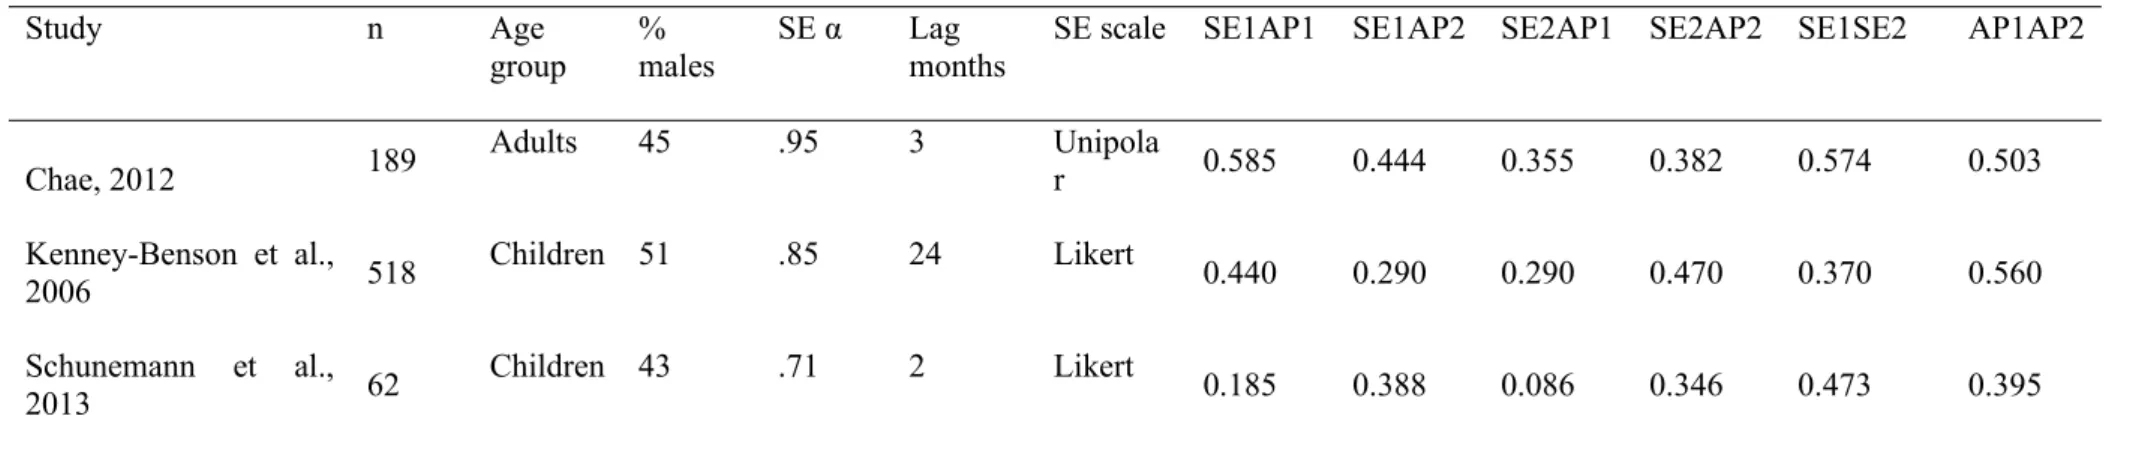
Features of included studies and zero-order correlations are presented in Table 1.
Study n Age
group % males
SE α Lag months
SE scale SE1AP1 SE1AP2 SE2AP1 SE2AP2 SE1SE2 AP1AP2
Chae, 2012 189
Adults 45 .95 3 Unipola
r 0.585 0.444 0.355 0.382 0.574 0.503
Kenney-Benson et al.,
2006 518
Children 51 .85 24 Likert 0.440 0.290 0.290 0.470 0.370 0.560
Schunemann et al.,
2013 62
Children 43 .71 2 Likert 0.185 0.388 0.086 0.346 0.473 0.395
Table 1. Features of included studies with zero-order correlations (column labels as per Figure 1).
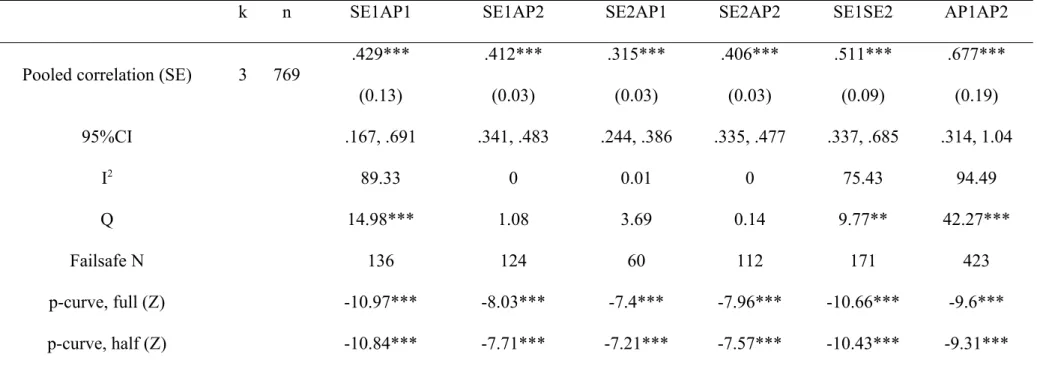
Pooled estimates of the six correlations in the cross-lagged panel model are shown in Table 2, along with standard errors, and 95% confidence intervals (forest and funnel plots are available by contacting the lead author). Moderate-to-strong positive auto-correlations, and small-to-moderate positive synchronous and cross-lagged correlations were found, consistent with previous findings. Also shown in Table 2 are I2 and Q
homogeneity test values; these figures suggest sampling error alone is unlikely to account for the differences in effect sizes, however, we note that the zero/near-zero values may not be reliable because of the small number of studies included.
k n SE1AP1 SE1AP2 SE2AP1 SE2AP2 SE1SE2 AP1AP2
Pooled correlation (SE) 3 769 .429*** (0.13)
.412***
(0.03)
.315***
(0.03)
.406***
(0.03)
.511***
(0.09)
.677***
(0.19)
95%CI .167, .691 .341, .483 .244, .386 .335, .477 .337, .685 .314, 1.04
I2 89.33 0 0.01 0 75.43 94.49
Q 14.98*** 1.08 3.69 0.14 9.77** 42.27***
Failsafe N 136 124 60 112 171 423
p-curve, full (Z) -10.97*** -8.03*** -7.4*** -7.96*** -10.66*** -9.6***
p-curve, half (Z) -10.84*** -7.71*** -7.21*** -7.57*** -10.43*** -9.31***
Table 2. Pooled correlations and tests of homogeneity and publication bias (** = p<.01, *** = p<.001)
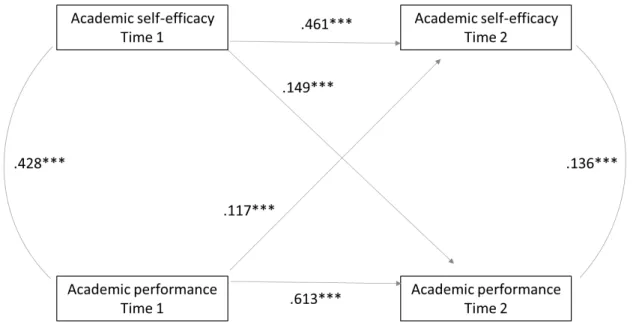
Figure 2 displays the meta-analytic path model estimated from the pooled correlations in Table 2. The results are consistent with a reciprocal effects model, with all paths positive and statistically significant. The net SE→AP effect is β=.149, whereas the net AP→SE effect is β=.117. These estimates are based on a fully saturated model. A model was also tested in which the cross-lagged paths were constrained to be equal, indicating an equivalent reciprocal relationship (Menard, 2007). In this case, the constrained model did not provide a significantly poorer fit to the data (χ2 = 0.463, p>.05). Therefore, the influence of SE on AP cannot be said to be significantly greater than the reverse, though it is likely
that the small sample size affected the calculation of the Chi-squared statistic in this case.
Figure 2. Cross-lagged panel model of performance-first studies
Discussion
This study further explored the chicken-and-egg conundrum in the relationship between academic SE and AP, meta-analysing studies which measured AP prior to SE on two separate occasions to consider the effect of measurement order on the SE↔AP relationship. The CLPA provided further support for a reciprocal effects model, consistent with Talsma et al. (2018): both SE and AP had small but statistically significant, unique positive influences on each other over time (see Figure 2). This finding is consistent with reciprocal determinism of SE and AP (Bandura, 1997; Pajares & Usher, 2008), and demonstrates the important effects of both SE (as a mobilising factor) and AP (as a source of mastery experience) in educational settings. The implications of this reciprocity are discussed in further detail in Talsma et al. (2018); here we focus on the findings regarding the comparative strength of cross-lagged effects.
Most importantly, compared with the Talsma et al. (2018) meta-analysis, the strength of directional effects was reversed: SE exerted a stronger influence on subsequent AP than AP did on subsequent SE. While the difference between these two effect sizes was not statistically significant (thus we cannot rule out an equivalent reciprocal relationship in this data), the SE→AP path in the present model was significantly stronger than in the identical path in the Talsma et al. (2018) meta-analysis, in which SE was measured before AP each time. Also, the AP→SE path in the present meta-analysis was significantly weaker than the analogous path in the original meta-analysis. This reversal of regression weights suggests an important effect of measurement order, illustrating the nature of the feedback loop in the relationship.
observed pattern of cross-lagged effects is consistent with the position that mastery-informed SE is better calibrated with AP, as in the present study, and mastery-naïve SE is more poorly calibrated with AP, as in Talsma et al. (2018) (Stone, 2000). Intuitively, differences in calibration would be based on higher levels of task experience, and lower levels of task ambiguity, for individuals who engaged in the AP task prior to judging SE, and vice versa (Bandura, 2012; Gist & Mitchell, 1992; Lindsley et al., 1995; Stone, 2000). Simply put, our results suggest that individuals who have had specific experience of an AP task are able to more accurately assess their ability to perform that task in the future than individuals who have not had that experience. This interpretation is consistent with the focus in self-efficacy theory on mastery experience as the principal source of self-efficacy beliefs (Bandura, 1997; Klassen & Usher, 2010) and with previous research indicating that experienced undergraduates’ self-efficacy beliefs are more accurate than those of new undergraduates (Gore, 2006).
Implications
The finding that mastery-informed SE shows stronger effects on subsequent performance than mastery-naïve SE points to the primary importance of performance experiences for students, consistent with the Talsma et al. (2018) meta-analysis. Our results suggest that SE is a better predictor of subsequent AP to the extent that SE is accurately based on previous AP experience. Many researchers have argued that for SE to be of most benefit to AP, it should be reasonably accurate – marked over-confidence can lead to complacency, whereas substantial under-confidence can lead to disengagement (Artino, 2012; Bandura, 2012; Stone, 2000). The motivational component of SE is more likely to be successfully leveraged if SE beliefs are accurately calibrated, based on regular performance-feedback cycles (Artino, 2012; Mitchell et al., 1994; Stone, 2000). Thus, students should be provided with early and ongoing access to opportunities to perform, along with regular accurate feedback about their performance. The accuracy of feedback is especially important in the context of increased reluctance to provide negative feedback to students (Dinham, 2010), alongside research showing that miscalibration in the form of positive self-efficacy bias (over-confidence) is associated with poorer academic outcomes in undergraduate students (Talsma et al., 2019). We can view this as a self-efficacy parallel of the “unskilled and unaware” effect (Kruger & Dunning, 1999). It is possible, in this view, for a reduction in self-efficacy to be adaptive – to the extent that it results in greater calibration between SE and performance capacity. In the same vein, attempts to enhance SE for its own sake (i.e., independent of mastery experience, for example, through verbal persuasion) may not be desirable (Talsma et al., 2019).
Turning to implications for research, our findings suggest that attempts to directly compare effects from studies which differ in order of measurement of SE and AP may be comparing apples and oranges. To highlight this, consider the effect on our findings if studies using both orders of measurement had been included in a single meta-analysis: the opposite pattern in the strength of cross-lagged effects might have resulted in the directional effects washing each other out. Information about the order of measurement had to be obtained from authors directly for almost half of the 14 studies referred to in this review. Given that differences in measurement order may be associated with differences in the strengths of directional effects, it is critical that this information is published.
Limitations and directions for future research
firm causal inferences, and small sample size. If the tested model does not contain all relevant variables, which in such a complex relationship is unlikely, then strong conclusions cannot be drawn regarding causality (Selig & Little, 2012). However, CLPA helps to build an argument for causality, and is especially informative in complex cases where the required degree of experimental control may be impossible to achieve (Menard, 2007).
In the present analysis, readers may be particularly concerned about the small number of studies included. We note, however, that there is no specific minimum number of studies which can fruitfully be meta-analysed (Valentine, 2010). The findings of these few studies are very consistent (as reflected in strong observed power and relatively narrow CIs for the pooled correlations) giving cause for optimism that the results reported here are meaningful. That being said, further research is certainly needed with regard to the effect of measurement order on the reciprocity and strength of directional effects in the SE↔AP relationship.
We note also that these findings may be relevant to theoretical discussions regarding the multitude of related self-referent and meta-cognitive constructs explored by different researchers across disciplines. In particular, it would be interesting to explore how “self-efficacy after the fact”, as measured in these studies could relate to (or be differentiated from) various other types of retroactive monitoring judgements (see, for example, Hacker, Bol, & Keener, 2008; Stankov, Morony, & Lee, 2013; Zabrucky, 2010).
Finally, we note that the SE↔AP relationship is likely to reflect a backward infinite regress, rendering any data collection over a finite period inescapably truncated. Whichever variable is measured first, self-efficacy or performance, each is likely to contain some past influence of the other embedded within it. We would have to follow both variables back in time forever, just like the proverbial chicken and the egg, to draw any firm conclusions.
Conclusion
The present meta-analysis provides further evidence of reciprocal determinism in the relationship between SE and AP. With this reciprocity in mind, it is important to note that the effect sizes reported in cross-sectional meta-analyses (generally interpreted as reflecting a moderate influence of SE on AP) will also contain variance associated with the impact of previous AP on SE. That is, SE may have less impact on subsequent AP than effect sizes in the literature suggest – because much of what is measured as SE actually reflects the influence of past performance. Researchers and educators should be aware that research approaching SE and AP from a unidirectional standpoint likely leads to overestimation of the impact of SE on AP. Our findings suggest that the net influence is small. Thus, policies and practices aimed at realising large benefits to student performance through interventions designed specifically to increase SE may not deliver the anticipated outcomes.
with flow-on effects to both SE and subsequent AP. If performance-feedback cycles begin as early as possible in a course of study, the small positive effects of AP on SE, and vice-versa, have a greater chance of yielding “compound interest” over time.
References
Studies marked with asterisks were included in the present meta-analysis.
Artino, A. R. (2012). Academic self-efficacy: From educational theory to instructional practice. Perspectives on Medical Education, 1(2), 76-85. doi: 10.1007/s40037-012-0012-5
Bandura, A. (1997). Self-efficacy: The exercise of control. New York: Freeman.
Bandura, A. (2012). On the functional properties of perceived self-efficacy revisited. Journal of Management, 38(1), 9-44. doi: 10.1177/0149206311410606
*Chae, S. E. (2012). Contributions of prior knowledge, motivation, and strategies to Korean college students' L2 writing development. (AAI3495368). PsycINFO database.
Chen, P. P. (2003). Exploring the accuracy and predictability of the self-efficacy beliefs of seventh-grade mathematics students. Learning and Individual Differences, 14(1), 77-90. doi: 10.1016/j.lindif.2003.08.003
Gist, M. E., & Mitchell, T. R. (1992). Self-efficacy: A theoretical analysis of its determinants and malleability. Academy of Management Review, 17(2), 183-211. doi: 10.5465/AMR.1992.4279530
Gore, P. A. (2006). Academic self-efficacy as a predictor of college outcomes: Two incremental validity studies. Journal of Career Assessment, 14(1), 92–115. https://doi.org/10.1177/1069072705281367
Hacker, D. J., Bol, L., & Keener, M. C. (2008). Metacognition in education: A focus on calibration. In J. Dunlosky & R. A. Bjork (Eds.), Handbook of metamemory and memory (pp. 429-455). New York: Psychology Press.
*Kenney-Benson, G. A., Pomerantz, E. M., Ryan, A. M., & Patrick, H. (2006). Sex differences in math performance: The role of children's approach to schoolwork. Developmental Psychology, 42(1), 11-26. doi: 10.1037/0012-1649.42.1.11
Klassen, R. M., & Usher, E. L. (2010) Self-efficacy in educational settings: Recent research and emerging directions. Advances in Motivation and Achievement (Vol. 16A, pp. 1-33). Bingley, UK: Emerald Group.
Kock, N. (2014). Advanced mediating effects tests, multi-group analyses, and measurement model assessments in pls-based sem. International Journal of e-Collaboration, 10(1), 1-13. doi: 10.4018/ijec.2014010101
Kruger, J., & Dunning, D. (1999). Unskilled and unaware of it: How difficulties in recognizing one's own incompetence lead to inflated self-assessments. Journal of Personality and Social Psychology, 77(6), 1121-1134. doi:10.1037/0022-3514.77.6.1121
Lindsley, D. H., Brass, D. J., & Thomas, J. B. (1995). Efficacy-performing spirals: A multilevel perspective. Academy of Management Review, 20(3), 645-678. doi: 10.5465/ amr.1995.9508080333
Menard, S. (2007). Handbook of longitudinal research: Design, measurement, and analysis. New York: Academic Press.
Mitchell, T. R., Hopper, H., Daniels, D., George-Falvy, J., & James, L. R. (1994). Predicting self-efficacy and performance during skill acquisition. Journal of Applied Psychology, 79(4), 506-517. doi: 10.1037/0021-9010.79.4.506
Muthen & Muthen.
Pajares, F. (1997). Current directions in self-efficacy research. Advances in motivation and achievement (Vol. 10, pp. 1-49). Greenwich, CT: JAI Press.
Pajares, F., & Schunk, D. H. (2001). Self-beliefs and school success: Self-efficacy, self-concept, and school achievement. In R. Riding & S. Rayner (Eds.), Perception (pp. 239-266). London: Ablex Publishing.
Pajares, F., & Usher, E. L. (2008). Self-efficacy, motivation, and achievement in school from the perspective of reciprocal determinism. Advances in motivation and achievement (Vol. 15, pp. 391-423).
Richardson, M., Abraham, C., & Bond, R. (2012). Psychological correlates of university students' academic performance: A systematic review and meta-analysis. Psychological Bulletin, 138(2), 353-387. doi: 10.1037/a0026838
Ritchie, L. (2015). Fostering self-efficacy in higher education students. London, UK: Palgrave Macmillan.
Schneider, M., & Preckel, F. (2017). Variables associated with achievement in higher education: A systematic review of meta-analyses. Psychological Bulletin, 143(6), 565. doi: 10.1037/bul0000098
*Schünemann, N., Spörer, N., & Brunstein, J. C. (2013). Integrating self-regulation in whole-class reciprocal teaching: A moderator-mediator analysis of incremental effects on fifth graders' reading comprehension. Contemporary Educational Psychology, 38(4), 289-305. doi: 10.1016/j.cedpsych.2013.06.002
Selig, J. P., & Little, T. D. (2012). Autoregressive and cross-lagged panel analysis for longitudinal data. In B. Laursen, T. D. Little, & N. A. Card (Eds.), Handbook of developmental research methods (pp. 265-278). New York: Guilford Press.
Shea, C. M., & Howell, J. M. (2000). Efficacy-performance spirals: An empirical test. Journal of Management, 26(4), 791-812. doi: 10.1177/014920630002600409
Simonsohn, U., Nelson, L. D., & Simmons, J. P. (2015). Official user-guide to the p-curve. Retrieved from www.p-curve.com/guide.pdf
Stankov, L., Morony, S., & Lee, Y. P. (2013). Confidence: The best non-cognitive predictor of academic achievement? Educational Psychology, 34(1), 9-28. doi: 10.1080/01443410.2013.814194
Stone, N. J. (2000). Exploring the relationship between calibration and self-regulated learning. Educational Psychology Review, 12(4), 437-475. doi: 10.1023/A:1009084430926
Talsma, K., Schuz, B., & Norris, K. (2019). Miscalibration of self-efficacy and academic performance: Self-efficacy ≠ self-fulfilling prophecy. Learning and Individual Differences, 62, 182-195. doi: 10.1016/j.lindif.2018.11.002
Talsma, K., Schüz, B., Schwarzer, R., & Norris, K. (2018). I believe, therefore I achieve (and vice versa): A meta-analytic cross-lagged panel analysis of self-efficacy and academic performance. Learning and Individual Differences, 61, 136-150. doi:10.1016/j.lindif.2017.11.015
Valentine, J. C., Pigott, T. D., & Rothstein, H. R. (2010). How many studies do you need?: A primer on statistical power for meta-analysis. Journal of Educational and Behavioral Statistics, 35(2), 215-247. doi: 10.3102/1076998609346961
Vancouver, J. B., Alicke, M., & Halper, L. R. (2018). Self-efficacy. In The self at work: Fundamental theory and research. (pp. 15-39). New York, NY: Routledge/Taylor & Francis Group.
Viechtbauer, W. (2010). Conducting meta-analyses in R with the Metafor package. Journal of Statistical Software, 36(3), 1-48. doi: 10.18637/jss.v036.i03
world implications. Procedia: Social and Behavioral Sciences, 2(2), 1266-1269. doi: 10.1016/j.sbspro.2010.03.185