NORTH CAROLINA
COMMUNITY CHILD
PROTECTION TEAM
Forward
This year, the North Carolina Community Child Protection Team (CCPT) Advisory Board focused on a recurring issue faced by child welfare—the access of children and their families to mental health, substance abuse, and developmental disabilities services. We surveyed local CCPTs to learn about their experience with access to needed services and about their strategies for overcoming barriers to access.
We assumed that barriers to access can be overcome by developing a system of care in which youth and their families make and carry out plans in collaboration with their informal supports and formal services. At the family level, child and family teams are a means of putting system of care into action; at the system level, CCPTs are means of strengthening a system of care. Our survey questions asked about both family and community strategies.
We extend our appreciation to the 71 county CCPTs who completed the online survey. The survey and this report were prepared by Dr. Joan Pennell at NC State University, Center for Family and Community Engagement. She was assisted by Erika Brandt.
On the basis of the survey findings, we developed a series of recommendations on how to improve service access. Our conclusions were enriched by the expansion of the Advisory Board to encompass representation from youth and family partners and from different community organizations and public agencies. This expansion meant that our state-level board mirrored what we aim for in the membership of local CCPTs.
Respectfully submitted,
Nicki Perry CCPT Advisory Board Chair 2014, Terri Reichert NC Division of Social Services
Judith Ayers Currituck Co. Department of Social Services Molly Berkoff M.D.
Cindy Bizzell NC Administrative Office of the Courts Natalie Brayboy Warren Co. Department of Social Services Eric Breit Prevent Child Abuse NC
Terry Brubaker Craven Co. Department of Social Services George Bryan The Children’s Home, CEO
Brandi Cooper EBCI Public Health and Human Services Brenda Edwards Public Health Director
Stephanie Francis Interact
Ryan Hill NC Department of Health and Human Services, Ann-Marie Hoo The Healing Place
Rachel Larsen NC Child Abuse Resource Prosecutor
Wanda Marino New Hanover Co. Department of Social Services Tilda Marshall Edgecombe Co. Department of Social Services Marcella Middleton SaySO
Lou Parton Polk Co. Department of Social Services Greg Richardson NC Commission of Indian Affairs
Executive Summary
Community Child Protection Teams and Continuous Quality Improvement
North Carolina statute charges local Community Child Protection Teams (CCPTs) with reviewing child protection cases and identifying ways to improve child welfare in their communities. Local CCPTs report their findings both to their county commissioners and to the North Carolina Division of Social Services (NCDSS). On an annual basis, the North Carolina CCPT Advisory Board conducts an online survey of local CCPTs. Based on the survey data, the Advisory Board makes recommendations to NCDSS on how to better protect children and youth and support their families. NCDSS then provides a written response to the recommendations.
The CCPT report and the NCDSS response are incorporated into the Annual Progress and Services Report to the US Department of Health and Human Services, Administration for Children and Families. This report is one of the requirements in the federal Child Abuse Prevention and Treatment Act (CAPTA). In 1997 North Carolina designed the Community Child Protection Team as its Citizen Review Panel with responsibility for this report. The purpose of Citizen Review panels is to provide opportunities for citizens to play an integral role in ensuring that states are meeting their goals of protecting children from maltreatment. The feedback loop promotes continuous quality improvement of child welfare.
Focus on System-of-Care Strategies to Improve Access to Mental Health, Substance Abuse, and Developmental Disabilities (MH/SA/DD) Services
This year, the North Carolina Community Child Protection Team (CCPT) Advisory Board decided to focus on a recurring and complex issue faced by child welfare across the state. This issue was the access of children, youth, and their families to mental health, substance abuse, and developmental disabilities (MH/SA/DD) services. The focus on service access was supported by the findings from last year’s survey of local CCPTs. The 2013 survey found that lack of access to mental health services was the most frequently cited risk factor reported by CCPTs in reviewing case files. The second most cited risk factor was
substance abuse. Along with concerns about domestic violence, these same issues were identified in earlier surveys.
Survey Participants
Out of the 100 local CCPTs, 71 completed the online survey. The CCPTs participating in the survey were relatively representative of North Carolina counties. They spanned from the Eastern to Western regions of the state and included counties with different population sizes. For each region of the state, a Local Management Entity (LME)-Managed Care Organization (MCO) develops, carries out, and monitors mental health, developmental disabilities, and substance abuse services. Each county is affiliated with one of the nine LMEs-MCOs. The LMEs-MCOs had between 50 to 83% of their member counties responding to the CCPT survey
Case Reviews Identified Need for Service Access
One of the responsibilities of CCPTs is to review cases of children in need of protection. In 2014, 80% of the CCPTs reported reviewing at least 1 case. The CCPTs reviewed on average 6 cases. Their reviews particularly identified the need for children, youth, and parents or caregivers to access Mental Health services.
System and Family Issues Keeping Children and Families from Accessing Needed MH/SA/DD Services
The CCPTs estimated the frequency with which different access problems occurred in their county. Both system and family barriers were prevalent across counties. Transportation challenges had the highest frequency of all access problems. Difficulties with the service network were common and included problems such as the unavailability of quality services and qualified providers. These systemic issues occurred among member counties of all nine LME-MCOs. Family issues such as the parents’ lack of understanding about locating and arranging services also impeded access.
System-of-Care Strategies to Tackle MH/SA/DD Service Access Problems
The counties used a number of system-of-care strategies to tackle barriers to service
access. These strategies included child and family teams, cross-system collaborations, and community education. Most counties did not have an automated case management system for child welfare; if they did have such a system, they were more likely to have a data-sharing agreement between Mental Health and Child Welfare. For the most part, counties did not utilize family and youth partners to assist families, and such partnerships were concentrated in a minority of counties. Nevertheless, counties were using a number of strategies to involve family and youth partners. The most common of these strategies was including them in a collaborative team, and the least common was providing a stipend.
Child and Family Teams (CFTs) Benefiting Children, Youth, and Parents
return to their parents or placement with relatives (Washington, DC—Pennell et al., 2010; Texas—Wang et al., 2012).
CFTs Primarily Facilitated by Social Services and Secondarily by Mental or Behavioral Health
Child welfare cases requiring access to MH/SA/DD services were most often facilitated by Social Services and secondarily by Mental or Behavioral Health. All nine LME-MCOs had member counties in which Mental or Behavioral Health facilitated sometimes or often. Per LME-MCO, the percentage of member counties with Mental or Behavioral Health facilitating at least some of the time ranged from 60% to 100%.
CFT Attendance Varied Among Family Members and Among Involved Organizations
For CFTs related to MH/SA/DD service access, the most frequent family attendees were mothers with other family members, including the children/youth and fathers, present to a lesser extent. After Social Services, the two agencies represented the most frequently at the CFTs were Guardian ad Litem and Mental or Behavioral Health. Family and youth partners sometimes attended. For each LME-MCO, the percentage of member counties with Mental or Behavioral Health facilitating at least some of the time ranged from 70% to 100%. The impact of who is present and absent from meetings needs more study. A
Cumberland County study matched school and child welfare data from 347 CFTs. The data analysis found that students were less likely to change placements if they were present at their CFT meeting and if a school official was present (Pennell & Rikard, 2013).
Family-level Strategies for Improving CFTs Prevalent but System-level Strategies Unevenly Applied
Counties across the board used family-level strategies to improve CFT meetings, but more counties could attend to preparing professionals, encouraging the participation of children and youth, and scheduling follow-up CFTs. The county’s use of system-level strategies was quite uneven. Setting procedures and sharing information were common among the
counties. Reimbursing Mental Health providers, however, stood out as an area for work in most counties. In their recommendations, local CCPTs emphasized increasing collaboration among partners, providing outreach and education to professionals and families, and
seeking more financial assistance including to reimburse Mental Health providers.
Advisory Board Recommendations
Table of Contents
Introduction ... 1
2014 Survey ... 2
Survey Purpose, Focus, and Development ... 2
Survey Content and Administration ... 3
Survey Participants ... 4
Results ... 4
Case Reviews Identified Need for Service Access ... 4
System and Family Issues Keeping Children and Families from Accessing Needed MH/SA/DD Services ... 6
System-of-Care Strategies to Tackle MH/SA/DD Service Access Problems ... 9
Child and Family Teams Benefiting Children, Youth, and Parents ...13
CFTs Primarily Facilitated by Social Services and Secondarily by Mental or Behavioral Health ...16
CFT Attendance Varied Among Family Members and Among Involved Organizations ...17
Family-level Strategies for Improving CFTs Prevalent but System-level Strategies Unevenly Applied ...19
Advisory Board Recommendations ...22
References ...23
Appendices ...24
Appendix A ...24
List of Tables
Table 1: Number of Cases Reviewed in 2014, by County Size ... 5
Table 2: Number of Reviewed Cases for Children and/or Youth or Parents and/or
Caregivers Served by Public Child Welfare and Requiring Access to MH/SA/DD Services 5
Table 3: Frequency of Problems Affecting Access to Needed MH/SA/DD Services for Children/Youth Served by Public Child Welfare ... 6
Table 4: Frequency of Other Problems Affecting Access to Needed MH/SA/DD Services for Children, Youth, and Their Parents or Caregivers Served by Public Child Welfare
... 7
Table 5: Use of Strategies for Helping Children/Youth and Parents/Caregivers Gain Access to Needed MH/SA/DD Services ...10
Table 6: Cross-Tabulation of Automated Case Management Systems and Data Sharing Agreements in Public Child Welfare Systems
...12
Table 7: Strategies Supporting Involvement of Family or Youth Partners ...13
Table 8: Frequency of CFT Benefits to Children/Youth and/or Parents/Caregivers Served by Public Child Welfare and Requiring Access to MH/SA/DD Services
...14
Table 9: Frequency of Organizations’ Facilitating CFT Meetings for Children/Youth and/or Parents/Caregivers Served by Public Child Welfare and Requiring Access to MH/SA/DD Services ...17
Table 10: Frequency of Attendance by Family Members and Organizations to CFT
Meetings for Children/Youth and/or Parents/Caregivers Served by Public Child Welfare and Requiring MH/SA/DD Services
...18
Table 11: Use of System-Level Strategies for Improving CFT Meetings for Children/Youth and/or Parents/Caregivers Served by Public Child Welfare and Requiring Access to
MH/SA/DD Services ...20
Table 12: Use of Family-Level Strategies for Improving CFT Meetings for Children/Youth and/or Parents/Caregivers Served by Public Child Welfare and Requiring Access to
MH/SA/DD Services ...21
Table A1: Counties Covered in Survey Report ...24
Table A2: LME-MCOs and Number of Member Counties Responding to Survey ...25
Table A4: Existence of Systems for Tracking Child and Family Team (CFT) Meetings Held for Children/Youth and Families at Local Social Services...26
Table A5: Willingness to Ask Local Social Services to Share CFT Tracking Systems ...26
Table A6: Greatest Challenges Identified by Survey Participants in Holding Helpful CFT Meetings for Children/Youth and/or Parents/Caregivers Served by Public Child Welfare and Requiring Access to MH/SA/DD Services ...26
North Carolina Community Child
Protection Teams (CCPT)
2014 End-of-Year Report
North Carolina CCPT Advisory Board
Submitted to the North Carolina Division of Social Services
Introduction
North Carolina statute charges local Community Child Protection Teams (CCPTs) with reviewing child protection cases and identifying ways to improve child welfare in their communities. County Social Services directors are responsible for supporting these efforts of their local CCPTs. Local CCPTs report their findings both to their county commissioners and to the North Carolina Division of Social Services
(NCDSS). On an annual basis, the North Carolina CCPT Advisory Board conducts an online survey of local CCPTs. Based on the survey data, the Advisory Board makes recommendations to NCDSS on how to better protect children and youth and support their families. NCDSS then provides a written response to the
recommendations.
The CCPT report and the NCDSS response are incorporated into the Annual
Progress and Services Report to the US Department of Health and Human Services, Administration for Children and Families. This report is one of the requirements in the federal Child Abuse Prevention and Treatment Act (CAPTA). In 1997 North Carolina designed the Community Child Protection Team as its Citizen Review Panel with responsibility for this report. The purpose of Citizen Review panels is to provide opportunities for citizens to play an integral role in ensuring that states are meeting their goals of protecting children from maltreatment.
The entire CCPT feedback loop serves as a means of continuous quality
improvement of child welfare in the state. More information about CCPTs is posted on the NCDSS website under Community Child Protection Teams, and the findings from prior CCPT reports and the NCDSS responses are included in the 2014 Annual Progress and Services Report
The 2014 survey asked local CCPTs about their experience with access to needed services and about their strategies for overcoming barriers to access. The survey questions covered both family and systemic factors affecting access. The questions also inquired specifically about the extent to which child and family teams (CFTs) and community collaboration helped in overcoming barriers to access. Both of these strategies are seen as integral to building a system of care with and around children, youth, and families. CFTs include the family members as well as their informal networks and formal services in making and implementing plans. Collaborations are a way of building the community support necessary for safeguarding young people and their families.
This report summarizes what was learned from the survey and presents a series of recommendations on how to improve the access of children, youth, and their families to needed services. In making its recommendations, the Advisory Board benefited from its recently expanded membership. The members included youth and family partners and different community organizations and public agencies. At the Board meeting in March 2015, each group brought its own distinctive perspectives to the deliberations.
The report begins by describing the development of the 2014 survey and patterns in survey participation. Next the key findings are reviewed. The report concludes with the Advisory Board’s recommendations to NCDSS. The appendices provide
additional detail on the survey results (Appendix A) and include a copy of the survey instrument (Appendix B).
2014 Survey
Survey Purpose, Focus, and Development
The purpose of the annual CCPT survey is to assess what issues affect child welfare delivery across the state and identify what strategies can be deployed to resolve these issues and improve child and family outcomes. The effectiveness and
efficiency of the feedback process is increased if annual surveys are constructed on the basis of learning from prior surveys.
This year’s survey built upon the foundation provided by the prior 2013 CCPT report of findings and recommendations. In particular, the 2014 survey followed up on the 2013 recommendations of the Advisory Board to connect CCPTs more closely with two reform efforts. The first reform was system of care that uses child and family teams (CFTs) to wrap unified supports and services around children and their
families. The 2013 report identified that local CCPTs could better advance system of care if they had greater representation across disciplines and by family and youth partners.
For the 2014 survey, the Advisory Board selected one topic: the lack of access of children, youth, and their families to needed mental health, substance abuse1, and
developmental disabilities services. The Advisory Board also agreed that the 2014 survey should explore the role of CFTs and community collaborations in improving access. Recognizing the complex and chronic nature of this issue, the Board envisioned continuing with the same focus into the 2015 survey.
The two overarching questions addressed by the 2014 survey were: 1. What are the barriers to access?
2. What are the means of overcoming these barriers?
To specify the meaning of key terms, the survey provided definitions posted in the
glossary of the NC Division Mental Health, Developmental Disabilities, and Substance Abuse Services (MHDDSAS). The term access was defined as “the ability to get array of available treatments, services and supports needed.” To identify potential problems with service access, the survey questions tapped into findings from two surveys previously conducted in the state: the Child and
Adolescent Health Measurement Initiative and the Child and Adolescent Services Assessment.
Survey Content and Administration
The first page of the survey described its purpose to improve public child welfare and its basis in state and federal statutes. The second page gave instructions on how to complete the survey, and a blank copy of the survey was attached so that
respondents could ask team members for their input on the questions. The third page outlined the terms and conditions of participation in the survey. It stressed that participation was voluntary and that answers would not be linked to individual
CCPTs. If respondents consented to participate, they could then proceed to completing the survey questions.
Multiple choice or fill-in the blank survey questions covered the following: the
respondent’s county or reservation, the type of CCPT, the number and type of cases reviewed by the CCPT in 2014, the extent of specific problems in accessing needed services, strategies for overcoming service access problems, strategies for involving family or youth partners, data management systems for tracking child and family team (CFT) meetings, benefits of CFT meetings, organizations facilitating and attending CFT meetings, and system-level and family-level stratgies for improving CFT meetings. The last two questions were open-ended and asked about local challenges to holding CFT meetings and about recommendations for overcoming these challenges. See Appendix B for a blank copy of the survey.
To recruit participants, NCDSS did the following: (1) sent a memo to remind local Directors of Departments of Social Services and their Program Managers of Child Welfare of the upcoming annual CCPT survey and the requirement that they support completion of the survey, (2) sent an e-mail message to the Chairs of the CCPTs to ask them to complete the survey and provide them with the link to the survey, and
(3) sent an e-mail reminder and a follow-up email reminder to local CCPT Chairs whose teams had not yet submitted a survey to do so and to provide them with the link to the survey.
The online survey was administered in the software program Qualtrics. To safeguard confidentiality, the survey responses were transmitted directly to NC State University for analysis. This meant that NCDSS and the Advisory Board did not view responses linked to individual CCPTs. The survey protocols were approved by the NC State University’s Institutional Review Board for the Use of Human Subjects in Research.
Survey Participants
Out of the 100 local CCPTs, 71 completed the online survey. See appended Table A1 for a list of these CCPTs (note that appended Tables begin with A). An additional two CCPTs later sent their responses directly to NCDSS and were not included in the data analyses. The CCPTs participating in the survey were relatively
representative of North Carolina counties. They spanned from the Eastern to
Western regions of the state, and in terms of population size, they included 36 of 51 (71%) small, 30 of 39 (77%) medium, and 5 of 10 (50%) large counties.
For each region of the state, a Local Management Entity (LME)-Managed Care Organization (MCO) develops, carries out, and monitors mental health,
developmental disabilities, and substance abuse services. Each county is affiliated with one of the nine LMEs-MCOs. The LMEs-MCOs had between 50 to 83% of their member counties responding to the CCPT survey (see Table A2).
CCPTs have the option of whether to have one combined CCPT team conduct the reviews of both the child maltreatment cases and child fatalities cases or to separate these functions into two teams—a CCPT and Child Fatality Prevention Team
(CFPT). Among the 71 responding CCPTs, 18 (25%) indicated they had separate CCPTs and CFPTs, and the other 53 (75%) had combined teams (see Table A3). Percentages for separate or combined teams found this year are similar to those reported on last year’s CCPT survey.
Results
Case Reviews Identified Need for Service Access
Table 1
Number of Cases Reviewed in 2014, by County Size
Size of County Number of CCPTs Mean Std. Dev.
Small 30 5.90 5.57
Medium 28 5.93 5.50
Large 5 11.60 16.64
Total 63 6.37 6.92
Note. Outlier with 108 cases removed.
The next set of survey questions asked about the number of reviewed cases in which the children or youth and the parents or caregivers needed access to mental health, substance abuse, or developmental disabilities (MH/SA/DD) services. It should be noted that five CCPTs reported cases with access difficulties without having reported the number of total cases reviewed. Once the questions on number of cases and number of cases with access difficulties are combined, 14 (19.7%) did not report any cases reviewed while 57 (80.3%) did report cases reviewed.
Among the 57 CCPTs reporting reviews of cases, most identified the need for access to at least some of these services. Table 2 below shows how many CCPTs reported the need for access to these services and the average number of cases requiring this access.
The highest reported need was for access to mental health services for both children (42 CCPTs) and parents (50 CCPTs). The second highest need for children was access to developmental disabilities services (36 CCPTs) and for parents was
access to substance abuse services (47 CCPTs). The third level of need for children was to substance abuse services (20 CCPTs) and for parents was to developmental disabilities services (18 CCPTs).
Table 2
Number of Reviewed Cases for Children and/or Youth or Parents and/or Caregivers Served by Public Child Welfare and Requiring Access to MH/SA/DD Services
Services
Children/Youth Parents/Caregivers
Number of CCPTs
Mean Std. Dev.
Number of CCPTs
Mean Std. Dev.
Mental Health 42 4.68 3.85 50 4.96 4.11
Substance Abuse 20 2.61 3.22 47 4.00 3.69
Developmental
Disabilities 36 1.91 1.38 18 1.41 0.80
In summary, 80% of the CCPTs reported reviewing at least 1 case. On average, they reviewed 6 cases in 2014. Their reviews identified the need, especially, for children, youth, and parents or caregivers to access Mental Health services.
System and Family Issues Keeping Children and Families from Accessing Needed MH/SA/DD Services
The survey listed a series of reasons why children and families served by public child welfare might not be able to access needed mental health, substance abuse, and developmental disabilities services. The CCPTs were then asked to estimate the frequency with which these access problems occurred in their county on a scale of never, rarely, sometimes, or often.
The first set of questions asked about problems affecting children or youth’s access to needed services. The results are summarized in Table 3. For all three problems the median, that is, the midpoint, is sometimes. The distribution of scores showed that coordination of care was somewhat more elevated as an issue than families not sharing in decision making or a lack of health insurance. Among the responding CCPTs, 49 (76.6%) identified coordination of care as a problem sometimes or often. In contrast, for the other two issues, the CCPTs identified them as affecting access sometimes or often at 39 (58.2%) for families not sharing in decision making and 36 (53.7%) for a lack of health insurance.
Table 3
Frequency of Problems Affecting Access to Needed MH/SA/DD Services for Children/Youth Served by Public Child Welfare
Frequency
Problem Never Rarely Sometimes Often Mean
Had unmet needs for coordination of
care 7 8 27 22 3.00
Lacked adequate health insurance 10 21 24 12 2.57
Had families who did not share in decision-making around issues important to their child's health
8 20 35 4 2.52
Note. The means are calculated with low = 1, rarely = 2, sometimes = 3, and often = 4. The median (the
midpoint) for the frequency of all the problems was sometimes (3).
Further examination of the results found that these problems were generally not concentrated in any one LME-CMO. No LME-CMO had the majority of their
responding CCPTs stating that lack of health insurance and not including families in decision making often happened. Regarding coordination of care, 8 out of 9 LME-CMOs did not have a majority of CCPTs responding that this problem often
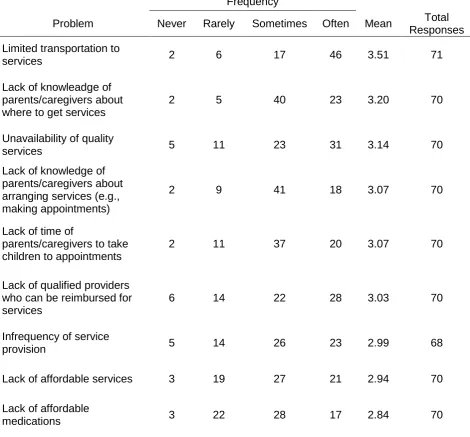
Next the CCPTs were asked how often 17 different problems affected access for child, youth, and their parents or caregivers served by public child welfare in their county. In addition, CCPTs could write in other problems. Table 4 shows that CCPTs as a whole experienced all the 17 listed problems with some noting other problems. Their mean responses were above rarely (2) on all these problems. Counting the number of problems occurring sometimes or often per county, individual counties identified having between 0 and 19 of the problems, with an average of 11.3 problems (SD = 4.23). As would be expected, the average number of problems increased with county size: 9.75 for small counties (SD = 4.51), 12.87 for medium counties (SD = 3.05), and 13.40 for large counties (SD = 4.78).
Table 4
Frequency of Other Problems Affecting Access to Needed MH/SA/DD Services for Children, Youth, and Their Parents or Caregivers Served by Public Child Welfare
Frequency
Problem Never Rarely Sometimes Often Mean Total
Responses
Limited transportation to
services 2 6 17 46 3.51 71
Lack of knowleadge of parents/caregivers about where to get services
2 5 40 23 3.20 70
Unavailability of quality
services 5 11 23 31 3.14 70
Lack of knowledge of parents/caregivers about arranging services (e.g., making appointments)
2 9 41 18 3.07 70
Lack of time of
parents/caregivers to take children to appointments
2 11 37 20 3.07 70
Lack of qualified providers who can be reimbursed for services
6 14 22 28 3.03 70
Infrequency of service
provision 5 14 26 23 2.99 68
Lack of affordable services 3 19 27 21 2.94 70
Lack of affordable
Domestic violence keeping parents/caregivers from accessing services
6 12 38 12 2.82 68
Lack of support persons to accompany individuals to appointments
4 18 31 13 2.80 66
Refusal of children/youth to
accept services 5 20 33 12 2.74 70
Lack of interpreters for
non-English speakers 8 19 29 11 2.64 67
Reluctance of
parents/caregivers to use services out of fear that they will be seen as unfit
caregivers by Social Services
6 22 36 4 2.56 68
Embarrassment of parents/caregivers about using services in their cultural communities
7 23 30 4 2.48 64
Lack of interpreters for deaf
individuals 13 21 18 6 2.29 58
Lack of information materials
for low-literacy individuals 13 25 23 3 2.25 64
Other 1a 1 0 1 7 3.56 9
Other 2b 1 0 1 4 3.33 6
Note. The means are calculated with low = 1, rarely = 2, sometimes = 3, and often = 4.
aProblems included in “Other 1” category were: lack of nurse consultant in day care, lack of services for
perpetrators of sexual abuse and domestic violence, lack of availability of services and funding for disabled children, lack of motivation to access services, therapeutic foster homes, lack of holistic trauma-informed services for parents/caregivers of maltreated children/youth, and parents/caregivers’ refusal to access services.
bProblems included in “Other 2” category were: lack of mental health services in schools, lack of flexibility in
services for substance abusers, high staff turnover of mental health and substance abuse providers, lack of significant consequence for failure to access services, and lack of mental health facility in the area.
The most commonly reported problem was limited transportation to services. Nearly two-thirds of the CCPTs stated that this problem often happened. The impact of transportation was the case across the board, without regard to the population size of the county. It should be noted that some “small” counties were geographically large compared to other counties. Transportation problems were likely exacerbated by the often reported lack of support persons to accompany parents to
Other problems frequently identified related to the service network. These included the unavailability of quality services, lack of qualified providers who could be
reimbursed, infrequency of service provision, unaffordability of services, and unaffordability of medications. Using the option to write in other problems, the CCPTs primarily elaborated on barriers posed by the service system. A count of the five system problems listed found that they occurred sometimes or often in all nine LME-CMOs. For the individual LME-CMOs, their number averaged between 2.50 to 4.60 problems.
Other frequently cited problems pertained to the parents or caregivers: their lack of knowledge about where to get services or how to arrange services and their lack of time to take children to appointments. In addition, domestic violence kept parents from accessing services. CCPTs also identified that children or youth might refuse to accept services.
To a lesser extent, CCPTs indicated that parents might not reach out for services because of the lack of interpreters for non-English speaking individuals, fears that Social Services might see them as unfit parents, or embarrassment about accessing services in their cultural community. The problems with the lowest rated frequency concerned specific groups: individuals who were deaf or who had low-literacy skills.
In summary, both system and family barriers were prevalent across counties. Transportation challenges had the highest frequency of all access problems. Difficulties with the service network were common and included problems such as the unavailability of quality services and qualified providers. These systemic issues occurred among member counties of all nine LME-MCOs. Family issues such as the parents’ lack of understanding about locating and arranging services also impeded access.
System-of-Care Strategies to Tackle MH/SA/DD Service Access Problems
Turning from problems to strategies, the survey asked the CCPTs to consider system-of-care approaches that had been used in their county to increase service access. On a list of 17 strategies, they were asked to respond if their county had used the strategy in 2014. Additionally, they could write in other strategies which had been applied. As summarized in Table 5, 11 out of the 17 listed strategies were used in more than half (over 36) of the counties according to the responding CCPTs.
A count of a possible 19 strategies (including the 2 other categories) found that individual CCPTs indicated that they had employed between 0 and 19 of the
Table 5
Use of Strategies for Helping Children/Youth and Parents/Caregivers Gain Access to Needed MH/SA/DD Services
Use
Strategy Yes No DK Total Responses
Child and family teams creating and
implementing plans 63 5 1 69
Community presentations/forums 61 7 2 70
Workshops for resource parents (foster,
therapeutic foster, kin, adoptive) 58 9 3 70
Joint training across the disciplines involved in
child welfare 57 13 0 70
Joint meetings of LME/MCO and child welfare to
address systemic issues 55 11 4 70
Development of multi-disciplinary teams to
improve service delivery 53 16 1 70
Joint meetings of LME/MCO and child welfare to
staff individual cases 52 16 2 70
Having Local Management Entity (LME) or Managed Care Organization (MCO) attend child welfare staff meetings
46 22 2 70
Posting resource information on a website 40 25 5 70
Joint development of protocols by LME/MCO and
child welfare to improve service coordination 39 25 6 70
Joint development of protocols by LME/MCO and
child welfare to increase access to services 37 28 5 70
Family workshops/cafés 28 34 7 69
Having a data sharing agreement between Social
Services and Mental Health 27 38 5 70
Family/youth partner with experience of receiving
services providing support to families 23 38 8 69
Family/youth partners with experience of receiving services helping families navigate access to services
Family/youth partners with experience of
receiving services providing training 20 40 7 67
Having an automated case management system
for child welfare 12 49 9 70
Other 1a 7 1 2 10
Other 2b 5 1 2 8
Note. DK = Don’t Know.
aResponses included in “Other 1” category were: LINKS Program and Placement Social Workers assisting
custody youth, In-Home Services Social Worker assisting youths within their families, and attending community meetings to discuss information regarding child welfare.
bResponses included in “Other 2” category were: youth mentoring, child advocacy partnering with mental health
providers, providing education to multi-cultural service providers, outreach services, and critical case staffing.
The most commonly cited strategy for removing access barriers was child and family team (CFTs) meetings. This approach was checked yes by 63 out of 71 CCPTs. The finding is consistent with child welfare policy in North Carolina mandating the use of CFT meetings and different child-and-family-serving systems viewing CFTs as integral to coordinating a system of care. Nevertheless, attention needs to be paid to the minority of counties who were not using CFTs.
In second and third place were two educational strategies: community presentations and resource parent workshops. Both were used by over four-fifths of counties. Far fewer counties held family workshops or cafés, with this approach employed by under two-fifths of counties. Another fairly common educational strategy was posting information on websites.
A set of seven strategies referred explicitly to cross-system efforts between child welfare and mental health or other disciplines. These included joint training, meetings, teaming, case staffings, and protocol development. Each of these
strategies was used by 37 to 57 counties. An eighth cross-system effort was far less common. This concerned having a data-sharing agreement between Social Services and Mental Health. Only 27 stated that they had such an agreement. For each LME-CMO, least one member county reported that they had a data-sharing agreement.
A count of the 8 cross-system strategies found that counties used between 0 and 8 of the strategies, with the average at 5.15 (SD = 2.48). The member counties of the LME-CMOs varied widely in their use of these strategies, ranging from an average of 3.30 up to 7.50 strategies. Again a reminder is in order that not all member counties for each LME-CMO completed the CCPT survey.
Among the 17 listed strategies, the least used was having an automated case management system. Only 12 CCPTs checked yes that they had such a system in their county; in contrast, 49 said no, 9 indicated don’t know, and 1 did not respond. Whether or not a county Social Services has its automated system, implementation of a data-sharing agreement between Social Services and Mental Health does occur. In fact, as seen in Table 6, 16 counties had an agreement without their Social
agreement with Mental Health while 3 did not have such an agreement (1 missing datum).
Table 6
Cross-Tabulation of Automated Case Management Systems and Data Sharing Agreements in Public Child Welfare Systems
Existence of a data sharing agreement between Social Services and Mental Health
Yes No Total
Existence of an automated case management system for child welfare
Yes 8 3 11
No 16 30 46
Total 24 33 57
Note. 57 CCPTs provided data for both data-sharing agreement and automated system.
After the automated system, a set of three strategies stand out for their low
utilization. These all refer to partnering with youth and families in overcoming access barriers. The survey provided the definition of family partners developed by NC Families United and adopted by the NC Collaborative for Children, Youth and Families: “a caregiver/parent of someone who has received services and therefore
has firsthand experience within the child and family system, or who has gone
through the system themselves.” In addition, the survey inserted “youth partner with experience of receiving services.”
The three strategies were about involving youth and family partners in supporting families, helping families navigate access to services, and providing training. Each of these strategies was used by under one-third of the counties. Moreover, use of all 3 partnering strategies was concentrated in a minority of counties: 7 counties used 1 strategy, 4 used 2 strategies, and 16 used 3 strategies.
Table 7
Strategies Supporting Involvement of Family or Youth Partners
Strategy Number Percent
Inclusion in a collaborative team 57 80.28%
Ongoing professional development 34 47.89%
Reimbursement for expenses (e.g., travel, meals) 20 28.17%
Mentoring by other family/youth partners 19 26.76%
Orientation to the work 18 25.35%
Stipend for services provided 11 15.49%
Othera 3 4.23%
aResponses included in “Other” category were: Family Support Network offers ongoing training, none of the listed
strategies used at this time, and no identified family/youth partners in county (recruiting).
In summary, the counties used a number of system-of-care strategies to tackle barriers to service access. These strategies included child and family teams, cross-system collaborations, and community education. Most counties did not have an automated case management system for child welfare; if they did have such a system, they were more likely to have a data-sharing agreement between Mental Health and Child Welfare. For the most part, counties did not utilize family and youth partners to assist families, and such partnerships were concentrated in a minority of counties. Nevertheless, counties were using a number of strategies to involve family and youth partners. The most common of these strategies was including them in a collaborative team, and the least common was providing a stipend.
Child and Family Teams Benefiting Children, Youth, and Parents
The next group of survey questions focused on child and family team (CFTs). First, the CCPTs were asked if their county Department of Social Services (DSS) had a system for tracking CFT meetings. Over half (39) responded yes, with another 6 noting that their DSS had a system in development (see Table A4). Most of those with a system were willing to ask their local DSS to share their system (see Table A5).
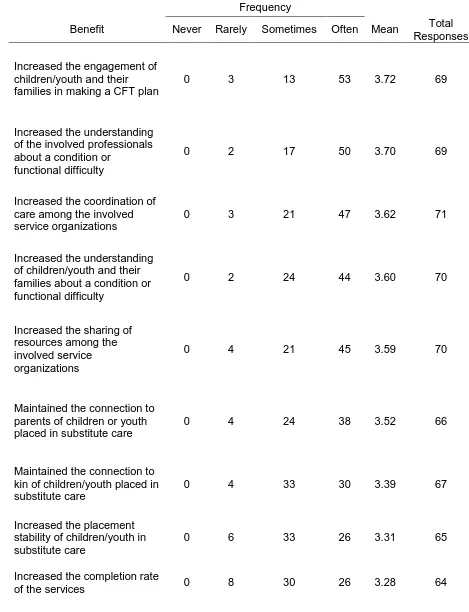
Then CCPTs were asked about the benefits of CFTs in their county for children, youth, parents, and/or caregivers who required access to Mental Health, Substance Abuse, or Developmental Disability Services. They were provided with a list of 17 potential positive results with space to add in two others. The CCPTs were asked to estimate the frequency with which these benefits occurred in their county on a scale of never, rarely, sometimes, or often.
Table 8
Frequency of CFT Benefits to Children/Youth and/or Parents/Caregivers Served by Public Child Welfare and Requiring Access to MH/SA/DD Services
Frequency
Benefit Never Rarely Sometimes Often Mean Total
Responses
Increased the engagement of children/youth and their families in making a CFT plan
0 3 13 53 3.72 69
Increased the understanding of the involved professionals about a condition or
functional difficulty
0 2 17 50 3.70 69
Increased the coordination of care among the involved service organizations
0 3 21 47 3.62 71
Increased the understanding of children/youth and their families about a condition or functional difficulty
0 2 24 44 3.60 70
Increased the sharing of resources among the involved service organizations
0 4 21 45 3.59 70
Maintained the connection to parents of children or youth placed in substitute care
0 4 24 38 3.52 66
Maintained the connection to kin of children/youth placed in substitute care
0 4 33 30 3.39 67
Increased the placement stability of children/youth in substitute care
0 6 33 26 3.31 65
Increased the completion rate
Increased the school stability of children/youth in substitute care
0 9 30 26 3.26 65
Increased the quality of the
services provided 0 7 36 23 3.24 66
Increased the resources made available to youth transitioning into adulthood
1 13 25 23 3.13 62
Reduced the time to referral
for a service 0 9 42 16 3.10 67
Reduced the time from entry into substitute care to return home
0 12 33 16 3.07 61
Reduced the time from referral to enrollment in the service
0 11 37 14 3.05 62
Reduced the anxiety of children/youth placed in substitute care
0 16 31 13 2.95 60
Reduced aggressive behavior by children/youth placed in substitute care
0 20 30 10 2.83 60
Other 1a 0 0 0 4 4.00 4
Other 2b 0 0 1 3 3.75 4
Note. The means are calculated with low = 1, rarely = 2, sometimes = 3, and often = 4.
aResponses included in “Other 1” category were: increased informed safety networks playing active roles in
keeping the child(ren) safe, maintained the connection to kin of children/youth placed in substitute care, created cohesion, and no children in care in 2014.
bBenefits included in “Other 2” category were: improved safety plans/goals to be behaviorally specific, built
natural supports, and increased the sharing of resources among the involved service organizations.
Two top rated benefits related directly to developing a system of care: engaging children and families in planning and increasing coordination among service
providers. These collaborative efforts were likely supported by three other frequent benefits: CFTs increasing the understanding of family members as well as involved professionals about a condition or functional difficulty and CFTs increasing sharing of resources among involved service organizations.
CCPTs identified other permanency benefits to a lesser extent. These were reducing time from entry into care to return home and making resources available for youth transitioning into adulthood.
A group of benefits which tended to occur sometimes related to service delivery. These were increasing service completion or quality of provided services and reducing time to service referral or time from referral to service enrollment.
Finally, the benefits which had the lowest number of responses and lowest means concerned CFTs mitigating the impact on children/youth of placement in substitute care. These benefits related to CFTs reducing the anxiety of the children and youth and their aggressive behavior.
In summary, the CCPTs identified that CFTs engaged families in planning on an informed basis and that CFTs expedited and coordinated service delivery. In addition, CCPTs expressed their views about the impact of CFTs on children and youth. On the basis of their experience, they indicated that CFTs sometimes keep foster children and youth’s connected to their families and schools. These viewpoints need to be tested by longitudinal research. Nevertheless, the CCPTs’ perceptions are supported by research in other parts of the country that engaging families in planning meetings expedites children’s return to their parents or placement with relatives (Washington, DC—Pennell et al., 2010; Texas—Wang et al., 2012).
CFTs Primarily Facilitated by Social Services and Secondarily by Mental or Behavioral Health
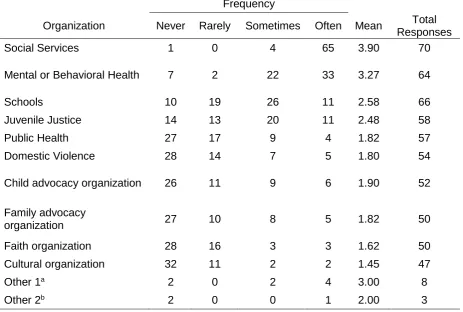
The survey then inquired about the frequency with which different groups facilitated and attended child and family team (CFT) meetings. These were for CFT meetings convened for children, youth, or their parents or caregivers served by public child welfare and requiring access to MH/SA/DD services. For CFT meeting facilitators, 10 organizations were listed with space to write in two others.
Table 9
Frequency of Organizations’ Facilitating CFT Meetings for Children/Youth and/or Parents/Caregivers Served by Public Child Welfare and Requiring Access to MH/SA/DD Services
Frequency
Organization Never Rarely Sometimes Often Mean Total
Responses
Social Services 1 0 4 65 3.90 70
Mental or Behavioral Health 7 2 22 33 3.27 64
Schools 10 19 26 11 2.58 66
Juvenile Justice 14 13 20 11 2.48 58
Public Health 27 17 9 4 1.82 57
Domestic Violence 28 14 7 5 1.80 54
Child advocacy organization 26 11 9 6 1.90 52
Family advocacy
organization 27 10 8 5 1.82 50
Faith organization 28 16 3 3 1.62 50
Cultural organization 32 11 2 2 1.45 47
Other 1a 2 0 2 4 3.00 8
Other 2b 2 0 0 1 2.00 3
Note. The means are calculated with low = 1, rarely = 2, sometimes = 3, and often = 4.
aOrganizations included in “Other 1” category were: law enforcement, mediation center, LME/MCO, Guardian ad
Litem program, Families First, and Access Care.
bOrganizations included in “Other 2” category were: IDD and Substitute Care.
In summary, child welfare cases requiring access to (MH/SA/DD) services were most often facilitated by Social Services and secondarily by Mental or Behavioral Health. Further analysis found that all nine LME-MCOs had member counties in which
Mental or Behavioral Health facilitated sometimes or often. The mean percentage for all the LME-MCO combined was 86% for at least sometimes, with data available for 64 of the 71 responding CCPTs. Per LME-MCO, the percentage of member counties with Mental or Behavioral Health facilitating at least some of the time ranged from 60% to 100%.
CFT Attendance Varied Among Family Members and Among Involved Organizations
CCPTs were asked about the frequency with which family members and
Litem, fathers, children/youth, and Mental or Behavioral Health, all of whose average attendance fell between sometimes and often. Groups whose average attendance was around sometimes, included friends, Schools, family/youth partners, and
Juvenile Justice. The remaining organizations were in attendance on average closer to rarely.
Table 10
Frequency of Attendance by Family Members and Organizations to CFT Meetings for Children/Youth and/or Parents/Caregivers Served by Public Child Welfare and Requiring MH/SA/DD Services
Frequency
People/Organizations Never Rarely Sometimes Often Mean Total Responses
Children/youth 1 5 23 39 3.47 68
Mothers 1 0 3 66 3.91 70
Fathers 1 3 21 44 3.57 69
Other family 1 1 22 45 3.61 69
Friends 2 6 38 23 3.19 69
Family/youth partners 8 7 23 22 2.98 60
Guardian ad Litem 1 3 21 46 3.58 71
Social Services 1 0 1 68 3.94 70
Mental or Behavioral Health 2 4 27 37 3.41 70
Schools 1 14 36 17 3.01 68
Juvenile Justice 6 14 31 16 2.85 67
Public Health 17 17 4 4 2.28 65
Domestic Violence 12 24 25 5 2.35 66
Child advocacy organization 14 18 18 4 2.22 54
Family advocacy
organization 15 20 11 5 2.12 51
Faith organization 10 27 18 2 2.21 57
Cultural organization 20 25 4 0 1.67 49
Other 1a 1 0 3 3 3.14 7
Other 2b 1 0 2 2 3.00 5
Note. The means are calculated with low = 1, rarely = 2, sometimes = 3, and often = 4.
aOrganizations included in “Other 1” category were: LME/MCO, attorneys, law enforcement, Access Care, and
private child placement providers.
bOrganizations included in “Other 2” category were: law enforcement, hospital Social Worker, Substitute Care,
and licensed foster families.
In summary, for CFTs pertaining to MH/SA/DD service access, the most frequent family attendees were mothers with other family members, including the
agencies represented the most frequently at the CFTs were Guardian ad Litem and Mental or Behavioral Health. Family and youth partners sometimes attended. Further analysis determined that all nine LME-MCOs had member counties in which Mental or Behavioral Health attended sometimes or often. The mean percentage for all the LME-MCO combined was 91%, with data available for 70 of the 71 responding CCPTs. Per LME-MCO, the percentage of member counties with Mental or
Behavioral Health facilitating at least some of the time ranged from 70% to 100%. The impact of who is present and absent from meetings needs more study. A Cumberland County study matched school and child welfare data from 347 CFTs. The data analysis found that students were less likely to change placements if they were present at their CFT meeting and if a school official was present (Pennell & Rikard, 2013).
Family-level Strategies for Improving CFTs Prevalent but System-level Strategies Unevenly Applied
Moving to ways of improving CFTs, the survey asked the CCPTs about system-level and family-level strategies that their counties had used in 2014. These strategies were employed with CFTs held for children, youth, and their parents or caregivers who were served by child welfare and required MH/SA/DD services. A list provided 12 strategies with space to write in 2 other strategies.
Table 11
Use of System-Level Strategies for Improving CFT Meetings for Children/Youth and/or Parents/Caregivers Served by Public Child Welfare and Requiring Access to MH/SA/DD Services
Use
Strategies Yes No Total
Responses
Making Mental Health and Social Services aware of each
other’s requirements for CFT meetings 59 8 67
Having clear procedures for making referrals to CFT meetings 59 11 70
Sharing information packages for family and professionals on
CFT meetings 46 20 66
Using a tool to monitor delivery of CFT meetings 45 23 68
Having clear procedures for making self-referrals to CFT
meetings 42 23 65
Having CFT meetings facilitated jointly by Social Services and
Mental Health 38 29 67
Having an agreed-upon protocol for cross-system CFT meetings (e.g., who prepares families, who facilitates meetings, what information can be shared at meetings)
36 33 69
Seeking feedback from participants on how to improve CFT
meetings 35 30 65
Offering training to family members and/or resource families on
CFT meetings 22 43 65
Providing cross-system training on CFT meetings 19 44 63
Publicizing CFT meeting successes while maintaining family
confidentiality 14 51 65
Ensuring that mental health providers are reimbursed for
attending CFT meetings 5 62 67
Other 1a 3 0 3
Other 2b 2 0 2
aStrategies included in “Other 1” category were: strength-based/family-centered strategies, having neutral
meeting sites, cross-training Prevention Staff to facilitate CFTs, and utilizing the Signs of Safety mapping process during meetings.
bStrategies included in “Other 2” category were: using a vehicle for TICCA recommendations (PFE) and utilizing
electronic white boards to record mapping/safety plans and providing participants copies.
agreed that they facilitated CFTs in which everyone felt that they could give input, felt respected, and developed a clear and agreed-upon plan. Although still quite
prevalent, fewer counties prepared professionals for the meetings, asked children or youth how they wanted to participate in the meetings, or set a time to reconvene CFTs.
Table 12
Use of Family-Level Strategies for Improving CFT Meetings for Children/Youth and/or Parents/Caregivers Served by Public Child Welfare and Requiring Access to MH/SA/DD Services
Use
Strategies Yes No Unsure Total
Responses
Facilitating CFT meetings in which everyone feels
they can give input 69 0 1 70
Facilitating CFT meetings in which everyone feels
respected 68 0 2 70
Developing a clear and agreed-upon CFT plan 68 1 1 70
Developing with families a clear purpose for
convening CFT meetings 67 1 2 70
Explaining to families the CFT meeting process 67 1 2 70
Providing necessary information to support
decision-making at CFT meetings 66 2 2 70
Encouraging families to select a support person for
CFT meetings 66 0 4 70
Assessing the safety of CFT meeting participants and
putting in place necessary safety measures 65 1 4 70
Making arrangements so families can attend CFT meetings (e.g., babysitting, transportation, time scheduling)
65 1 4 70
Asking families who they want at their CFT meeting 65 1 3 69
Setting ground rules with families for holding
emotionally and physically safe CFT meetings 65 2 3 70
Monitoring and evaluating progress on implementing
CFT plans 65 4 1 70
Setting a time to reconvene and revise CFT plans as
needed 63 3 3 69
Asking children/youth how they want to participate in
Preparing professionals for CFT meetings 60 4 6 70
Other 1a 7 0 2 9
Other 2b 3 1 2 6
aStrategies included in “Other 1” category were: obtaining state funding to implement aforementioned strategies,
being flexible with meeting locations to accommodate families, using a neutral facilitator, providing brochures to families, and encouraging families, professionals, and social supports to continue communicating after CFT meeting and to request follow-up meetings.
bStrategy included in “Other 2” category was: utilizing electronic white board to record plan as it is being
developed and providing copies to participants.
In summary, counties across the board used family-level strategies to improve CFT meetings, but more counties could attend to preparing professionals, encouraging the participation of children and youth, and scheduling follow-up CFTs. The county’s use of system-level strategies was quite uneven. Setting procedures and sharing information were common among the counties. Reimbursing Mental Health providers, however, stood out as an area for work in most counties.
At the conclusion of the survey, CCPTs had space to write in the main challenges faced in their counties to holding CFT meetings and their recommended strategies for overcoming these challenges. And most took this opportunity to record their views, 67 on challenges and 59 on recommendations. Their responses on challenges and recommendations are summarized respectively in Table A6 and Table A7. The most frequently cited challenges concerned scheduling meetings at times that worked for families and professionals, ensuring transportation and meeting sites for families, and involving Mental Health professionals. The
recommendations emphasized increasing collaboration among partners, providing outreach and education to professionals and families, and seeking more financial assistance including to reimburse Mental Health providers.
Advisory Board Recommendations
References
Pennell, J., Edwards, M., & Burford, G. (2010). Expedited family group engagement and child permanency. Children and Youth Services Review, 32, 1012-1019. doi: 10.1016/j.childyouth.2010.03.029
Pennell, J., & Rikard, R. V. (2013, June). Fostering Youth Educational Success: Final evaluation report. Grant Number 90CO1075/01, US Department of Health and Human Services, Administration for Child and Families, Children’s Bureau. Retrieved from
http://cfface.chass.ncsu.edu/documents/Fostering_YES_Final_Report_June_2013_e dited_v3.pdf
Appendices
Appendix A
Table A1
Counties Covered in Survey Report
Participating Counties
Alamance Cumberland Johnston Richmond
Alleghany Currituck Jones Robeson
Avery Dare Lenoir Rockingham
Beaufort Davidson Lincoln Rowan
Bertie Davie Macon Rutherford
Bladen Duplin Madison Sampson
Brunswick Edgecombe Martin Stanly
Buncombe Franklin Mitchell Stokes
Burke Gates Montgomery Swain
Cabarrus Guilford Nash Vance
Camden Halifax New Hanover Warren
Caswell Harnett Onslow Watauga
Catawba Henderson Orange Wayne
Chatham Hertford Pasquotank Wilkes
Chowan Hoke Pender Wilson
Clay Hyde Person Yadkin
Columbus Iredell Polk Yancey
Table A2
LME-MCOs and Number of Member Countiesa Responding to Survey
LME-MCO Number of
Member Counties
Total Responding
Counties
Percent
Alliance Behavioral Healthcare 4 2 50%
Cardinal Innovations
Healthcare Solutions 16 13 81%
CenterPoint Human Services 4 3 75%
CoastalCare 5 4 80%
East Carolina Behavioral
Health 19 13 68%
Eastpointe 12 10 83%
Partners Behavioral Health
Management 8 5 63%
Sandhills Center 9 6 67%
Smoky Mountain Center 23 15 65%
Total
Numbers 9 100 71
aMember counties affiliated with a Local Management Entity (LME)-Managed Care Organization (MCO), as of
April 1, 2014
Table A3
Organization of CCPTs and Child Fatality Prevention Teams (CFPTs) in Counties
CCPT/CFPT Organization Number of Counties Percent
Separate CCPT and CFPT 18 25.35%
Combined CCPT and CFPT 53 74.65%
Table A4
Existence of Systems for Tracking Child and Family Team (CFT) Meetings Held for Children/Youth and Families at Local Social Services
Existence of Tracking Systems Frequency Percent
Have a system in place 39 54.93%
Have a system in development 6 8.45%
Do not have a system 25 35.21%
Unsure 1 1.41%
Table A5
Willingness to Ask Local Social Services to Share CFT Tracking Systems
Willingness Frequency Percent
Yes 35 89.74%
No 4 10.26%
Table A6
Greatest Challenges Identified by Survey Participants in Holding Helpful CFT Meetings for Children/Youth and/or Parents/Caregivers Served by Public Child Welfare and Requiring Access to MH/SA/DD Services
Challenge Frequency of
Response
Scheduling, availability, or meeting time issues for families and
professionals 31
Transportation or meeting location issues for families 23
Difficulty engaging/lack of participation by familiesa 15
Difficulty engaging/lack of participation by mental health professionalsb 7
Difficulty engaging/lack of participation by other professional or community
partners 8
Difficulty engaging/lack of participation by youth 2
Unwillingness of families to engage natural supports in meetings 5
Lack of effective or appropriate meeting facilitators 8
Lack of resourcesc 5
Communication and coordination issuesd 4
Lack of effective or appropriate CFT traininge 3
aEspecially prominent when parents have mental health or substance abuse issues
bThis often occurs because mental health professionals cannot be reimbursed for meeting attendance
cE.g., resources for non-English speakers or sex offenders
dThis includes cross-cultural communication
eE.g., SOC training for non-mental health professionals, lack of case management model within behavioral health
systems
Table A7
Strategies Recommended by Survey Participants in Overcoming Challenges to Holding Helpful CFT Meetings
Strategy Frequency of
Response
Seek more financial assistance a 10
Increase collaboration and communication among partners b 13
Increase outreach/education on CFTs for professionalsc 11
Increase outreach/education on CFTs for familiesd 10
Increase outreach/education on CFTs for other community partners 5
Increase youth engagement 2
Allow family and/or professional partners to participate in meetings by
phone if they cannot attend in person 9
Provide transportation assistance to families 7
Prioritize family needs regarding meeting times and locations 5
Get trained meeting facilitators 5
Send out meeting reminders to family and professional partners 4
Establish more thorough protocols for ensuring CFTs operate effectively 3
Increase cultural and/or foster resources 2
Solicit feedback about effectiveness of CFTs and meetings 2
aE.g., reimbursing mental health professionals for meeting attendance, securing more state and local funding
bE.g., schedule CFT meetings further in advance to allow partners to make arrangements in order to attend,
introduce the concept of CFTs to partners earlier
cThis includes trainings on specific needs and scenarios
Appendix B
2014 Survey
North Carolina Community Child Protection Team Advisory Board
As the NC Community Child Protection Team Advisory Board, we are asking that all Community Child Protection Teams (CCPTs) in North Carolina complete this survey. We are responsible for conducting an annual survey of local CCPTs and preparing a report to the North Carolina Division of Social Services (NCDSS). In the annual report, we summarize the information provided by the local CCPTs without
identifying what individual teams said, and we make recommendations on how to improve public child welfare. Then NCDSS write a response to our report. Both our report and the NCDSS response are included in the state’s Annual Progress and Services Report to the US Department of Health and Human Services,
Administration for Children and Families.
This report is one of the requirements in the federal Child Abuse Prevention and Treatment Act (CAPTA). In 1997 North Carolina designated the Community Child Protection Team as its Citizen Review Panel with responsibility for this report. The purpose of Citizen Review panels is to provide opportunities for citizens to play an integral role in ensuring that states are meeting their goals of protecting children from maltreatment.
This survey assists you in preparing your annual reports to your county
commissioners and to the NC Division of Social Services. You can choose whether to complete the survey and can decide which questions to answer. The one
exception is that you will be asked to provide the name of your county and reservation. This makes it possible to track who completed the survey and to acknowledge the name of your county or reservation in the annual report.
The survey responses are transmitted directly to the researcher, Dr. Joan Pennell, at North Carolina State University. This means that your responses are NOT
transmitted to the NC Division of Social Services or to the NC CCPT Advisory Board. Dr. Pennell will respect the confidentiality of local CCPTs and will NOT link individual responses to local CCPTs. The one exception is that Dr. Pennell will provide the names of the county or reservation that submitted a survey to the NC CPPT Advisory Board. De-identified findings may also be included in presentations, trainings, and publications.
At our September 18, 2014 meeting, the NC CCPT Advisory Board decided to focus this year and next year on one issue: access to mental health services of children, youth, and their families served by public child welfare. We decided on this focus because in past surveys we have found that barriers to mental health care stand out as a major concern across the state. We also know that high percentages of children and youth in foster care have a behavioral health diagnosis.