Small wins:
A strategy for developing evidence for a student learning assistance program (LAP) unit through
formative evaluation Fernando F. Padró & Lindy Kimmins
University of Southern Queensland
Abstract
This paper discusses the strategy a learning assistance program (LAP) based on peer learning is following to create an evidence-based decision-making environment and quality assurance process. Often, the emphasis is in creating a useful database and integrating it to other existing databases in order to focus on summative decisions about a program’s or unit’s success, merit or worth; however, what happens if the database is being systematized for the first time from what are existing disparate and informal sources of data? More to the point, what happens to the ability to navigate the program through continuous improvement? Presented is a formative evaluation strategy based on Weick’s (1984) notion of ‘small wins’ that allows data-driven continuous improvement monitoring process to help determine program efforts and that, in the longer term once the database is completed, can lead to an additional source of summative evaluation data.
Introduction
The University of Southern Queensland’ (USQ) Learning and Teaching Support Unit (LTS) is in the process of systematically collecting data that has been gathered over a period of as much as 20 years on a piecemeal basis and heretofore not used for evidence-based decision-making or measuring performance excellence. One of the reasons for collecting data are the institutional desire to become more accountable to itself and stakeholders (employers, parents, students, TEQSA) regarding program impact (engagement, learning and satisfaction) and justification of resource allocations. Student facing programs such as USQ’s Learning Centre and Meet Up Program are under pressure to employ assessment strategies that ‘provide more hard data, linked more closely to institutional goals, that support claims of success’ (Schuh, 2009b, p. 232).
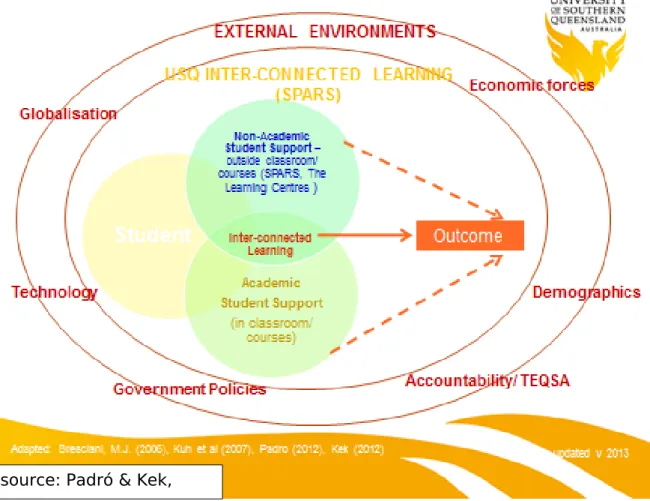
persistence, and success’ (p. 326). Figure 1 illustrates the presence of complementarity between performance measurement and program evaluation (cf. Hatry, 2013). Specifically, it focuses on identifying the interconnections of the different student facing programs supporting the student experience on campus from a meta-level perspective which includes formative and summative evaluation issues although from a student development rather than only a merely transactional customer service focus (Padró & Kek, 2013, Padró & Frederiks, 2013).
Figure 1. Meta-level evaluation setting of USQ’s SPARS project guiding unit review processes
The purpose of this paper is to discuss the strategy being utilized in the
Meet Up Project as it begins its transition to an evidenced-based program. While there are similarities with what is happening with the Learning Centre, the focus of attention with that program is in the building of the database – which is almost complete – and establishing the interconnections to move from what Terenzini (2013) calls Type 1 issues (data without information, analysis without problems, answers without questions) to Type 2 issues intelligence, data to generate decisions based on institutional issues and how the program is impacted by these concerns. With Meet Up, the focus of efforts is developing a strategy of at least commencing a continuous improvement approach toward looking at the program’s effectiveness. The perspective taken is similar to Voorhees and Hind’s
availability and the form it is in and then establishing those processes essential to successfully implementing and maintaining useful assessment and analysis activities that will yield a more comprehensive view of Meet Up’s impact. Programs such as Meet Up are not only active, but have been so for a long time and is part of the larger system and implemented through different organizational environments (Pawson, Wong, & Owen, 2011; Pawson, 2006) that are now reforming as SPARS. Pawson, Wong and Owen (2011) consider evidence as a never-ending of network of conditionalities and contingencies and the strategy to use formative data in parallel to the formation of a database provides a bridge with summative assessment and evaluation and a link between the discussion of improvement and accountability (Bresciani, 2006).
Background
All programs and units at universities have to demonstrate their contribution to student engagement, learning and satisfaction if they want to continue to be funded at the levels they are accustomed to or even be funded at all. Quality engagement, learning and satisfaction mean a demonstration that student effort devoted to educationally purposeful activities contributing to achieving desired outcomes (Hu & Kuh, 2002), the presence of constructive alignment to learn desired outcomes in a reasonably effective manner (Biggs, 1999; Shuell, 1986) and the ability to link student learning to their satisfaction of the experience received (cf. Ramsden, 1991). It is all about providing evidence that the university makes a positive impact on what the student achieves in terms of learning.
Internal and external quality assurance looks for two things that are not necessarily always compatible: performance excellence (accountability) and continuous improvement. Performance excellence provides the dimension of determining whether the program continues as is, gets more resources it gets cut or eliminated. Because of the implication of decisions that are based on performance, the evaluative nature is summative in nature, i.e., the big picture predicated on quality, productivity, defects and costs related to providing the program, measuring the effects on and the value to the evaluand (Stake, 2004; Scriven, 1993). Continuous improvement focuses on formative evaluation practices (Fitzpatrick, Sanders, & Worthen, 2004), to monitor how programs are progressing based on assessing the implementation of plans through interim results (Stufflebeam & Shinkfield, 2007). Where they can conflict is in the realm of risk tolerance by a university in publicizing less than stellar results as a result of changes made and implemented. This defensive action is partially the result of how evaluation responds to stakeholders with a greater degree of power (Azzam, 2010) and acceptance of the power schema (Padró, 2013a; Pawson, 2006).
experience. This has proven to be controversial as well as difficult to do in higher education, particularly when wanting to use student survey data (Coates, 2009; Banta & Pike, 2007). ‘The debate over value added as a tenable analytical strategy for colleges and universities is not about the integrity of the concept but rather about technical and logistical issues inherent in its implementation and interpretation’ (Fulcher & Willse, 2007 , p. 12). Coates (2009), thus argues for the importance of capturing the value-added component to program, unit and university impact. He proposes four approaches to generating data, two of which have already been tried and found wanting (Banta & Pike, 2007): comparing expected to actual performance, assessing change in performance across years. His argument in supporting these approaches revolves around improving methodology and understanding of outcomes. In addition, Coates (2009) promotes two other measures: measuring student engagement and recording employer satisfaction as part of his value-added model. Measuring student engagement provides both a formative and summative component to data analysis while employer satisfaction (considered good practice by external review agencies in general) is by design a summative measure with a separate set of concerns regarding what the purpose of the university, a different discussion for another time and place.
Looking at the three deliverables that the current quality assurance model wants out of universities down to the program and unit levels – accountability in performance, improvement and enhancing value – forces programs and units to become evidence-based, even when historically these have not been. This is especially the case for programs and units that are not under the academic umbrella but are student facing in terms of different types of support. Per force this requires the creation and implementation of a strategy to pursue. And for programs and units who are transitioning into an evidence-based evaluation environment, it may be helpful to pursue Weick’s (1984) ‘small wins’ philosophy which is formative in nature:
Small wins provide information that facilitates learning and adaptation. Small wins are like miniature experiments that test implicit theories about resistance and opportunity and uncover both resources and barriers that were invisible before the situation was stirred up. (p. 44)
‘Small win’ strategy
There are two other reasons for pursuing ‘small wins’. The first reason is shifting the emphasis of the definition of quality assurance from a demonstration for those who are not directly involved that all is well (Padró, 2013b) to ‘an effort to monitor and correct ordinary operations so that a high level of effectiveness is attained and maintained’ (Stake, 2004, p. 186). This last point is closer to the process of quality control as defined by Juran & Godfrey (1999, cited in Padró, 2013b); however, the shift is consistent with the embedding of a risk management framework (identifying factors, events precipitating these factors and consequences from action or inaction) and emphasizing continuous improvement.
The second reason for using a ‘small wins’ strategy is the understanding that the rationale for LAPs is to assist students achieve their academic goals, meet instructor and program expectations regarding graduation and successfully undertake examinations (CAS, 2012) and that these inherently represent areas of risk based on the results of student performance – ergo one of the bases behind the term ‘at-risk’. The consequences of students leaving a university before graduation represent negative individual, institutional and societal impacts. Tinto (1993) writes about the problem of an incongruence (mismatch or lack of fit) between abilities, skills, interests, needs and preferences that a student has in relation to what the university has to offer in terms of academic programs, learning support and the campus environment that allows the student to feel as if s/he fit and are encouraged to engage. Risk comes in the form of obstacles that prevent students form learning by not allowing what Astin (1985) referred to as the capacity for the expending physical and psychological energy that can be devoted to the academic learning experience.
Risk management is no longer simply the realm of emergency management, workplace safety or financial audits. The new model of risk management, called Enterprise or Strategic Risk Management (ERM), is a structured approach aligning strategy, processes, people, technology and knowledge to evaluate and manage uncertainty and create value (KPMG, 2001). It is about managing risk rather than eliminating it, thus it is somewhat based on a ‘what if’ modelling where unit members contribute their knowledge and understanding of operations and processes to identify and weigh risks, determine controls required, prioritize the need for control and formulate a plan of action (Bubka & Coderre, 2010).
based on the COSO Framework based upon a reading of its focus, although its predecessor AUQA seems to have been informed by ISO 31000 (Brett & Winchester, 2011). And as a result, embedding a risk matrix within a university’s quality assurance process will have to balance the need for compliance and control alongside continuous improvements and performance reporting, hence generating a stronger link between assurance reporting and program control via feedback loops.
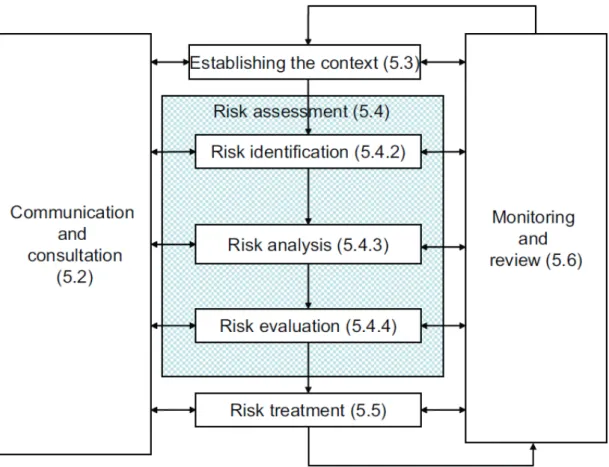
From a practical perspective, what’s useful in the COSO Framework is the demonstration of the relationship between operations, reporting and compliance and how information and communication (assurance type activities) and monitoring (quality control type activities) play out from the program level on up to the institutional level (Figure 2). The ISO 31000 framework also takes into consideration the communication and consultation along with monitoring (Figure 3), but in this case communication and consultation is about establishing context of operations for program and units in relationship to potential challenges and the responses that can be achieved while monitoring is about assurance, improvement and identifying new potential challenges/problems/risks (ISO, 2009).
source: COSO, 2013, p. 6.
Figure 2. COSO ERM Framework cube
source: ISO, 2009, p. 14.
source: ISO, 2009, p. 9.
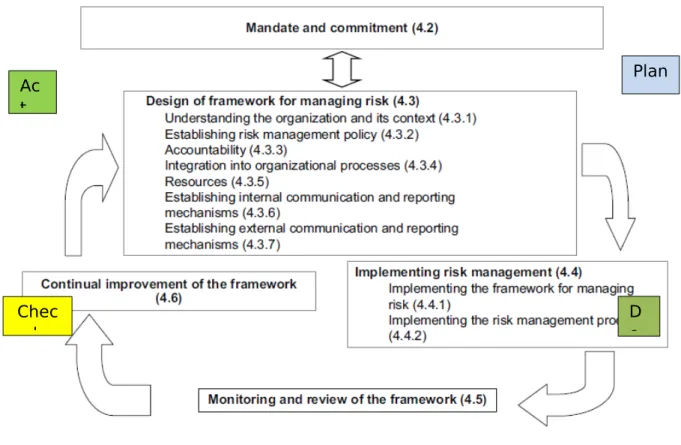
Figure 4. Relationship between of the framework for managing risk: ISO 31000
(KRIs). KPIs are historical in nature; meanwhile, KRIs can be the relationships that locate emerging risks and opportunities: ‘The differences between KPIs and KRIs are that KPIs tell us if we will achieve our goals, and KRIs help us understand changes in risk profile, impact and likelihood to achieve our goals’ (Scarlat, Chirita, & Bradea, 2012, p. 7).
The key point is where to begin. It is easier when implementing a new program or reconfiguring an overarching structure based on new programs because all aspects of the quality assurance, qualifications and risk management frameworks can be put in place from the beginning. Even if the university does not have a risk management framework or a fully integrated quality assurance structure in place, starting tabula rasa means putting all things together to evaluate the program as a form of new intervention as Pawson (2006) would suggest. When it is an existing, ongoing program, starting afresh is a luxury not typically available for staff and administrators. Choices have to be made based on existing internal priorities, processes and information resources (databases and other sources of information). Consistent with Weick’s (1984) views, this
Plan
D o Ac
t
decision-making exercise onto itself becomes the beginning of the small wins needed to generate the desired larger picture.
A first point is to embed an ERM component to a program’s the existing assessment and evaluation structure rather than adding it as an extraneous variable that merely adds to the reporting burden. The question is where to place ERM (see Figure 5). Stufflebeam’s context, inputs, processes and products (CIPP) evaluation framework (Stufflebeam & Shinkfield, 2007) helps with
Evaluation Roles
Context Input Process Product
Formative evaluation: Prospective application of CIPP information to assist decision making and quality assurance Guidance for identifying needed interventions and choosing and ranking goals (based on assessing needs, problems, assets, and opportunities). Guidance for choosing a program or other strategy (based on assessing alternative strategies and resource allocation plans), also for examining the work plan
Guidance for implementing the operational plan (based on monitoring and judging program activities) Guidance for continuing, modifying, adopting, or terminating the effort (based on assessing outcomes and side effects) Summative evaluation: retrospective use of CIPP information to sum up the program’s merit, worth, probity, and significance Comparison of goals and priorities to assessed needs, problems, assets, and opportunities Comparison of the program’s strategy, design, and budget to those of critical competitors and the targeted needs of beneficiaries Full description of the actual process and costs, plus comparison of the designed and actual processes and costs Comparison of outcomes and side effects to targeted needs and, as feasible, to results of competitive programs; interpretation of results against the efforts assessed context, input, and processes 1source: adapted from Stufflebeam & Shinkfield, 2007, p. 329.
Figure 5. Stufflebeam’s CIPP evaluation types and how these relate to continuous improvement, performance documentation, program quality control and program ERM activities
Identify where ERM fits within evaluation activities. CIPP avoids an exclusive keying on purely technical issues, a potential fatal flaw in evaluations (Campbell & Stanley, 1963 as cited in Stufflebeam & Shinkfield, 2007) by emphasizing the different aspects of program and institutional level evaluation activities. As can be seen in Figure 5, there is a potential for needless duplication and the point is to use ERM in a complementary manner.
A second early point in the process of determining how to embed ERM is to take the perspective suggested by the survey undertaken by the USA’s Association of Governing Boards and United Educators indicating that a majority of universities report they do not identify major risks through a comprehensive, strategic risk assessment and, if it happens, it happens on an as-needed basis (Association of Governing Boards [AGB], 2009). The reason for this assumption is that unless there is a clearly stated and linked strategic ERM process at the institutional level outside the financial audit and governance arenas, there is a good chance that units and programs will have to rely on strategic plans and external review criteria or standards as a means to begin to reframe the outcomes for assessments and evaluation processes through identification of risk possibilities, potential consequences (negative and positive) and possible actions.
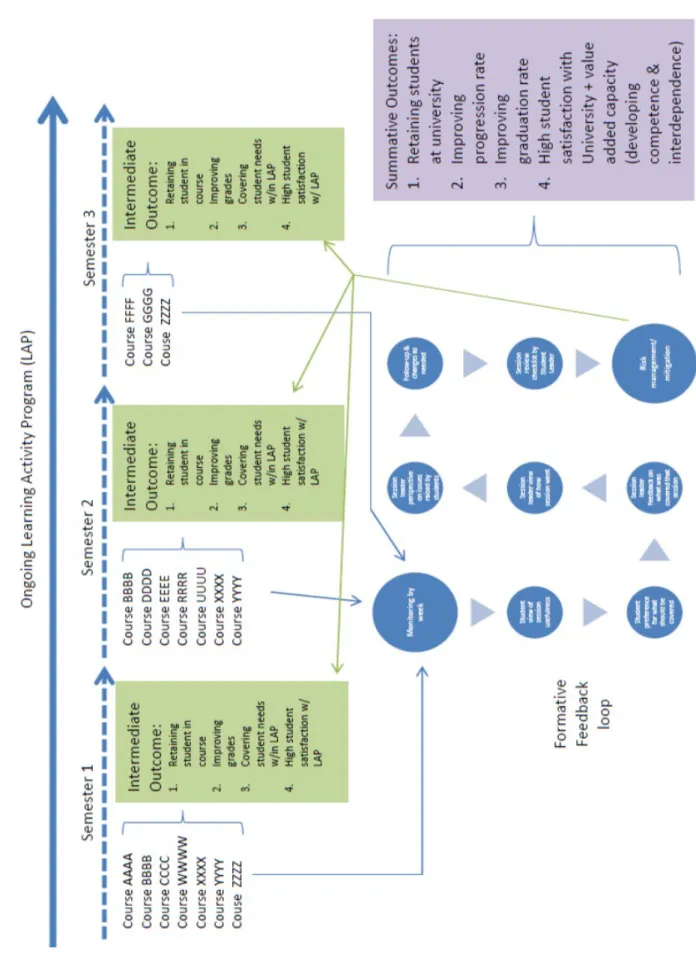
Figure 6 represents how the assumption of not having an institutional ERM impacts unit and program level evaluation schemes based on the reality that initial guidance will come from external sources such as TEQSA (from the Threshold Standards, Regulatory Risk Framework [RRF]) and the Australian Qualifications Framework (AQF). For LAPs such as Meet Up, it is interesting to immediately note that the RRF within the context of Responsibilities to Students has four of nine risk factors that directly applies to it, thus suggesting the need to look at outcomes and performance indicators documenting outcomes also from the perspective of risk regarding overall program success as well as internal continuous improvement given the potential impact implications. Specifically, attrition (F4) and satisfaction (F7) are rated as ‘major’ in the consequence indicator. Formal and informal learning assistance have historically been essential to student success and retention, especially as the ‘open university’ movement expanded because, otherwise, there would be a revolving rather than open door (CAS, 2012). As a result, it makes sense to look at LAPs such as Meet Up to make the issues of retention, progression and satisfaction short-term and intermediate outcomes.
Program Quality Control
COSO Cube Framework
(2004)
ISO 31000
(2009) EvaluatioCIPP n Type (Stuffleb eam & Shinkfiel d, 2007) TEQSA Regulatory Risk Framewor k (RRF, 2012) TEQSA Threshol d Standard s (selection based on Padró & Frederiks , 2013) Australian Qualificati ons Framewor k (AQF, 2013) Internal environment Objective setting Communicat ion & Consultation Establishing Context Context evaluation (goals) Input evaluation (plans) Responsibili ties to students (p. 15)
PRS 6.5 The higher education provider identifies and adequately meets the varying learning needs of all its students, including: the provision of orientation courses and transition support; and, ongoing academic language and learning support. PCS 2.7 The higher education provider offers an extensive range of student services, including student academic and learning support, and extensive resources for student learning in all disciplines offered. PRS 7.3 The higher education provider ensures that all students, regardless of mode of E.g., Level 7: Bachelor Degree criteria (p. 47) Knowledge Graduates at this level will have broad and coherent theoretical and technical knowledge with depth in one or more disciplines or areas of practice Skills Graduates at this level will have well-developed cognitive, technical and communicatio n skills to select and apply methods and technologies to:
study, have access to one or more contact people who can respond to queries in a timely manner and has effective arrangement s to actively maintain contact with and support students who are remote from or away from its locations. skills and ideas to others Application of knowledge and skills Graduates at this level will apply
knowledge and skills to demonstrate autonomy, well-developed judgement and responsibility: • in contexts that require self-directed work and learning • within broad parameters to provide specialist advice and functions Event identificatio n Risk assessment Risk assessment Risk identification Risk analysis Risk evaluation Input evaluation (plans) Process evaluation (action) Product evaluation (outcomes )
F1 High / volatile international student population F2 Academic/ market risk: Declining academic admission standard/lack of academic requirements in admissions policy* F3 Significantly high student growth overall F4 Academic risk: Very high or rapidly increasing student attrition rates F5 Academic risk: Very low / very high or rapidly changing student progress
PCAS 4.4 The higher education provider has effective mechanisms to identify and support students who are at risk of not
F6 Academic risk: Very low or rapidly declining unit satisfaction levels F7 Academic risk: Very low or rapidly declining graduate course satisfaction F8 Outcome risk: Very low or rapidly declining graduate employment or further study F9 Significant number of serious, substantiated student complaints Risk response Control activities Risk
treatment Process evaluation (actions) Product evaluation (outcomes ) Information & Communicat ion Monitoring Monitoring & Review Context evaluation (goals) Input evaluation (plans) Process evaluation (actions) Product evaluation (outcomes )
Figure 6. Mapping of external standards generating context within a risk framework setting.
The next step is identifying existing decision-making matrices, monitoring and evaluation processes, assessment instruments, databases and other available information that could qualify as Tier 1 data (cf. Terenzini, 2013) that form the foundation for existing decision-making program review activities. When all of these are available, then embedding ERM will be a simpler process because it becomes part of the redefined decision-making loop because KPIs are then used as the foundations for KRIs and together these then enhance the decision-making loop. Because of the attention KRIs present in terms of process controls, then it becomes a logical extension to use them as part of performance assessment and continuous improvement. When the data gathering and supporting mechanism is incomplete and not well-defined, an inventory of what is available has to be done followed by a plan of action to identify what is available, what is doable and next steps to develop a more mature decision-making and performance review scheme. Then is the time to determine how ERM can be established and embedded.
Meet Up Project
Meet-Up is a learning assistance program (LAP) based on peer learning and collaborative learning. An iteration of the program has been running at the University of Southern Queensland for eighteen years. In 1995, student led sessions under the banner of Supplemental Instruction were begun as a pilot project in a nursing course which had a high fail rate. Supplemental Instruction had its genesis in the 1970’s at the University of Missouri, Kansas City under the innovative Deanna Martin who perceived a need for student-to-student interaction at college. The pilot at USQ was deemed a success. Students who attended all or most of the Supplemental Instruction sessions received higher grades than those who did not attend. The author of the report on the pilot concluded: ‘the program was well attended and was appreciated by the students who participated. … Supplemental Instruction can play a major part in assisting students in units at academic risk. We should now look to extending the programme to other internal units and also to trial it in external teaching mode’ (Anderson 1995).
Supplemental Instruction was indeed then rolled out into a number of other units at USQ in the following years and enjoyed similar results. By 1998, staff involved decided it was important to diverge from the restrictive and regulatory nature of Supplemental Instruction and adapt the student led program to suit USQ’s students and their needs. Research into peer learning was indicating that all students’ learning can benefit from interacting with their peers. (quote) And so the focus on running the LAP in only courses with a high fail rate was abandoned. Thus Peer-assisted Learning Strategy (PALS) was born. PALS, traditionally a face-to-face program, was expanded in 2005 to include online synchronous dialogue via MSN Messenger. USQ was one of the first universities to adapt its peer program for distance students via audiographic sessions and night on-campus classes. The audiographic sessions were hailed by students as a success as they provided that extra element of rapport and comfort that is difficult to achieve in lecturer or tutor/student situations, particularly as a distance student. As one student noted on her survey in 2006: ‘it’s good to talk to others who have the same questions and as an external student you miss out on asking the spontaneous little question’.
Students also appreciated the opportunity for contact with other students. When asked if they enjoyed the opportunity to interact with other students that MSN Messenger provided, one student responded ‘I did, It was my first MSN chat too so I was probably a little over excited! But, like I said, when you’re external, you sometimes feel like you’re the only one’. Students also believe peer sessions help improve their grades. ‘…I definitely got points I wouldn’t have otherwise received in my assignment’ (student, 2006).
their learning and understanding of the course content, course requirements and the various assessment items (lecturer, 2006).
The need to change USQ’s peer-led learning assistance program (LAP) was heralded in 2008 with an increased emphasis on distance learners and also as a result of requests from staff for other models of peer learning that saw sessions integrated with workshops and tutorials. PALS was morphed into Up. Meet-Up is offered online and on-campus. The student leaders work with lecturers to provide students with the opportunity to develop their academic learning skills and their disciplinary understanding in a structured, social learning environment. Leaders also offer study advice based on their own learning experience.
The program aims to provide academic assistance to students through the development of their academic learning skills and understanding of discipline concepts to enhance their academic performance and develop a sense of learning community. This assistance is provided in on-campus sessions and/or online environments in a structured, social learning environment by trained student leaders who facilitate activities, exercises, problems, or practice opportunities that have been planned in collaboration with lecturing staff. Leaders also offer study advice based on their own learning experience. The program also aims to contribute to the establishment of a body of student leaders at the University and assist with the development of student leadership skills.
Concepts underpinning Meet-Up
Collaborative learning
Chickering and Gamson (1987, 1991 cited in Pascarella & Terenzini, 2005) argue that student learning is enhanced when students work with and teach one another. Collaborative learning permits such learning to occur. Collaborative learning can be considered as an overarching term for learning approaches that involve students working together to achieve common goals such as understanding of course material (Smith & Macgregor, 1002 cited in Pascarella & Terenzini, 2005). more needed
Peer led sessions are based on collaborative learning techniques. All work is achieved in group settings with students feeding off the ideas, questions, and general input of their peers. Research has suggested that collaborative learning promotes the development of critical learning skills as a direct result of the active engagement involved in activities that rely on peer collaboration (Arendale, 1993). Collaborative learning is also credited with the improvement in students' self-esteem and their persistence (Arendale, 1993). The non-threatening informal environment is believed to build student confidence and with this comes increased academic success. Student leaders in the program are trained in the use of collaborative learning techniques.
The other theoretical approach on which peer programs such as Meet-Up are based is peer-assisted learning. This approach to learning is founded on the work of the Russian psychologist Vygotsky (Foot & Howe, 1998). Vygotsky took Piaget’s idea of the benefits of peer interaction one step further to suggest that learning was advanced even more if one of the interactants was more expert than the other so that he/she could guide, encourage and stimulate the learner (Foot & Howe, 1998). Peer leaders also tend to use more non-verbal demonstrations than lecturers, and they use the same language and share the same problems as the students (Rogoff, 1990, cited in Topping & Ehly, 1998). Other advantages for the student include immediate feedback, lower anxiety levels, and greater ownership of the learning processes (Topping & Ehly, 1998). Research by Greenwood (1995, cited in Maheady, 1998) found that peer-assisted learning had at least seven definite advantages over more traditional methods. One of these was increased motivation which is a crucial element in university learning today where students are succumbing to many other contemporary pressures.
Beer & Jones (2008, p. 67) list some advantages, from a student perspective, of being part of an effective learning network: additional assistance with challenges, especially from peers; more perspectives on problems; access to expertise; more meaningful participation; and a stronger sense of identity within their chosen discipline and university life in general. By participating in peer led programs, students are also taking ownership of their learning skill development. Longfellow et al (2008) considered this a significant benefit of peer programs, particularly in light of the focus in the UK on retaining students from non-traditional backgrounds. Similarly in Australia, Geoff Scott (2008) researching retention at UWS, identified a number of factors that are provided in a peer led learning assistance program: the presence of a supportive peer group; consistently accessible and responsive staff; clear management of student expectations, including active briefings on ‘how things work around here’; prompt and effective management of student queries; and ‘just-in-time’ and ‘just-for-me’ transition support, including the use of self-teaching and orientation materials written by students from a similar background who have successfully managed the transition, on how they did it.
Formative assessment instruments
not finding the activities useful and topic coverage inappropriate (and this can also relate to the AQF requirements for the degree level), there is an inherent assumption that the student increases the risk of lower grades or even dropping out of the course, creating challenges in persistence and retention. Whether this is a legitimate assumption, given the role of LAPs (cf. CAS, 2012), it is an example of drilling down the RFF down to the program level which, later on can act as part of the institutional aggregate of documenting response and success specific to these two issues as suggested in Figure 6 above.
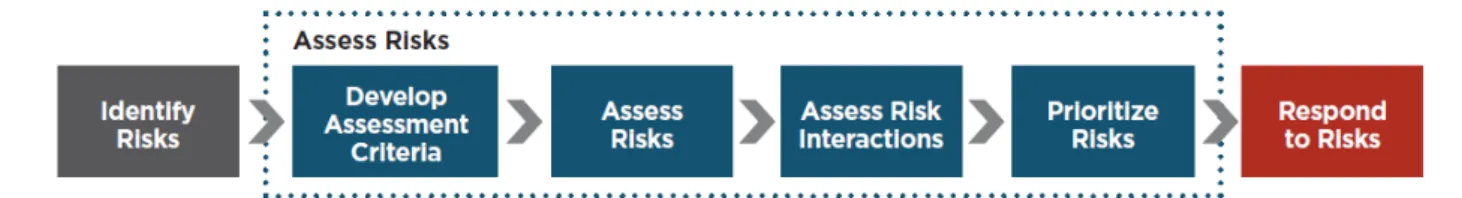
The Session Leader survey acts as another source of information on what was covered, student issues raised, and a second perspective on how the session went, a form of triangulation (to use a term from qualitative research). If there is a lack of congruence between the view of students and the Session Leader, this then becomes an obvious indicator of potential problems requiring remedy. The items within the Session Leader survey help create a matrix that automatically reflects ERM in that it has a similar response chain to traditional managerial-based performance activities. Although the focus is not to measure or prioritize risk (at least at this time) the focus is to establish event identification that precedes response (cf. Curtis & Carey, 2012). In this case, to use Curtis and Carey’s (2012) language, the risk factor is dynamic rather than static, hence to need to continually monitor through a formative assessment and evaluation set of processes.
Meet-Up Participants: One Minute Survey Course:
Campus: Date:
Did you find this week’s activities useful?
X X X
Do you have any comments?
What would you like to cover next time? (Please limit to 3 items)
Figure 8. Meet Up weekly student survey
Weekly Leader Feedback on Meet-Up sessions: S 1, 2013 Week and date:
Course/program: Campus:
Leader/s:
Very
useful
Somewh
at useful
Not
Brief outline of
topics/concepts/course material you covered in Meet-Up session
Issues or topics raised by
students and discussed in Meet-Up session
How do you think the session
went?
Outline any comments made by
students about Meet-Up
What did you contribute to Online Meet-Up?
(Please note that not all leaders are required to manage an online Meet-Up forum, but you are all welcome to contribute to them.)
source: Curtis & Carey, 2012, p. 2.
Figure 10. COSO risk process flow diagram
Discussion of expected results & Concluding comments
In their seminal book, Bolman and Deal (2008) talk about organizations from a four-frame model perspective: structural, human resources, political, symbolic. Much of what ERM represents is structural in nature although it also represents the other three frames. It is worth thinking of ERM in this view because it represents a shifting of the ‘mental model – a set of ideas and assumptions – that you carry in your head to help you understand and negotiate a particular “territory”’ (p. 11). ERM is at the program level more of a structural frame because, as Bolman and Deal (2008) point out, structure deals with the assumptions that organizations exist to achieve established goals (and outcomes, division of labour helps to accomplish these goals and outcomes and thus the need for coordination of efforts, organizations work best when rationality prevails over personal agenda and external pressures, structures are designed to fit an organization’s current circumstances, and problems arise and performance suffers from structural deficiencies that can be remedied through analysis and restructuring.
Wags can say that, in effect, ERM is a replacement of the engineering mindset at looking at university performance with the accountant’s financial auditing mindset. However, it is probably more of the case at looking at the other side of the same coin. It is another approach of looking at institutional actions based on responses to external and internal circumstances and demands. It is based on the prospect of effective performance as measured against expectations, especially when money and/or other forms of resources create a transaction based on mutual benefit.
Implied at the beginning of this section is that ERM is more than structural in scope. Looking at the COSO cube, this becomes apparent because it works with setting up institutional response in relation to external demands and expectations (at Bolman & Deal’s political and symbolic frames level). The key is how to drill down ERM activities and framework down to the unit and program level. What this paper discusses are the structural issues surrounding ERM, the environmental scanning required to determine how to best embed ERM into existing performance and continuous improvement activities and the tactical approach on how to get ERM started – especially in non-ideal circumstances, i.e., when a data-driven environment is not fully in place.
What has been described here is what is currently happening. Data is being collected and decisions are only now beginning to be framed from a broader perspective that includes risk identification and response. At the very least, the expectations are that [1] data collected will inform the internal ERM decision matrix upon its completion and [2] ERM more than embedded within the continuous improvement formative assessment process on a de facto basis. Using ERM as defined by TEQSA’s RFF, Threshold Standards and the AQF provides a frame of reference (Figure 6) for the process so that the data eventually reflects the program’s impact not only within courses but at the university-wide level as well as part of an incremental evidentiary process that documents retention, persistence and graduation rates. Putting ERM in context will require a reciprocal process until such time the existing process controls can identify and embed all the notions. In many respects, what ERM will do is look at existing KPI and reframe them into KRIs, which when brought together should be able to strengthen the ability to determine how well the program is doing as well as identify programs strengths and weaknesses that can be enhanced or improved upon. Using a ‘small wins’ strategy allows us to provide specific foci to the embedding process to provide specific understanding of the various elements of the program. It is by putting these discrete and separate milestones as it were in place that will help formulate Meet Up’s larger picture.
References
Aman, A.C. & Maynton, W.T. (1993). Administrative law. St. Paul, MN: West Publishing Co.
Association of Governing Boards of Universities and Colleges [AGB] & United Educators. (2009). The state of enterprise risk management at colleges and universities today. Chevy Chase, MD: Association of Governing Boards. Retrieved from http://agb.org/sites/agb.org/files/u3/AGBUE_FINAL.pdf
Astin, A.W. (1985). Achieving educational excellence: A critical assessment of priorities and practices in higher education. San Francisco: Jossey-Bass.
Australian Qualifications Framework Council. (January 2013). Australian
Qualifications Framework. (2nd ed.). Adelaide, AUS: Author. Retrieved from
http://www.aqf.edu.au/Portals/0/Documents/2013%20docs/AQF%202nd
Azzam, T. (2010). Evaluator responses to stakeholders. American Journal of Evaluation, 31(1), 45- 65.
Banta, T.W. & Pike, G.R. (2007). Revisiting the blind alley of value added.
Assessment Update, 19(1), 1-5.
Biggs, J. (1999). Teaching for quality learning at university: What the student does. Suffolk, UK: Open University Press.
Bolman, L.G., & Deal, T.E. (2008). Reframing organizations: Artistry, choice, and leadership. (4th ed.). San Francisco: Jossey-Bass.
Bresciani, M.J. 92006). Outcomes-based academic and co-curricular program review: A compilation of good institutional practices. Sterling, VA: Stylus.
Brett, K.J. & Winchester, H.P.M. (2011). Managing risk in the non self-accrediting – higher education provider (NSA-HEP) sector. In Proceedings of AuQF2011: Demonstrating quality, Melbroune, Australia 29 June – 01 July 2011. (pp. 54-60). Retrieved from
http://www.auqa.edu.au/files/publications/auqf_proceedings_2011.pdf
Bubka, M.A. & Coderre, P. (October 2010). Best practices in risk management for higher education: Addressing the “What If” scenarios. Blue Bell, PA: PMA Companies. Retrieved from
http://pmacompanies.com/pdf/MarketingMaterial/PMA_Education_BestPractices_ WhitePa per.pdf
Bugalla, J. & Narvaez, K. (29 August 2012). Why U.S. risk managers should take a hint from the rest of the world Risk & Compliance. Retrieved from http:// www3.cfo.com/article/2012/8/risk- compliance_erm-coso-iso-31000-narvaez-bugalla
Coates, H. (2009). What’s the difference? A model for measuring the value added by higher education in Australia. Higher Education Management and Policy, 21(1), 77-95.
Council for the Advancement of Standards in Higher Education [CAS]. (2012).
CAS professional standards for higher education. (8th ed.). Washington, DC: Author.
Curtis, P. & Carey, M. (October 2012). Risk assessment in practice. Durham, NC: Committee of Sponsoring organization of the Treadway Commission
(COSO). Retrieved from
http://www.coso.org/documents/COSOAnncsOnlineSurvy2GainInpt4Updt2IntrnlCn trlIntgrat dFrmwrk%20-%20for%20merge_files/COSO- ERM%20Risk
Fitzpatrick, J.L., Sanders, J.R., & Worthen, B.R. (2004). Program evaluation: Alternative approaches and practical guidelines. (3rd ed.). Boston: Allyn & Bacon.
Fulcher, K.H. & Willse, J.T. (2007). Value added: Back to basics in measuring change. Assessment Update, 19(5), 10-12 .
Hart, H.L.A. (1997). The concept of law. (2nd ed.). London: Oxford University Press.
Harty, H.P. (2013). Sorting the relationships among performance measurement, program evaluation, and performance management. In S.B. Nielsen and D.E.K. Hunter (Eds.), Performance management and evaluation. New Directions for Evaluation, 137, 19-32.
Hu, S., & Kuh, G.D. (2002). Being (dis)engaged in educationally purposeful activities: the influences of student and institutional characteristics.
Research in Higher Education, 43(5), 555-575.
ISO. (2009). International standard ISO 31000: Risk management – Principles and guidelines. (1st ed.). Geneva: Author.
Kek, Y.C.M.A. (2012, 2 August). Integrated Student Learning Journey Initiative (ISLJI) Final Paper: The Integrated Student Learning Journey – Student Personalised Academic Road to Success (SPARS): A Framework for the Provision of Adaptive and Student-Directed, On-line, On- demand, Integrated Study Support to Students. Paper submitted to the Director, Learning and Teaching Support, Office of Pro-Vice Chancellor (Learning, Teaching and Quality),
University of Southern Queensland.
KPMG. (November 2001). Enterprise Risk Management: An emerging model for building shareholder value. Melbourne: Author. Retrieved from
http://www.kpmg.com.au/aci/docs/ent-risk- mgt.pdf
Padró, F.F. (2013a). Accreditation and institutional learning: A stochastic proposition because it is the cornerstone to an effective quality assurance system in higher education often pursued from the perspective of a
minimaxing regime. In M. Shaw & C.S. Nair (Eds.), External quality audits: Has it improved quality assurance in universities? (pp. 247-268). Cambridge, UK: Chandos Publishing.
Padró, F.F. & Frederiks, A. (2013). Evaluating the impact of the Learning Centre on student learning and satisfaction. In Design, develop, evaluate: The core of the learning environment. Proceedings of the 22nd Annual Teaching Learning Forum, 7-8 February 2013. Perth: Murdoch University.
http://otl.curtin.edu.au/professional_development/conferences/tlf/tlf2013/ refereed/padro. html
de-grading schools: Alternatives to accountability and standardization. (pp. 27-43). New York: Peter Lang.
Padró, F.F. & Kek, Y.C.M.A. (April 2013). Student engagement and student satisfaction: Two measures arguing for independent review criteria of standards for student support services in national quality assurance schemes. Unpublished paper presented at INQAAHE Bi-annual Conference, Taipei, Taiwan.
Pawson, R. (2006). Evidence-based policy: A realist perspective. London: SAGE.
Pawson, R., Wong, G., & Owen, L. (2011). Known knowns, known unknowns, unknown unknown: The predicament of evidence-based policy. American Journal of Evaluation, 32(4), 518-546.
Ramsden, P. (1991). A performance indicator of teaching quality in higher education: The Course Experience Questionnaire. Studies in Higher Education, 16(2), 129-150.
Scarlat, E., Chirita, N, & Bradea, I-A. (2012). Indicators and metrics used in the enterprise risk management (ERM). Economic Computation and Economic Cybernetics Studies and Research, 46(4), 5-18. Retrieved from
http://www.ecocyb.ase.ro/20124pdf/Emil%20Scarlat%20(T).pdf
Schuh, J.H. (2009a). Assessment as an essential dimension of contemporary student affairs practice. In J.H. Schuh (Ed.) & Associates, Assessment methods for student affairs. (pp. 1-22). San Francisco: Jossey-Bass.
Schuh, J.H. (2009b). Looking at the future of assessment: Some ideas and musings. In J.H. Schuh (Ed.) & Associates, Assessment methods for student affairs. (pp. 231-248). San Francisco: Jossey- Bass.
Schein, E.H. (1985). Organizational culture and leadership. San Francisco: Jossey-Bass.
Scriven, M. (1993). Hard-won lessons in program evaluation. New Directions for Program Evaluation, Number 58. San Francisco: Jossey-Bass.
Shuell, T.J. (1986). Cognitive concepts of learning. Review of Educational Research, 56, 411-436.
Stake, R.E. (2004). Standards-based & responsive evaluation. Thousand Oaks, CA: SAGE.
Stufflebeam, D.L. & Shinkfield, A.J. (2007). Evaluation theory, models, & applications. San Francisco: Jossey-Bass.
Terenzini, P.T. (2013). “On the nature of institutional research” revisited: Plus ça change…? Research in Higher Education, 54(2), 137-148.
Tertiary Education Quality and Standards Agency [TEQSA]. (February 2012).
http://www.teqsa.gov.au/sites/default/files/TEQSARegulatoryRiskFramework_0.pd f
Tinto, V. (1993). Leaving college: Rethinking the causes and cures of student attrition. (2nd ed.). Chicago: University of Chicago Press.
Tufano, P. (2011). Managing risk in higher education. In, Forum for the Future of Higher Education, EDUCAUSE. (pp.54-58). Retrieved from
http://net.educause.edu/ir/library/pdf/ff1109s.pdf
Voorhees, R.A. & Hinds, T. (2012). Out of the box and out of the office: Institutional research for changing times. In R.D. Howard, G.W. McLaughlin, William e. Knight (Eds.) and Associates, The handbook of institutional research. (pp. 73-85). San Francisco: Jossey-Bass.
Weick, K.W. (1984). Small wins: Redefining the scale of social problems.