doi:10.1155/2010/807098
Research Article
Multiple Input to Multiple Output Images Fusion Based on
Turbo Iteration
Chu He, Meng-ling Liu, Na Li, and Hong Sun
Signal Processing Laboratory, Department of Communication Engineering, School of Electronic Information, Wuhan University, 430079 Wuhan, China
Correspondence should be addressed to Chu He,[email protected]
Received 31 May 2009; Revised 4 November 2009; Accepted 12 January 2010
Academic Editor: Laurent Ferro-Famil
Copyright © 2010 Chu He et al. This is an open access article distributed under the Creative Commons Attribution License, which permits unrestricted use, distribution, and reproduction in any medium, provided the original work is properly cited.
This paper mainly addresses the problem of multipolar Synthetic Aperture Radar (SAR) and colorful optical images fusion by regarding them as multichannel images. Based on traditional wavelet-based and model-based fusion algorithms, the paper proposes a multi-channel image fusion algorithm based on a multi-multiturbo iterative method. Multi-multiframe is proposed to represent the original image information with multiple outputs from better information-separating viewpoints, and turbo iterative balances wavelet-based and model-based fusion. The approach is designed in this manner. First, Intensity-Hue-Saturation (IHS) transformation is applied to the SAR and optical images. Then, different fusion processes are used on corresponding components. Fusion based on multi-multi and turbo iterative is applied to the Intensity component whereas weighted fusion is applied to Hue and Saturation components. To get the final result, inverse IHS transformation is applied. Experimental results show that the proposed algorithm performs effectively in preserving useful complementary information between optical and SAR images.
1. Introduction
Synthetic Aperture Radar is a type of active remote sensor radar working on microwave band. Because more and more Synthetic Aperture Radar sensors are being used in many fields, the volume of SAR images increases rapidly. Because of the coherent imaging mechanism, SAR images are hard to interpret due to their inherent multiplicative speckles.
With the development of image sensor technology, multisensor image fusion has attracted serious concern in image analysis, computer vision, and remote sensing, which is widely applied to a variety of fields such as automatic target recognition, intelligent robots, remote sensing, medical image analysis and manufacturing. Pixel-level multisensor image fusion can obtain more original information and has a better detection performance.
Numerous reports document pixel-level image fusion algorithm. They can usually be classified in four primary cat-egories based on the technology used: space domain-based methods [1–3], pyramid-based methods [4, 5], statistical model-based methods [6], and other methods [7].
Space domain-based methods include average, weighted average, max, min, and other linear or nonlinear, selection
or count algorithms on intension of every pixel from each fusion source image [2, 3]. Principal component analysis (PCA) is another classical algorithm [1]. It can be regarded as a special space domain-based method whose weighted value is produced automatically to remove the relativity existing between the source images.
Pyramid-based methods always need a pyramid decom-posed procedure at first. Then many algorithms can be adopted in the same level data of different source images, to produce a results pyramid. Finally, an inverse transformation is applied to produce the fusion result [4,5].
Another typical method is the statistical model-based method which models the production process of multisensor images and concomitant noises with a Local Linear Gen-erative Model (LLGM). A Bayesian framework is used to estimate the parameters of the model and the true scene from the different sensor images [6].
Interleaver
Encoder 1
Encoder 2
Channel SISO decoder
1
Decode bit Interative
Interwine Interwine
SISO decoder
2
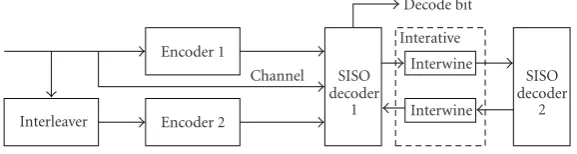
Figure1: Framework of Turbo code.
When processing color images, the Intensity component is usually extracted by IHS transformation; the innovative work is often conducted in the fusion step of different intensity components derived from multiple sensors. The result is obtained using inverse IHS transformation.
Due to the limited capacity for one image to cover com-plete information of multi-channel images from multiple sensors, fusion should be applied to multiple fusion outputs according to the corresponding application, which surely has advantages over a traditional multione fusion system. What is more, traditional fusion algorithms generally have their own insurmountable drawbacks such as wavelet and model-based fusion algorithms. Traditional fusion based on a wavelet can retain detailed information effectively, but it can be too sensitive to noise because the noise usually appears in the high-frequency domain. Model-based fusion methods can provide a comparatively reliable result for noisy images because it considers the noise effect; however, too much detailed information may be neglected.
Based on the discussion above and our previews work [8,9], a channel fusion algorithm based on a multi-multiturbo iterative for the application of fusion of color optical images and multi-polar SAR images is proposed in this paper, which is essential for representing different con-tent from better information-separating viewpoints. Wavelet fusion could retain detailed information better because it is sensitive to noise. Model-based fusion could control noise effectively because it considers the noise while ignoring some details. Turbo iterative is introduced here to balance wavelet and model-based fusion.
The original information is temporarily represented by multiple outputs on each iteration step, which leads to a more reliable result to be used by following image processing. IHS transformation and multi-multi based turbo iterative are incorporated to address the fusion of color optical and multi-polar SAR images.
The remainder of this paper is organized as follows. Section 2reviews Turbo fundamental and turbo iterative in signal processing.Section 3describes the traditional fusion method. Section 4illustrate turbo-based fusion framework in details and Section 5 describes turbo iterative fusion method of optical image and SAR image. In Section 6, experimental results on real images are presented and analyzed.Section 7concludes the paper.
2. Turbo Iterative
2.1. Fundamental of Turbo Code. Turbo codes proposed by Berrou et al. [10] are promising in the field of coding
U c0
c1
c2
RSC encoder 1
RSC encoder 2 Interleaver
U
Figure2: Framework of turbo encoder.
U c0
c1
c2
RSC encoder 1
RSC encoder 2 Interleaver
U
BPSK BPSK
BPSK
AWGN x0
+ r0
AWGN x1
+ r1
AWGN x2
+ r2
Figure3: An essential turbo encoder.
theory, which uses two encoders and a so-called turbo iterative encoder to derive a satisfying performance for several channels. Turbo code can approach the Shannon limit and be realized.Figure 1illustrates framework of generating turbo code. Notice the application of the input soft-output (SISO) decoders.
The fundamental encoder of Turbo code is built using two identical Recursive Systematic Convolutional (RSC) codes with parallel concatenation. The two encoders are separated by an interleaver. Only one of the systematic outputs from the two component encoders is used, because the systematic output from the other component encoder is just a permuted version of the chosen systematic output.
Figure 2 illustrates the framework of a turbo encoder. Because one input generates three outputs, the turbo rate is 1/3. Usually, the two encoders are the same in as shown in Figure 2.
Check sequencer1 MAP
decoder 1
Deinterleaver
Interleaver
Interleaver Outside information
Λ1e
Check sequencer2 MAP
decoder 2
Decision device
Output
LikelihoodΛ2
Outside informationΛ2e
Input sequencer0
Figure4: Framework of turbo decoder.
Considering the turbo code in Figure 3, each bit of message sequenceuis supposed to be independent uniform distributed random variable:
Pr{ut=1} =Pr{ut=0} = 1
2. (1)
Received sequences r0 and r1 are the input of first
decoder, represented asr:
r=· · ·rt,0,rt,1
,rt+1,0,rt+1,1
,· · ·. (2) The received sequencesr0andr2from the deinterleaver
are the input of the second decoder, represented asr:
r=· · ·rt,0,rt,2
,rt+1,0,rt+1,2
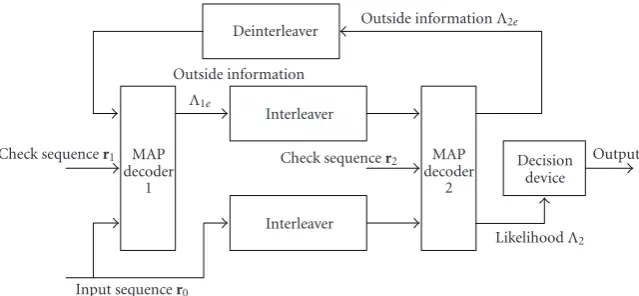
,· · ·. (3) The turbo decoder framework is shown in Figure 4. It consists of two subdecoders serially concatenated by an interleaver and a deinterleaver. The interleaver here is same as the interleaver in the turbo encoder. The algorithm applied in the subdecoder is a maximum a posterior estimation (MAP). ras the input of MAP decoder 1 can get soft output which is used to obtain likelihood of the information sequence of MAP decoder 2 by the interleaver. Another input of MAP decoder 2 is r.It also obtians soft output to improve the likelihood of the information sequence of MAP decoder 1.
Compared to the one-time operation of a Serial Concate-nated Convolutional Code (SCCC) decoder, a turbo decoder can improve performance by way of iterative operation; the feedback loop is the significant characteristic of a turbo-decoder. (The name “turbo” is applied based on the working principle of a turbo engine.)
After some iteration, the exchange between the two MAP decoders cannot improve and further, so the output of MAP decoder 2 is passed to the interleaver to generate a final decision.
Common decoding algorithms include BCJR [11], MAP [12], Max-Log-MAP [13], Log-MAP [14], and SOVA [15].
The Interleaver is a soft-input soft-output (SISO) device. Its input has the same symbol set as its output, but in a different order. Let’s use the example of a set{1, 2,. . .,N}.
We can describe the interleaver’s mapping function as j =
π(i), i,j∈A, whereiandjare the serial numbers of symbols
u: u1 u2 u3 u4 u5 u6 u7 u8
u: u2 u4 u1 u6 u3 u8 u5 u7 Figure5: Mapping function of interleaver.
of the original sequence and the interleaver sequence, respectively. We can represent the mapping function as follows:
πN =(π(1),π(2),π(3),. . .,π(N)). (4) We use the following example to illustrate the inter-leaver’s mapping function. Assume an 8-length pseudo-random interleaver in which the input sequence is u = (u1,u2,u3,u4,u5,u6,u7,u8).After interleaver we get
u=(u1,u2,u3,u4,u5,u6,u7,u8)
=(u2,u4,u1,u6,u3,u8,u5,u7).
(5)
The mapping function is shown inFigure 5. The inter-leaver vector is represented as follows:
π8=(π(1),π(2),π(3),π(4),π(5),π(6),π(7),π(8))
=(3, 1, 5, 2, 7, 4, 8, 6). (6)
2.2. Turbo Iterative in Signal Processing. The framework of signals optimal estimation on turbo iterative is illustrated in Figure 6.
According to the principles of signal processing, some independent constraint subspaces are established at signal space or label space. Optimization is done at independent constraint sub-spaces separately. Then iteration is conducted with information exchanged in signal space or label space.
Signal field/label field Information
exchange
Energy 1 Energy 2 · · · Energyn · · · Energy field Optimal estimation of weights of energy
field
Figure6: Optimal estimation framework of signals based on turbo iterative.
Processing system 1 Parameter estimation 1
Parameter estimation 2 Processing system 2 Signal
input
Output 1 Feature extraction1
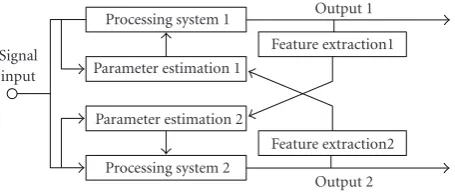
Feature extraction2 Output 2 Figure7: Turbo iterative framework.
done in independent constraint sub-spaces for complicated signal estimation problems. Turbo iterative can help to solve these problems.
The essence of turbo interative is to guarantee two uncorrelated component codes and make better use of the information by exchanging it during the iteration. The essence has been introduced into image processing before [8,16]. The main concepts of turbo iterative are threefold. First, the interleaver obtains two orthogonal checking codes a from the same information code. Second, the orthogonal checking codes are decoded using the turbo iterative method, and extrinsic information is exchanged. Third, so-called “soft information” and “reliability” (or “marginal probability”) are exchanged during iteration. The framework of signal processing based on the turbo iterative method is shown in Figure 7.
Three steps can summarize the turbo iterative framework used in signal processing. First, two orthogonal signal spaces are set up. The two orthogonal signal spaces are linked by original signals and the models of original signals. Second, soft estimation is done on the two orthogonal signal spaces, respectively. Posterior probability is output at the second step. Third, “soft information” and “reliability” are exchanged between the two orthogonal signal spaces.
Why does the turbo iteration method work? To begin with, each system takes the results of the other system into consideration. This characteristic can greatly improve the performance. Next, iterations on more than one system can produce global optimization. Furthermore, the systems work independently so the computational complexity is linear. When complementary systems are applied, the information will exchange at the turbo iterations. Good information will be retained and noise will be cast off.
3. Traditional Fusion Methods
In this section, we review traditional fusion methods such as the pyramid-based and the model-based fusion methods.
3.1. Description of Pyramid-Based Methods. In [5], a uniform pyramid-based fusion framework is presented as illustrated by Figure 8. The framework comprises five parts. The first part is multiscale decompositions (MSD). The mostly widely-used MSD methods include pyramid transformation (PT), discrete wavelet transformation (DWT), and discrete wavelet frame (DWF). The second part is activity level measurement that includes pixel-based, window-based, and region-based methods. The third part includes three types of grouping. The last two parts are combining methods and consistency verification.
There are multiple choices in the processes shown in Figure 8. Different combinations of each part can form different fusion methods.
One of the typical pyramid-based methods is wavelet-based fusion method. The rapid multiresolution analysis algorithm based on wavelet proposed by Mallat [4] is popularly used in two-dimensional image processing and analysis. Assume LL0is the original image, for certain scaling
and wavelet functions, the wavelet decomposition can be processed as shown in (7).
In the following equation, ∗ means convolution, ↓
means downsampling and i indicates the decomposition level. Herehand g is a particular pair of analysis filters. One approximation image (LL) and three detail images (LH, HL, and HH) are obtained here.
Corresponding coefficients of the source images at each level are then fused, respectively, based on certain fusion rules, which can be a simple weighted fusion or a PCA method. The output image can be obtained using an inverse wavelet transformation:
LLi+1=h2↓1∗h1↓2∗LLi,
LHi+1=h2↓1∗g1↓2∗LLi,
HLi+1=g2↓1∗h1↓2∗LLi,
HHi+1=g2↓1∗g1↓2∗LLi.
(7)
3.2. Description of Model-Based Methods. The wavelet-based fusion method deals with the high frequency range of both image details and noise. Thus, the wavelet-based method is sensitive to noise. To overcome the limitation of the wavelet-based method, Sharma [6] proposed a model-wavelet-based method to overcome the noise problems. A model is set up on true scene images at first, then parameters of the model are estimated based on the source images. Finally, Bayesian theory is used to estimate the fusion scene. We denote the true scene assand sensor image can be modeled as follows:
Ai
l =βi
l s
l +αi
l +εi
l . (8)
In the equation,Aiis theith sensor image,
Images input PT DWT DWF MSD methods Pixel-based Window-based Region-based Activity level measurement No grouping Single-scale grouping Multi-scale grouping Grouping methods Choose max Weighted average Combining methods No verification Window-based verification Region-based verification Consistency verification Fusion results . . .
Figure8: Generic framework for pyramid-based fusion schemes refers to [5].
levelkif a multi-scale analysis is adopted.αiis the sensor bias of theith sensor, which captures the effects of dysfunctional sensor elements. βi is the sensor gain of the ith sensor, which captures the effects of local polarity reversals and complementary features. εi is the sensor noise with zero mean and variance σ2
ε. The parameters here are assumed independent of the true scenes.
Assuming the noise existing in sensors is irrelative to each other, the varianceσ2
ε is a diagonal covariance matrix, andσε2i can be estimated by the difference.Ai(t) is theith image with
tlevel of pyramid.Ai(t) stands for the mean of theith image withtlevel of pyramid:
σ2
εi(t)=A
2
i(t)−Ai
2
(t). (9)
Then, the problem of fusion is transformed to a Bayesian framework to estimate the true scene s. At first, the local image formation model parameters and the local sensor noise covariance are needed to estimate. The latter can be estimated from all the images of each sensor. Least squares factor analysis estimation is adopted to estimate the parametersαiandβi. μAis the mean of all sensor images data. We assume that the scenes is at each location with mean
s0(
−→
l) and varianceσs(
− →
l).s0(
−→
l) of different local regions is with meanμs0and varianceσs0
αLS=μA−βμs0,
βLS=λ 1/2
σs,s0
Ur,
(10)
whereUis an eigenvector, andλis an eigenvalue of the noise-corrected covariance matrix(A−
ε). The parameterr =
±1 determines the polarity of contrast in the fused image.
σ2
s,s0≡σ
2
s +σs20is the total variance ofs,σ
2
s0is local variance. We assumeμs0 =0 andβ =1, what is reasonable [6]. The parameters estimation can be simplified to
αLS=μA, (11)
βLS=eig ⎛ ⎝ A − ε ⎞
⎠=eig
⎛
⎝
A
⎞
⎠. (12)
Finally, the true scenescan be obtained by two algori-thms: maximum a posteriori (MAP) and maximum
likeli-hood (ML):
SMAP
=
β1(A1−α1)/σε21+β2(A2−α2)/σ
2
ε2+S0/σ
2
S
β21/σε21+β
2
2/σε22+ 1/σ
2
S
.
(13)
Assume a flat prior, that is,σ2
s = ∞, the MAP will be ML:
SML=
β1(A1−α1)/σε21+β2(A2−α2)/σ
2
ε2
β21/σε21+β
2 2/σε22
. (14)
All the estimation is done in the local analysis windowR, on the assumptions that they all hold true over a spatial region [6].
4. Turbo-Based Fusion Framework Description
In this section, we review a multi-single turbo iterative framework and a multi-multi turbo iterative.
4.1. The Framework of Multisingle Turbo Iterative. As shown in Section 3, the wavelet-based method is used to find the changes in different source imagery and merge them into a single result; so we can expect that it should be sensitive to noise. In contrast, a statistical model-based method is useful to surmount system noise, but it depends on prior information obtained from the fusion result. Interestingly enough, when we look closely, we can see that these two totally different methods can in fact be complementary. Hence, the turbo iterative method is introduced to combine the two methods as illustrated inFigure 9.
Model-based fusion Prior estimate Wavelet-based fusion Fused image Fused image S1
S2 .
. . Sn
S
Figure9: Framework of wavelet and model-based fusion by multi-single turbo iterative.
The iterative algorithm is named turbo iterative for its consistency with the concept of turbo codes, which exhibit exceptional behavior in channel coding [10, 17–19]. The elaborate selection of two orthogonal algorithms is reflected in the design of the interleaver in turbo codes. It can be proved that through the iterative process and the information exchange of two different algorithms that the output image can converge to match the true scene in a more efficient manner with less influence by noise.
In (12),βis a vector. The inputsis a vector that includes certain different images. The outputsis one image.
So in this case, the turbo iterative method employs a multi-single framework.
4.2. The Framework of Multi-Multiturbo Iterative. Image fusion should include multiple outputs of different informa-tion from multiple viewpoints on a certain scene rather than a fixed result. A multi-multifusion system is presented for this case.
The object of a multi-multisystem is to obtain multiple images of the same scene from different viewpoints. Equation (8) can be rewritten as follows:
Ai
l =βi
l si
l +αi
l +εi
l . (15)
Here, the parameterβis a matrix andsis a vector.
Considering the assumptions mentioned above, the simplified parameters estimation can be
⎛
⎝α1
α2 ⎞
⎠=
⎛
⎝μA1
μA2 ⎞
⎠,
⎛
⎝β1
β2 ⎞
⎠=
⎛
⎝U1
U2 ⎞
⎠.
(16)
With the estimation ofαandβ,swill be
siML= ⎡
⎣βT
−1 ε β ⎤ ⎦
−1⎛
⎝βT
−1
ε
(A−αi)
⎞
⎠. (17)
5. Optical and Multipolar Sar Fusion
Based on Turbo
This section introduces the proposed fusion algorithm on multi-channel images. Model-based fusion Prior estimate Wavelet-based fusion Fused image Fused image S1
S2 .
. . Sn S1 S2 Sn . . .
Figure10: Framework of multi-multi turbo iterative.
5.1. Data Processing. IHS transformation is a useful tool in processing color images. No matter which mathematical description is chosen, the principle is separating the spectral information H and S of an RGB image, while isolating the intensity component I.This paper adopts the model derived as follows [20]:
θ=arccos ⎧ ⎪ ⎨ ⎪ ⎩
1/2[(R−G) + (R−B)]
(R−G)2+ (R−B)(G−B)1/2 ⎫ ⎪ ⎬ ⎪ ⎭, H= ⎧ ⎨ ⎩
θ if B≤G,
360−θ if B>G, S=1−3×[min(R, G, B)]/(R + G + B),
I=R + G + B
3 .
(18)
The pseudocolor SAR image is formed from several single-polar images by assigning RGB values to single-polar images like HH, HV, and VV. The approach mimics the way an optical image is formed by assigning RGB values to three gray images.
The IHS transformation also could be applied to multi-polar SAR images while retaining complete information. The IHS transformation can be applied to optical and SAR images, then the corresponding IHS components would be derived.
5.2. Fusion Based on Multi-Multi Turbo Iterative Using Wavelet-Based and Model–Based Fusion Methods. Wavelet-based fusion and model-Wavelet-based fusion are two unrelated algorithms that offer their own advantages. Using the turbo iterative, we can iterate these two methods until the difference between the two results is under some threshold. Prior information such as mean and covariance from each wavelet-based fusion could be incorporated by the following model-based fusion. The framework of the multi-multi turbo iterative algorithm is presented byFigure 10.
Data processing
Optical image A
SAR image B
IHS
tr
ansfor
m
ation
IHS
tr
ansfor
m
ation
Inverse-IHS transformation
Ho
So Io
Hs
Ss Is
Multi-to-multi turbo iterative fusion
Wavelet-based fusion
Fu
se
d
im
ag
e
Prior estimate
Model-base fusion
Weighted sum fusion Weighted sum
fusion
H S
I
Figure11: Flowchart of optical and SAR fusion based on multi-channel multi-multi turbo iterative.
Table1: Pseudocode of optical and SAR image fusion based on multi-multi turbo iterative.
Input Optical image A and SAR image B.
Step 1 Do IHS transformation on A and B. Get IHS sub-variables.
Step 2 Do multi-multi turbo iterative fusion on I
(a) I subvariables of optical and SAR images are input to wavelet-based fusion part and get the fused image. (b) Prior is estimated with fused images of (a) step. (c) Prior is passed to multi-multimodel-based fusion part and get the fused image passed to wavelet-based fusion.
(d) Go to (b) to iterative until convergence.
Step 3 Do weighted sum fusion on H and S.The process is done weighted sum on H and S.
Step 4 Inverse IHS transformation.
image and SAR image fusion based on multi-multi turbo iterative is shown asTable 1.
6. Experiments and Analysis
6.1. Experiment 1. Pyramid and model-based fusion with a multi-single turbo iterative method was applied to the fusion between SAR and visible-band imagery, and between different polarization SAR imagery. The traditional methods were also performed as a contrast. The experiment was carried out successfully on a software platform we developed for the implementation, interpretation, and evaluation of SAR image fusion. To evaluation the results, we elected dif-ferent objectivity evaluation indices [21–24]. Interpretation algorithms (such as target extraction) were performed on the source images and the fusion result image. Entropy,
Table2: Evaluation of fusion methods.
Entropy Interaction Correlation Gradient entropy
HH 7.9
HV 7.18
Average 8.29 0.33 0.94 62.9
PCA 3.53 0.03 0.3 2.4
Pyramid 8.83 1.01 0.96 109
Model 8.74 1.03 0.95 96.1
Turbo 8.94 1.11 0.96 115
interaction entropy, correlation, and gradient algorithm indices were used to evaluate the fusion method.
Entropy measures the degree of information contained in a fused image, and describes the capability of detail retention. Interaction entropy evaluates the similarity between two images, thus reflecting the differences of the same pixels in compared sensor images. The larger the value of interaction entropy obtained, the more information is retained after fusion. Correlation indicates the degree of image change after fusion. Because the rate of change can be described by gradient, it can reflect the degree of slight contrast of two images to some extent. Thus, it can be used to evaluate the definition of an image.
(a) (b)
(c) (d) (e)
Figure12: Fusion of two (a) HH, (b) HV, (c) pyramid-based, (d) model-based and, (e) turbo iterative-based.
Table3: CFAR evaluation result on the source and fusion result images.
Source image PCA Wavelet-based Model-based Turbo-based
Actual target 13 13 13 13 13
Detect target 10 10 13 12 12
False alarm detected 6 2 5 5 4
Correct detect rate 76.9% 76.9% 100% 92.3% 92.3%
False alarm rate(/km2) 30 10 25 25 20
Next, we performed a Constant False Alarm Rate (CFAR) detection algorithm on the SAR image and the fusion results with optical image (Figure 13). The CFAR detection algorithm is a signal processing algorithm which minimizes the false alarm probability of radar automatic detection system with clutter interference using detection strategies and detection thresholds. The chosen region is 256∗256 pixels. The actual corresponding area is 0.2 km2.
The white window marks on the target location. We manually selected the actual targets at first to establish a baseline. The scene includes 13 known objects (targets) including roads, car parks, and cars.
We then counted the detected targets and the False Alarm Detected. The Correct Detected Rate is calculated by using Detect Target divided the Actual Target. The False Alarm Rate is calculated by using False Alarm Detected divided the area. Table 3shows that almost all the traditional fusion methods can decrease the undetected target, but only by increasing the False Alarm Rate. PCA can decrease the False Alarm Rate, but only by incurring a high undetected target rate. Only the turbo-based algorithm can both decrease the undetected target rate and the False Alarm Rate.
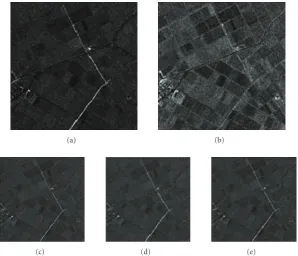
6.2. Experiment 2. Experiment 2 was conducted to com-pare the performance of the wavelet-based fusion method with the multi-multi turbo iterative method. The data was collected at a test site in Oberpfaffenhofen, Ger-many. Figure 14(a) shows high-resolution optical data. Figure 14(b)shows a polarimetric SAR image of the same scene acquired by the E-SAR sensor of DLR [25]. RGB values were assigned to HH, HV and VV.Figure 14(c) shows the results when the intensity components are fused using the traditional wavelet-based algorithm.Figure 14(d)shows the result of the proposed algorithm. To make it clear,Figure 14 presents two small cuts from the experiment images to be compared. Areas in orange and blue rectangles represent areas 1 and 2.
In the compared wavelet-based fusion, we chose the Daubechies Symmetric Spline (DBSS) (2,2) and the decom-position level is 0–4. The weight coefficient assigned to the spectral components H and S is 0.7 in the proposed fusion algorithm.
(a) (b)
(c) (d)
(e) (f)
Figure13: CFAR detection area on the source image and fusion result image, (a)optical image, (b) SAR image, (c) CFAR on source SAR image, (d) CFAR on wavelet-based fusion result, (e) CFAR on model-based fusion result and, (f) CFAR on turbo-based fusion result.
Table4: Quantitative indices for fusion results.
Entropy Average gradient Spectral correlation Spectral distortion
Optical image
R 6.9762 5.3615 G 6.5477 4.5747 B 6.7032 4.4927
SAR image
HH 5.7606 4.2545 HV 5.1637 3.8020 VV 5.3065 3.7237
Multi-channel wavelet-based fusion
R 6.6887 4.6801 0.7714 0.4206 43.5341 1.2169 G 6.4407 3.9598 0.6937 0.3596 46.7885 0.2077 B 6.5275 3.9109 0.7418 0.2486 46.3082 0.4584
Fusion based on multi-channel multi-multi and turbo iterative
R 6.3761 5.5314 0.9824 0.5187 29.9419 0.2236
G 5.9635 5.3521 0.9310 0.4561 32.1052 0.0031
B 5.9946 5.3181 0.9481 0.3654 30.7845 0.0474
in the optical image. The optical image is also seriously affected by the smog as seen on area 1. Apparently, the SAR image is not affected by the smog at all, and something invisible in the optical image appears in the SAR images, such as the point objects seen in area 2. Different textures
(a) (b)
(c) (d)
Figure14: (a) Airborne optical image and its two small cuts. (b) L-band polarimetric SAR image. (c) Fusion results when the intensity components are fused with wavelet fusion. (d) Fusion results based on multi-channel multi-multi and turbo iterative.
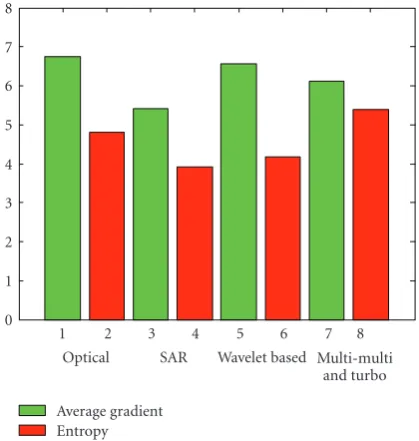
0 1 2 3 4 5 6 7 8
1 2 3 4 5 6 7 8
Optical SAR Wavelet based Multi-multi and turbo Average gradient
Entropy
Figure15: Comparative quantitative indicators for different algo-rithms
Area 2 is chosen to be evaluated by quantitative indicators and the results are shown inTable 4. A comparative graph is presented inFigure 15. InTable 4, the first column of spectral correlation and distortion is for the optical image and the second is for the SAR image. The spectral correlation and distortion are two indicators that reflect the degree of spectral retention. The notions of entropy and average gradient are the same with Table 2. To make it clear, in the graph, the values of entropy and average gradient represent the average of all components in each image.
Table 4andFigure 15illustrate that the proposed fusion algorithm performs better on the average gradient producing better clearness than the source images and wavelet-based fusion.
Furthermore, compared with wavelet-based fusion, this method considerably improves on spectral correlation and distortion. The entropy value here could be explained by the effect of the noise.
In conclusion, from the objective and subjective evalu-ation, the fusion based on multi-channel multi-multi and turbo iterative performs well, which could provide useful data for the further image processing such as classification or object identification.
7. Conclusion
This paper presented an effective multi-channel fusion algorithm based on the multi-multi turbo iterative.
Motivated by the idea that original information of multiple images is hard to be covered by one image, this paper proposes a multi-multi turbo iterative based fusion method for colorful optical and multiple polarimetric SAR images.
The experiments showed that our approach has the following advantages.
(1) Turbo iterative is introduced here to balance the wavelet-based fusion method (which can retain more detailed information and is sensitive to noise) and the model-based fusion (which can effectively control noise).
it surely has advantages over traditional fusion which regards the single image as the only object.
(3) IHS transformation and multi-multi based turbo iterative are incorporated to address the fusion of color optical and multi-polar SAR images. The application to color images absolutely covers more source images from different sensors. What’s more, because of the multiple information contained in color images (such as multiple polarimetric information contained in SAR data) the multi-multi turbo iterative method can surely provide a much more useful result for further image processing.
Acknowledgments
This work is supported by the NSFC Grant (no. 60702041, 60872131, 40871199) and Hi-Tech research and development program of China (863) (no. 2007AA12Z155). This work is also supported by Doctor’s Independent Research Project of Wuhan University (no.20082120201000043).
References
[1] O. Rockinger and T. Fechner, “Pixel-level image fusion: the case of image sequences,” inSignal Processing, Sensor Fusion, and Target Recognition VII, vol. 3374 ofProceedings of SPIE, pp. 378–388, Orlando, Fla, USA, April 1998.
[2] E. Lallier and M. Farooq, “A real time pixel-level based image fusion via adaptive weight averaging,” inProceedings of the 3rd International Conference on Information Fusion (FUSION ’00), vol. 2, pp. WEC3/3–WEC313, July 2000.
[3] C. W. Therrien and W. K. Krebs, “An adaptive technique for the enhanced fusion of low-light visible with uncooled thermal infrared imagery,”Image Processing, vol. 1, pp. 405– 408, 1997.
[4] S. G. Mallat, “A theory for multiresolution signal decomposi-tion: the wavelet representation,”IEEE Transactions on Pattern Analysis and Machine Intelligence, vol. 11, no. 7, pp. 674–693, 1989.
[5] Z. Zhang and R. S. Blum, “A categorization of multiscale-decomposition-based image fusion schemes with a perfor-mance study for a digital camera application,”Proceedings of the IEEE, vol. 87, no. 8, pp. 1315–1326, 1999.
[6] R. K. Sharma, T. K. Leen, and M. Pavel, “Bayesian sensor image fusion using local linear generative models,” Optical Engineering, vol. 40, no. 7, pp. 1364–1376, 2001.
[7] A. M. Waxman, M. Aguilar, and R. A. Baxter, “Opponent-color fusion of multi-sensor imagery: visible, IR and SAR,” in
Proceedings of the IRIS Passive Sensors, vol. 1, pp. 43–61, 1998. [8] C. He, G. Xia, W. Peng, and H. Sun, “SAR image fusion based on turbo iterative,” inProceedings of the 4th International Symposium on Multispectral Image Processing and Pattern Recognition (MIPPR ’05), vol. 6043, pp. 808–815, Wuhan, China, November 2005.
[9] L. Na, H. Chu, Y. Lei, and S. Hong, “Pixel-level image fusion based on multi-to-multi turbo iterative,” inProceedings of the 1st Asian and Pacific Conference on Synthetic Aperture Radar, pp. 793–796, 2007.
[10] C. Berrou, A. Glavieux, and P. Thitimajshima, “Near Shannon-limit error-correcting coding and encoding: turbo-codes,” inProceedings of the IEEE International Conference on Communications (ICC ’93), pp. 1064–1070, Geneva, Switzer-land, 1993.
[11] L. R. Bahl, J. Cocke, F. Jelinek, and J. Raviv, “Optimal decoding of linear codes for minimizing symbol error rate,” IEEE Transactions on Information Theory, vol. 20, no. 2, pp. 284– 287, 1974.
[12] W. J. Gross and P. G. Gulak, “Simplified MAP algorithm suitable for implementation of turbo decoders,” Electronics Letters, vol. 34, no. 16, pp. 1577–1578, 1998.
[13] J. Vogt and A. Finger, “Improving the max-log-MAP turbo decoder,”IEEE Electronics Letters, vol. 36, no. 23, pp. 1937– 1939, 2000.
[14] B. Classon, K. Blankenship, and V. Desai, “Turbo decoding with the constant-Log-MAP algorithm,” inProceedings of the 2nd International Symposium on Turbo Codes and Related Topics, pp. 319–322, Strasbourg, France, September 2000. [15] L. Papke, P. Robertson, and E. Villebrun, “Improved decoding
with the SOVA in a parallel concatenated (turbo-code) scheme,” inProceedings of the IEEE International Conference on Communications, vol. 1, pp. 102–106, Dallas, Tex, USA, June 1996.
[16] S. Hong, H. Maitre, and G. Bao, “Turbo image restoration,” inProceedings of the 7th International Symposium on Signal Processing and Its Applications, pp. 417–420, Paris, France, 2003.
[17] J. Hagenauer, “The turbo principle: tutorial introduction and state of the art,” inProceedings of the International Symposium on Turbo Codes, pp. 1–11, Brest, France, September 1997. [18] H. Sun, H. Maitre, and G. Bao, “Turbo iterative technique
for SAR image processing,” inProceedings of the International Symposium on Information Theory and Its Applications, pp. 395–1398, Xi’an, China, 2002.
[19] X. Wang and H. Poor, “Iterative (turbo) soft interference can-cellation and decoding for coded CDMA,”IEEE Transactions on Communications, vol. 47, no. 8, pp. 1046–1061, 1999. [20] R. C. Gonzalez, R. E. Woods, and S. L. Eddins,Digital Image
Processing Using MATLAB, Publishing House of Electronics Industry, Beijing, China, 2004.
[21] Q. Wang, Y. Shen, Y. Zhang, and J. Q. Zhang, “A quantitative method for evaluating the performances of hyperspectral image fusion,” IEEE Transactions on Instrumentation and Measurement, vol. 52, no. 4, pp. 1041–1047, 2003.
[22] Q. Wang, Y. Shen, and Y. Zhang, “A fast method to evaluate the performances of image fusion techniques and its error anal-ysis,” inProceedings of the Instrumentation and Measurement Technology Conference (IMTC ’03), vol. 1, pp. 823–826, May 2003.
[23] I. Parcharidis and L. M. Kazi-Tani, “Landsat TM and ERS data fusion: a statistical approach evaluation for four different methods,” inProceedings of the International Geoscience and Remote Sensing Symposium (IGARSS ’02), vol. 5, pp. 2120– 2122, July 2000.
[24] S. Muhammad, M. Wachowicz, and L. M. T. de Carvalho, “Evaluation of wavelet transform algorithms for multi-resolution image fusion,” inProceedings of the 5th International Conference on Information Fusion (FUSION ’02), vol. 2, pp. 1573–1580, 2002.