IMPROVEMENT OF INTEGRAL MEMBRANE PROTEIN
EXPRESSION VIA OPTIMIZATION OF SIMULATED INTEGRATION
EFFICIENCY
Thesis by
Stephen Sandell Marshall
In Partial Fulfillment of the Requirements for
the Degree of
Doctor of Philosophy
CALIFORNIA INSTITUTE OF TECHNOLOGY
Pasadena, California
2018
© 2017
Stephen Marshall
ACKNOWLEDGEMENTS
Outside of the Clemons lab, Dr. Khalid Salaita and the members of his group at
Emory University, most notably Dr. Daniel Stabley, were highly influential in my training
and my acceptance to Caltech. Dr. Tom Miller and Michiel Niesen have been amazing
collaborators and my research would not be possible without their input. The work we have
collectively produced represents the result of many hours of discussion and numerous
rewrites. The members of my committee, Dr. Shu-ou Shan, Dr. Bil Clemons, Dr. Tom
Miller, and Dr. Steve Mayo, have provided me with extremely valuable advice during my
annual meetings. I appreciate them taking time out of their busy schedules to listen to my
presentations.
Within the Clemons lab, I would especially like to thank Dr. Bil Clemons for
providing me the opportunity to work in his lab and supporting me over the last five years.
He has been both a mentor and friend, helping me develop as a researcher, writer, and
speaker. Dr. Axel Muller was instrumental in establishing the subgroup I work in and
teaching me during my first year. Shyam Saladi helped immensely with analyzing my data
and writing code. All other current and former members of the Clemons lab over the years
have contributed to my progress. Arun Chandra, Anthony Jones, and Omoshola Aleru
worked with me during the summer quarters and were all exemplary volunteers with
admirable work ethics and strong intellects.
In my personal life, both my immediate and new in-law families have been
extremely supportive during my time at Caltech. My dog Charles has greeted me eagerly
ever day as I come home. Most importantly, my new wife Jen has been with me throughout
researcher and as a person. Our time together in Pasadena has been unforgettable and I
ABSTRACT
Integral membrane protein characterization is limited by the low levels of protein
obtainable from heterologous overexpression in hosts such as Escherichia coli. Differences
in the efficiencies of subdomains of the co-translational integration processes of membrane
proteins into the membrane could explain the observed variation in the experimental
expression of closely related homologs in E. coli. We have developed a method to predict
and increase the expression of individual membrane proteins by optimizing the efficiency
of their translocon-mediated integration into the membrane. The integration efficiency of
each component of a membrane protein is calculated using a coarse-grained
co-translational simulated integration model. The results of model simulations, experimental
expression levels quantified by integral membrane protein-GFP fusion fluorescence, and a
novel antibiotic survival test that reports on misintegration in vivo are applied to test the relationship between the integration efficiency of specific domains and experimental
expression. Changes in simulated integration efficiencies due to sequence modifications
agree with the effects on experimental expression in vivo. In the case of the TatC protein
family, misintegration of the C-tail is found to be a major contributor to expression failure
in E. coli. Beneficial sequence modifications that improve both simulated integration efficiency and experimental expression levels can be identified using the model.
Preliminary evidence shows that simulated integration efficiency could potentially predict
the effects of mutations on Haemophilus influenzae GlpG experimental expression in E.
coli. The process described herein allows for the rational overexpression of integral membrane proteins through the identification and mitigation of inefficiencies in the
PUBLISHED CONTENT AND CONTRIBUTIONS
Stephen S. Marshall*, Michiel J. M. Niesen*, Axel Müller, Katrin Tiemann, Shyam M.
Saladi, Rachel P. Galimidi, Bin Zhang, William M. Clemons, Jr., and Thomas F. Miller,
III. A Link between Integral Membrane Protein Expression and Simulated Integration Efficiency. Cell Reports, 2016. 16(8): p. 2169-2177. doi: 10.1016/j.celrep.2016.07.042
*Stephen S. Marshall and Michiel J.M. Niesen are co-first authors.
Stephen S. Marshall designed the research, performed expression and survival assay
TABLE OF CONTENTS
Integral Membrane Proteins Are Important Research Targets ………….………...1
Membrane Protein Biogenesis in E. coli………...…2
The Membrane Protein Expression Problem………..…..4
Chapter 2: A Link Between Integral Membrane Protein Expression and Simulated Integration Efficiency for TatC C-Tail Mutants……….………8
Chapter 3: A Link Between Integral Membrane Protein and Simulated Integration Efficiency of the C-tail for an Expanded Pool of TatC Mutants………....41
Abstract………..41
Chapter 4: Application of Simulated Integration Efficiency to the Prediction of Error-Prone Mutant Haemophilus influenzae GlpG Experimental Expression…….70
LIST OF FIGURES AND TABLES
Chapter 2
Figure 2.1: Variation in the Expression of TatC Homologs in E. coli………11
Figure 2.2: Validation of Expression of TatC Variants in E. coli………...13
Figure 2.3: Effect of the C-tail on TatC Expression in E. coli………...14
Figure 2.4: Simulated Integration Efficiencies Among All Loops TatC Wild-types and Aa- tail Chimeras……….. 17
Figure 2.5: Calculation of TatC Integration Efficiencies………...19
Figure 2.6: Correlation of Antibiotic Resistance to Membrane Topology………22
Figure 2.7: Mechanistic Basis Associated with Charged C-tail Residues……….24
Figure 2.8: M. smegmatis Expression Tests………...…...26
Table 2.1: Loop Definitions Used in Simulation Trajectory Analysis………...40
Chapter 3
Figure 3.1: TatC Loop-Swap Chimeras Demonstrate a Range of Expression Outcomes...45Figure 3.2: TatC Transmembrane and Loop Domain Definitions ……….47
Figure 3.3: C-Tail Localization Is Predictive of Experimental Expression Outcome …..49
Figure 3.4: Effects of Sequence Modifications on Simulated Integration and Experimental Expression Are Nearly Independent ………..53
Figure 3.5: Simulated Integration Efficiency of the C-Tail Is the Only Topology Feature That Is Predictive of Experimental Expression for TatC ………...56
Figure 3.6: Topology Features Predictive of Expression Can Be Determined Based on Limited Training Data ………...60
Chapter 4
Figure 4.1: HiGlpG Experimental Expression………...73Figure 4.2: Correlation Between Expression Improvement and Wild-type Expression Levels for TatC………...75
C h a p t e r 1
INTRODUCTION
Integral Membrane Proteins Are Important Research Targets
Integral membrane proteins (IMP) act as key relays between the interior and
exterior of a cellular or subcellular environment, facilitating the passage of information,
cargo, and energy. They represent approximately 26% of human genes and 60% of current
drug targets [1, 2]. Though IMPs are attractive targets for structural characterization, they
represent only 2% of structures deposited in the PDB [3]. A major contributor to the limited
number of membrane protein structures is the difficulty in obtaining sufficient amounts
from heterologous overexpression.
There are two types of IMPs found in bacteria: alpha helical membrane proteins
that reside in the inner membrane and beta barrel membrane proteins found in the outer
membrane [4]. They have distinct structural motifs and biogenesis pathways and inhabit
different subcellular environments. The majority of polytopic alpha helical membrane
proteins integrate into the inner membrane with assistance of the translocon, while beta
barrel proteins are translocated across the inner membrane through the translocon to be
inserted in the outer membrane. Hereafter, IMPs will be used to indicate only polytopic
alpha helical membrane proteins.
The domains that make up an IMP can be categorized as either loop or
transmembrane domains (TMD). TMDs are alpha helices that reside within the membrane
and are enriched in hydrophobic residues. In contrast, loop domains are found in the
natures of these domains contribute to the delivery and final fold of the IMP through their
interactions with processing machinery including the SRP and the translocon.
Membrane Protein Biogenesis in Escherichia coli
A key hypothesis made here is that the integration efficiency of an IMP directly
affects its expression levels in E. coli. Experimental expression represents the amount of
protein that is translated and properly folded within the inner membrane. IMP biogenesis
requires the placement of the constituent loops and TMDs with the correct orientation
relative to the membrane. Ribosomes translating IMPs in bacteria are targeted to the
translocon in the inner membrane via interaction with the signal recognition particle (SRP)
and its receptor (SR) [5, 6]. The SRP recognizes a hydrophobic signal sequence on a
nascent IMP early in its translation. Contact of an SRP with the SR leads to the handoff of
the ribosome-nascent chain complex to the translocon. At the core of the translocon is the
SecYEG complex, a channel with a unique structure, containing both a pore that can allow
passage of substrates across the membrane and a lateral gate that can open to allow cargo
within the channel to directly interact with and insert into the membrane [7-10]. The
translocon aids in the integration of the TMDs into the membrane by the opening of its
lateral gate when a TMD is within the channel, facilitating passage of the TMD into the
membrane. Loop domains are either translocated through the channel into the periplasm or
retained in the cytoplasm by passing through a space between the translocon and the
ribosome.
It is important to note that the targeting and integration of IMPs usually occurs
ribosome to interact with the SRP and translocon [6, 7]. Therefore, it is sequentially early
hydrophobic domains that interact with the SRP [5, 6]. As well, the translocon is proposed
to integrate TMDs soon after their emergence from the exit tunnel such that TMDs are
integrated into the membrane in their order on the primary sequence of the IMP (i.e. TMD
1 integrates first, TMD 2 integrates second, etc.) [10-12]. Notable exceptions to the
co-translational and sequential model of IMP integration have been found, including examples
of large-scale reorientation of IMP domains [13-15].
The establishment of the correct topology is important for the proper folding and
function of an IMP integrated by the translocon and is influenced by the biophysical
characteristics of the nascent chain. The topology of an IMP refers to the orientation of the
TMD and loop domains with respect to the cytoplasm. For example, an IMP with three
TMDs and four loops can be integrated with two orientations: the N-terminal loop in the
cytoplasm and the C-terminal loop in the periplasm or the N-terminal loop in the periplasm
and the C-terminal loop in the cytoplasm. Interactions between the nascent chain, the
translocon, and the surrounding microenvironment are key to establishing topology. Two
of the most prominent features of the nascent chain that contribute to topogenesis are the
hydrophobicity of the TMDs and the distribution of positive charges on cytoplasmic and
periplasmic loops. The hydrophobicity of a TMD correlates with its membrane insertion
efficiency [10, 16]. Cytoplasmic loops are highly enriched in positively charged residues
as compared to periplasmic loops [17]. Changing the placement of positively charges along
the IMP sequence can affect the final topology of the IMP [14, 18, 19]. A failure to establish
the correct topology due to low integration efficiency prevents proper folding and function
In the studies described here, the process of the orientation of a loop domain
through interaction with the translocon to establish topology is referred to as its integration.
Misintegration indicates improper retention or translocation of a loop, ending with its
placement in the incorrect subcellular location. Integration efficiency of a loop or TMD
represents the proportion of IMPs expressed with the domains in the correct location after
interaction with the translocon has ended. Optimization of the integration efficiency
through modification of loops or TMDs provides a method of improving expression of an
initially inefficiently integrated IMP.
The Membrane Protein Expression Problem
Heterologous expression levels of IMPs in E. coli are often insufficient for characterization by structural or biochemical methods, requiring researchers studying a
specific protein to test a number of homologs until one provides sufficient yields, often
encountering widely different expression values even among closely related proteins with
high sequence homology [21-23]. The hydrophobic stretches that make up the TMDs are
unstable and prone to aggregation outside of the membrane from which they cannot be
easily refolded, and overexpression of IMPs is often toxic and can inhibit cell replication
and lead to less final cell mass [24]. These issues contribute to the significant time and
resource costs associated with the study of IMPs [20].
One of the methods developed to increase the throughput of IMP expression
quantification involves the addition of a C-terminal GFP to the IMP coding sequence [25,
26]. Fluorescence levels from IMP-GFP fusions have been found to correlate strongly with
fluorescence of GFP molecules in the whole cell, in the cell lysate, or on a band on an
SDS-PAGE gel can be used to quantify expression without IMP purification. The use of
C-terminal GFP fusions greatly increases the number of IMPs that can be tested for
expression yield.
There is no universally successful method for improving IMP expression and many
of the strategies do not identify the cellular mechanism of the initial expression failure. An
analysis of a large-scale expression trial of Escherichia coli IMP-GFP fusions was unable
to identify a single feature that significantly correlated with expression yield [31].
Strategies for improving IMP expression in E. coli can be classified as either, (a), a modification of the IMP nucleotide and/or amino acid sequence to optimize its processing
by the cellular machinery, or, (b), a change to the organism in which the IMP is
overexpressed to improve the efficiency of the biogenesis pathway. In regard to (a),
performing error-prone PCR to find mutations that increase stability and yield have been
applied with some success [32, 33]. In the case of (b), one of the most successful and widely
adapted methods for improving IMP expression involves reducing the amount of mRNA
of the non-native IMP produced in the cell, which suggests that higher levels in some way
overload the normal capacity for producing IMPs [34, 35]. Given the complex biogenesis
process IMPs must undergo that is not required for soluble protein expression, inefficiency
within the pathway is a likely contributor to poor expression. Both of these methods do not
identify the source of expression failure. Researchers would benefit from an approach that
would allow for improvement in expression through the understanding and improvement
A coarse-grained molecular dynamics simulation model of translocon-facilitated
integration of IMPs (CG model) provides a view of IMP integration and can be used to
identify the source of expression failure [36]. The CG model is derived from over 16 µs of
molecular dynamics simulations of the translocon, membrane bilayer, and a substrate
sequence. The simplified, coarse-grained nature of the model allows for a large number of
simulations over biologically relevant timescales to assess the efficiency of the integration
process for an IMP and the domains thereof. The proportion of CG model trajectories that
terminate with a domain in the correct topological location provides a measure of the
efficiency with which it is oriented by the translocon with the correct final topology
(simulated integration efficiency). Use of the CG model allows for understanding the
underlying mechanism that leads to observed experimental results due to interactions of
the nascent IMP with the membrane-translocon-ribosome environment.
The concept explored in later chapters is that the amount of folded, recoverable
protein following the overexpression of an IMP in E. coli is directly influenced by the integration efficiency of individual domains and can be predicted by simulated integration
efficiency calculated using the CG model. In Chapter 2, expression tests of TatC sequences
with mutations limited to the tail demonstrate that the integration efficiency of the
C-terminal loop (C-tail) is a key predictor of experimental expression as misintegration of the
C-tail contributes to the poor expression of some TatCs, confirmed using an in vivo ampicillin assay. The effect of C-tail sequence changes on experimentally observed
expression levels strongly correlates with the simulated integration efficiency obtained
from the CG model. Likewise, mutations that improve the simulated integration efficiency
expanded to attempt the prediction of the effect of sequence modifications of any loop of
TatC. Simulated integration efficiencies, calculated using a coarse-grained simulation
approach, robustly predict expression for a set of 140 sequence modifications on TatC
homologs, including loop-swap chimeras and single-residue mutations distributed over
much of the protein sequence. The simulated integration efficiency and experimental
expression of double-loop-swap chimeras is shown to be multiplicative and largely
independent with respect to the component single-swap mutations. The evidence again
indicates misintegration of the TatC C-tail is a factor in cases poor expression and mutation
of the IMP sequence far from the C-terminus can improve the integration efficiency of the
C-tail. In Chapter 4, a library of mutated Haemophilus influenzae (Hi) GlpG sequences is
created using error-prone PCR and tested for experimental expression levels. HiGlpG contains loop domains with simulated integration efficiencies that could be predictive of
experimental expression improvement. The combined studies demonstrate that
experimental expression of IMPs can be improved by using sequence modification to
manipulate the integration efficiency of specific subdomains and these effects can be
predicted by analyzing CG model simulations of the co-translational integration process.
Future development and testing of the strategy will aim to broaden the applicability and
C h a p t e r 2
A LINK BETWEEN INTEGRAL MEMBRANE PROTEIN EXPRESSION
AND SIMULATED INTEGRATION EFFICIENCY FOR TATC C-TAIL
MUTANTS
Adapted from Stephen S. Marshall*, Michiel J. M. Niesen*, Axel Müller, Katrin Tiemann, Shyam M. Saladi, Rachel P. Galimidi, Bin Zhang, William M. Clemons, Jr., and Thomas F. Miller, III. A Link between Integral Membrane Protein Expression and Simulated Integration Efficiency. Cell Reports, 2016. 16(8): p. 2169-2177. doi: 10.1016/j.celrep.2016.07.042
*Stephen S. Marshall and Michiel J.M. Niesen are co-first authors.
Abstract
Integral membrane proteins control the flow of information and nutrients across
cell membranes, yet mechanistic studies of membrane proteins are hindered by difficulties
in expression. We investigate this issue by addressing the connection between membrane
protein sequence and observed expression levels. For homologs of the integral membrane
protein TatC, observed expression levels vary widely and are affected by small changes in
protein sequence. The effect of sequence changes on experimentally observed expression
levels strongly correlates with the simulated integration efficiency obtained from
coarse-grained modeling, which is directly confirmed using an in vivo assay. Furthermore, mutations that improve the simulated integration efficiency likewise increase the
experimentally observed expression levels. Demonstration of these trends in both
Escherichia coli and Mycobacterium smegmatis suggests that the results are general to other expression systems. This work suggests that integral membrane protein integration
is a determinant for successful expression, raising the possibility of controlling expression
Introduction
The central role of integral membrane proteins (IMPs) in many biological functions
motivates structural and biophysical studies that require large amounts of purified protein,
often at considerable costs in terms of both materials and labor. A key obstacle is that only
a small percentage of IMPs can be overexpressed (i.e., heterologously produced at levels
conducive to further study) [23]. While extensive efforts have shown promising results for
individual IMPs, including those focusing on expression conditions, host modification, and
directed evolution [35, 37, 38], none of these has proven broadly applicable, even among
homologs of a given IMP. In general, the determinants for IMP expression are poorly
understood, leading to the prevailing opinion that problems in membrane protein
expression must be addressed on a case-by-case basis.
Closely related IMP homologs can vary dramatically in the amount of protein
available after expression [23], which raises a fundamental question: what differentiates
the expression of IMP homologs? The hypothesis raised here is that the efficiency with
which an IMP is integrated into the membrane is a key determinant in the degree of
observed IMP expression.
A fundamental step in the biosynthesis of most IMPs involves their targeting to and
integration into the membrane via the Sec protein translocation channel [7]. Integration of
IMP transmembrane domains (TMDs) into the membrane is facilitated primarily through
interaction between the nascent chain and SecY, which forms the core of the protein
translocation complex, or translocon. Following the co-translational or post-translational
insertion of nascent protein sequences into the translocon channel, hydrophobic segments
TMD hydrophobicity [10, 16] and loop charge [17, 39] have been shown to affect the
efficiency of TMD integration and topogenesis. For example, TMD hydrophobicity is
directly related to the probability with which TMDs partition into the lipid bilayer, while
positively charged residues in the loop alter TMD orientation by preferentially occupying
the cytosol [10, 17, 39].
In this study, we investigated the connection between observed IMP expression
levels and Sec-facilitated IMP integration efficiency (i.e., the probability of membrane
integration with the correct multi-spanning topology). Systematic investigation of chimeras
within an IMP family led to the identification of sequence elements that modulate
expression levels. In silico modeling of IMP integration at the Sec translocation channel
found that the sequence modifications that increase the calculated IMP integration
efficiency correlate with in vivo overexpression improvements, suggesting that IMP integration efficiency is a determinant for successful expression. The result was found to
be general across distinct expression systems (E. coli and M. smegmatis). Furthermore, an
in vivo assay based on antibiotic resistance in E. coli experimentally confirmed the model that the integration efficiency of an individual TMD correlates with the observed IMP
expression levels. The strong link between the effects of sequence modifications on
simulated integration efficiency and experimentally measured expression levels offers
Results
As a detailed case study, the TatC IMP family was employed for all experimental
and computational results reported here. A component of the bacterial twin-arginine
translocation pathway, TatC plays a key role in the transport of folded proteins across the
cytoplasmic membrane [40]. The employment of TatC was well suited for this study as it
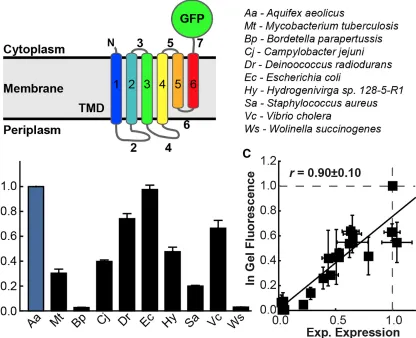
is reasonably sized (only six TMDs; Figure 2.1A), non-essential, and found broadly
throughout bacteria; furthermore, TatC homologs previously have been observed to exhibit
widely varying expression levels in E. coli [41], suggesting the importance of
sequence-level details in the expression of this IMP.
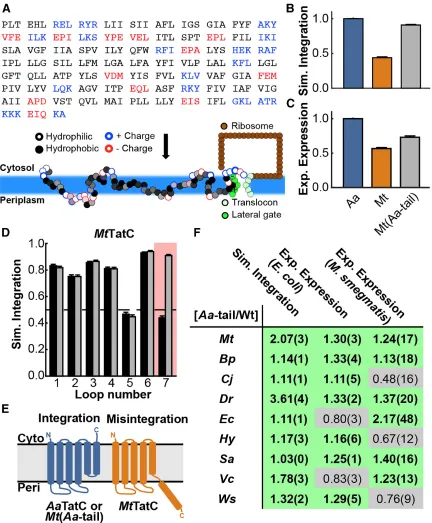
expression levels normalized to AaTatC (blue). Error bars indicate the standard errors of the mean.
Wild-Type and Chimeric TatC Expression in E. coli
We first demonstrated that homologs of the IMP TatC exhibit large variance in
observed expression levels in E. coli. For a quantitative measure of IMP expression, we employed a C-terminal fusion tag of a GFP variant [42] (Figure 2.1A) and measured
whole-cell fluorescence by flow cytometry. Whole-whole-cell fluorescence intensity of this fusion tag
has been validated in numerous previous studies to correlate strongly with the amount of
folded IMP, rather than the total level of IMP translated [26-31]. We further validated the
expression levels measured from whole-cell fluorescence (Figure 2.1B) using in-gel
fluorescence (Figures 2.1C, 2.2B, and 2.2C; Pearson correlation coefficient, r = 0.9) and
western blot analysis (Figure 2.2A). With this approach, expression levels in E. coli were
experimentally measured for TatC homologs from a variety of bacteria, including Aquifex
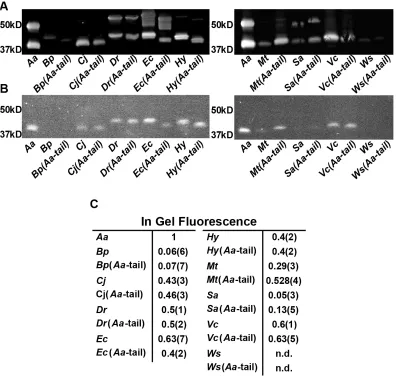
Figure 2.2: Validation of Expression of TatC Variants in E. coli. (A) Anti-GFP western blot results for TatC homologs and the corresponding Aa-tail swap chimeras. Two bands were observed for all lanes where TatC-GFP was at high relative concentrations with the lower bands active by in-gel fluorescence and therefore determined to be folded protein. (Waldo et al., 1999) (B) In-gel fluorescence of SDS-PAGE for TatC homologs and the corresponding Aa-tail swap chimeras. Bands that exhibit fluorescence represent folded protein. The results exhibit the same trends in expression yield as seen by flow-cytometry. (C) Average in-gel fluorescence quantified across four separate gels. Ws and Ws(Aa-tail) could not be detected (n.d.) by in-gel fluorescence. Values for each band are normalized to the AaTatC band and values in parentheses indicate the standard error of mean.
Figure 2.1B shows the wide range of expression levels that are exhibited by the
referred to as MtTatC(Wt-tail), and a modified sequence truncating the un-conserved
38-residue sequence of the C-terminal loop, hereafter referred to as MtTatC [41].
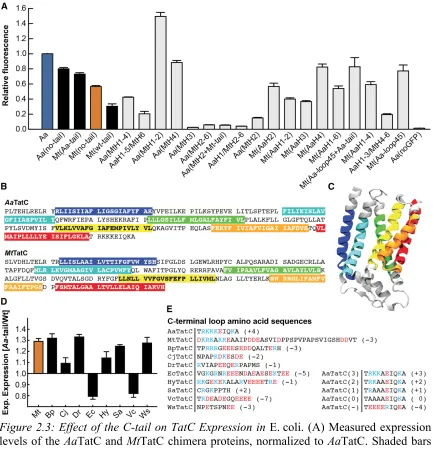
To examine the parts of the protein sequence that affect expression, swap chimeras
were generated by exchanging entire loops and TMDs between AaTatC and MtTatC. The
TMDs and loops were defined by comparing sequence alignments and membrane topology
predictions (Figure 2.3B) [44, 45]. The swap chimeras exhibited a wide range of expression
results (Figure 2.3A). The C-terminal loop sequence, referred to as the C-tail and labeled
as loop 7 in Figure 2.1A, was found to have a significant effect on expression levels (shaded
bars in Figure 2.3A). Removal of the MtTatC C-tail improved expression. Removal of the
C-tail from the AaTatC sequence led to a corresponding decrease in expression. Strikingly,
swapping the AaTatC C-tail (Aa-tail) into the MtTatC sequence led to a significant improvement in expression.
The positive effect of the Aa-tail on MtTatC expression raises the question of whether expression can be similarly improved in other TatC homologs by substituting the
corresponding C-tail sequence (Figure 2.3E) with that of AaTatC. Swapping the C-tail of
the various TatC homologs with the Aa-tail improved expression in seven of nine cases
(Figure 2.3D). Taken together, the results in Figure 2.3 indicate that the C-tail is a
significant factor in determining TatC expression across homologs.
In Silico Modeling of TatC Integration
To investigate the mechanistic basis for the experimentally observed effect of the
C-tail on expression, we employed a recently developed in silico coarse-grained (CG) approach that models co-translational translocation on unbiased biological timescales [36].
The CG model, which is derived from >16 µs of molecular dynamics simulations of the
validated for the description of Sec-facilitated membrane integration, including
experimentally observed effects of amino acid sequence on the membrane topology of
single-spanning IMPs [36] and multi-spanning dual-topology proteins [18]. IMP sequences
were mapped onto a Brownian dynamics model of the ribosome/translocation
channel/nascent protein system, and the Sec translocon-facilitated integration of the IMP
into the lipid bilayer was directly simulated in 1,200 independent minute-timescale
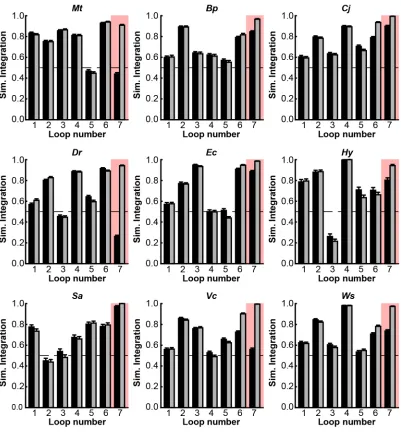
trajectories for each TatC (Figure 2.4; Figure 2.5A). This implementation of the CG model
Figure 2.4: Simulated Integration Efficiencies Among All Loops TatC Wild-types and Aa-tail Chimeras. For each considered TatC homolog, the simulated integration efficiency for the individual loops for both the wild-type sequence (black bars) and the Aa-tail chimeras (grey bars). It is seen that the Aa-tail generally leads to a significant effect on the integration efficiency of loop 7 (highlighted), with smaller effects on the other loops. Error bars indicate the standard error of mean.
Using the results of the CG model, Figure 2.5B presents the simulated integration
efficiency, defined to be the fraction of trajectories that led to the correct membrane
topology in terms of the final orientation of the C-tail. The AaTatC homolog exhibited significantly higher simulated integration efficiency than the MtTatC homolog, which is
consistent with the relative experimental expression levels for the two homologs in Figure
2.5C. Figure 2.5B shows that the Mt(Aa-tail) chimera recovered the high levels of simulated integration efficiency seen for the AaTatC homolog, further mirroring the experimental trends in IMP expression (Figure 2.5C). Figure 2.5D presents an analysis of
the orientation of each loop, indicating that only loop 7 was significantly affected swapping
the C-tail in the simulations. As is shown schematically in Figure 2.5E, the simulations
found that MtTatC exhibits a large fraction of trajectories in which the C-tail resides in the
periplasm, such that the C-terminal TMD (TMD 6) fails to correctly integrate into the
for individual loops of both the wild-type MtTatC sequence (black bars) and the Aa-tail swap chimera (gray bars), with loop 7 highlighted, is shown. Error bars indicate the standard errors of the mean. (E) Schematic of the correct and incorrect TatC topologies observed in the simulations. Misintegration of loop 7 and translocation of TMD 6 lead to an incorrect final topology for MtTatC. (F) For each homolog, comparison between the experimental expression levels in E. coli and M. smegmatis and the simulated integration efficiencies, reporting the ratio of the Aa-tail chimera result to that of the corresponding wild-type sequence. Ratios exceeding unity are highlighted in green, indicating enhancement due to the Aa-tail. Values in parentheses indicate the standard errors of the mean.
Additional simulations were performed for the full set of the experimentally
characterized TatC homologs (Figures 2.4 and 2.5F), allowing comparison of the
computationally predicted shifts in IMP integration with those observed experimentally for
IMP expression. For each homolog, Figure 2.5F compares the effect of swapping the
wild-type C-tail with the Aa-tail on both the experimental expression level and the simulated integration efficiency. With the exception of VcTatC and EcTatC, Figure 2.5F shows consistent agreement between the computational and experimental results in E. coli upon
introducing the Aa-tail.
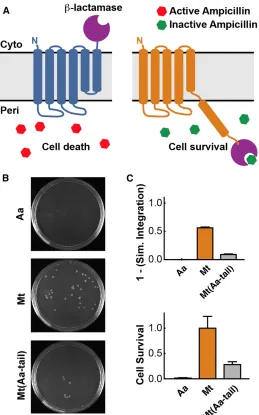
Confirmation of the Predicted Mechanism Using a Translocation Assay
The comparison between simulation and experiment in the previous sections
suggests a mechanism in which translocation of the C-tail of TatC into the periplasm leads
to a reduction in the observed expression level. To validate this, an experimental in vivo assay based on antibiotic resistance in E. coli was employed. The C-terminal GFP tag was
replaced by β-lactamase, such that an incorrectly oriented C-tail would confer increased
resistance to β-lactam antibiotics (Figure 2.6A); an inverse correlation between antibiotic
constructs containing the β-lactamase tag were expressed using the same protocol as
before. Following expression, the cells were diluted to an optical density 600 (OD600) of
0.1 in fresh media without inducing agent, and they were grown to an OD600 of ∼0.5 at
which point ampicillin was added. Then 1.5 hours after ampicillin treatment, equal amounts
of the media were plated on Luria-Bertani (LB) agar plates without ampicillin (Figure
2.6B). The number of observed colonies was used to quantify the relative cell survival
(Figure 2.6C, bottom). The survival rate of Mt(Aa-tail), Mt, and AaTatC inversely correlated with the simulated integration efficiency of the C-tail (Figure 2.6C), validating
Tail Charge as an Expression Determinant: Experimental Tests of Computational
Predictions
To further establish the connection between the simulated integration efficiencies
and the experimentally observed expression levels, we examined the effect of C-tail
mutations. We focused on modifications of the C-tail amino acid sequences that involve
the introduction or removal of charged residues, which are known to affect IMP topology
and stop-transfer efficiency [14, 36, 39].
We began by investigating the generic effect of the C-tail charge magnitude on
TatC-simulated integration efficiency. Figure 2.7A presents the results of CG simulations
in which the magnitude of the charges on the C-tail of the Mt(Aa-tail) sequence were scaled
by a multiplicative factor, χ, keeping all other aspects of the protein sequence unchanged.
The simulations revealed that reducing the charge magnitude on the C-tail led to lower
simulated integration efficiency.
To examine the corresponding effect of C-tail charge magnitude on expression
levels, Figure 2.7B plots the ratio of experimentally observed expression for each
wild-type homolog relative to its corresponding Aa-tail swap chimera versus the total charge magnitude on the type C-tail. Without exception in these data, the expression of
wild-type homologs with weakly charged C-tails (relative to the Aa-tail) was improved upon swapping with the Aa-tail, whereas the expression of homologs with strongly charged
C-tails was reduced upon swapping with the Aa-tail (i.e., all data points in Figure 2.7B fall
Figure 2.7 Mechanistic Basis Associated with Charged C-tail Residues. (A) Simulated integration efficiency of the Mt(Aa-tail) chimera, as a function of scaling the charges of the C-tail residues, is shown. (B) Correlation of the ratio of the measured expression for the Aa-tail swap chimeras to that of the corresponding wild-type sequence versus the charge magnitude of the wild-type C-tail (data from Figure 2.3E). (Pearson correlation coefficient of r = 0.8 ± 0.2) (C) Correlation of the ratio of the measured expression for the Aa-tail(−) swap chimeras to that of the corresponding wild-type sequence versus the charge magnitude of the wild-type C-tail, where the Aa-tail(−) swap chimeras include a variant of the Aa-tail with net negative charge and the same overall charge magnitude, is shown. (D) Experimental expression levels in E. coli (blue, left axis) and simulated integration efficiency (black, right axis) for a series of mutants of the Mt(Aa-tail) sequence, in which positively charged residues in the Aa-tail are mutated to alanine residues. Reported values are normalized to Mt(Aa-tail). (E) Relative ampicillin survival rate in E. coli (red, left axis) and simulated integration efficiency (black, right axis) for a series of mutants of the Mt(Aa-tail) sequence, in which positively charged residues in the Aa-tail are mutated to alanine residues. Simulation results are normalized as in (D), while ampicillin survival is normalized to the highest survival rate (i.e., with zero charge magnitude). Error bars indicate the standard errors of the mean.
Figure 2.7C further illustrates the effect of charge magnitude on expression by
which the introduced C-tail sequence preserved the charge magnitude of the Aa-tail sequence while reversing the net charge (see Figure 2.3E for the C-tail sequences). Despite
the complete reversal of the C-tail charge, the observed correlation between expression and
C-tail charge magnitude for these two sets of chimeras was strikingly similar (compare
Figures 1.7B and 1.7C).
Finally, we considered a series of mutants of the Mt(Aa-tail) chimera, in which the
charge magnitude of the Aa-tail was reduced by mutating positively charged residues to alanine residues (see Figure 2.3E for the C-tail sequences). For this series of mutants,
Figure 2.7D (black) shows that the simulated integration efficiency decreased with the
charge of the C-tail, which predicted a corresponding decrease in the experimental
expression levels; indeed, the subsequent experimental measurements confirmed the
predicted trend (Figure 2.7D, blue). Again using the antibiotic resistance assay to validate
the connection between simulated integration efficiency and observed expression, Figure
2.7E confirms that the simulation results correlated with the relative survival of the
Mt(Aa-tail) alanine mutants with a β-lactamase tag (Figure 2.7E, red). In addition to providing
evidence for the connection between simulated integration efficiency and observed
expression levels, the results in Figure 2.7 suggest that this link can be used to control IMP
expression.
Transferability to M. smegmatis
Beyond the E. coli overexpression host, we examined the transferability of the relation between simulated integration efficiency and experimental expression levels. We
distinct from E. coli. All coding sequences were transferred into an inducible M. smegmatis
vector, including the linker and C-terminal GFP, and expressed; expression levels were
then measured by flow cytometry and validated by western blot.
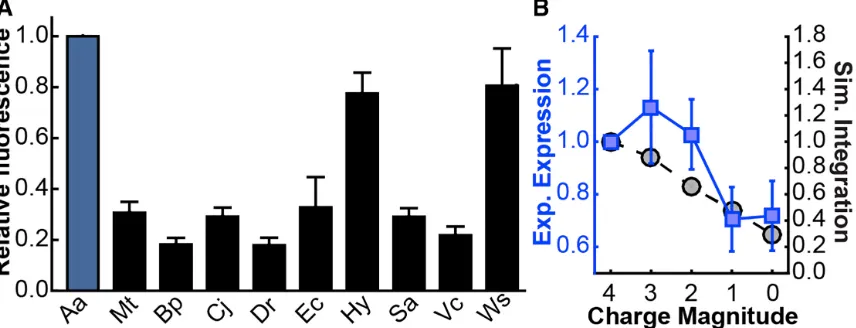
Figure 2.8: M. smegmatis Expression Tests. (A) Expression levels of various TatC homologs in M. smegmatis were measured by TatC-GFP fluorescence, with expression levels normalized to AaTatC (blue). (B) Simulated integration efficiency (blue, left axis) and measured expression levels in M. smegmatis (black, right axis) for a series of mutants of the Mt(Aa-tail) sequence, in which positively charged residues in the Aa-tail are mutated to alanine residues. Error bars indicate the standard errors of the mean.
Figure 2.8A shows that, as in E. coli, the experimentally observed expression levels
vary widely among the wild-type TatC homologs in M. smegmatis. However, comparison
of Figure 2.8A with Figure 2.1B reveals that the total expression levels for the homologs
in M. smegmatis are different from those seen in E. coli, although for both systems the AaTatC homolog expresses strongly and MtTatC expresses poorly (which is perhaps surprising, given the close evolutionary link between M. smegmatis and M. tuberculosis).
Figure 2.5F also shows that replacing the wild-type C-tail with the Aa-tail in M. smegmatis
generally increased the experimentally observed expression levels, in general agreement
(six of nine homologs) with the previously discussed simulated integration efficiency
Figure 2.5F further shows that the subset of homologs, for which the Aa-tail swap
chimeras led to increased levels of expression in M. smegmatis, was overlapping but different from the subset associated with the E. coli results. This emphasizes that, although
the computed levels of simulated integration efficiency agree with the observed changes in
expression levels in both expression systems, the observed expression levels depend on the
expression system, while the simulated integration efficiencies calculated using the current
implementation of the CG model are independent of the expression system. In short,
simulated integration efficiency is a predictor of the expression levels in both systems, but
it is not the only factor contributing to the observed expression levels.
Continuing with the M. smegmatis expression system, Figure 2.8B repeats the comparison between the simulated integration efficiency and the observed expression
levels for the series of mutants of the Mt(Aa-tail) chimera, in which the positive charge of
the Aa-tail was reduced by mutating positively charged residues to alanine residues. The simulated integration efficiencies, identical to those in Figure 2.7D, were predicted to
decrease as charges were removed. The experimental expression levels for M. smegmatis
in Figure 2.8B likewise showed a decrease. Taken together, the results obtained for the M.
Discussion
The mechanistic picture that emerges from the experimental and theoretical
analysis of the TatC IMP family is that the efficiency of Sec-facilitated membrane
integration, which is impacted by the IMP amino acid sequence, is a key determinant in
the degree of observed protein expression. We observed that TatC homologs had varying
levels of expression (Figures 2.1B and 2.8A). Swap chimeras between AaTatC and MtTatC
revealed a significant effect of the C-tail in determining expression yields (Figure 2.3A),
with the Aa-tail having a largely positive effect that was transferrable to other homologs
(Figure 2.3F). CG modeling predicted a large, sequence-dependent variation of the
simulated integration efficiency for the C-tail (Figure 2.4), suggesting the underlying
mechanism by which the Aa-tail enhances the expression of other TatC homologs. Validation of this mechanism was experimentally demonstrated using an antibiotic
resistance assay (Figure 2.6). Additional point-charge mutations in the C-tail were shown
to change the simulated integration efficiency, which in turn predicted changes in the IMP
expression levels according to the proposed mechanism; these predictions were
experimentally confirmed in both E. coli (Figure 2.7) and M. smegmatis (Figure 2.8).
The observed correlation between IMP integration efficiency and observed
expression levels presented here is consistent with earlier observations that expression can
be modulated by mutations of the sequence [48-50], as well as recent work in which
misintegrated dual-topology IMPs were shown to be degraded by FtsH [13], However,
these earlier studies did not provide a clear mechanistic basis for the relation between IMP
sequence modifications and observed expression levels. In the current work, we
and we demonstrate a tractable CG approach for computing the simulated integration
efficiency and its changes upon sequence modifications. This work also raises the
possibility of using simulated integration efficiencies to optimize experimental expression
levels, which has been demonstrated here via the computational prediction and subsequent
experimental validation of individual charge mutations in the C-tail.
A few comments are worthwhile with regard to the scope of the conclusions drawn
here. First, our study focused on comparing protein expression levels among IMP
sequences that involve relatively localized changes, such as single mutations or loop-swap
chimeras, as opposed to predicting relative expression levels among dramatically different
IMP sequences. Second, our study examined experimental conditions for the
overexpression of IMPs using the same plasmids, which may be expected to isolate the role
of membrane integration in determining the relative expression levels of closely related
IMP sequences. The prediction of expression levels among IMPs that involve more
dramatic differences in sequence may well require the consideration of other factors,
beyond just the simulated integration efficiency. Moving forward, we expect that a useful
strategy will be to systematically combine the simulated IMP integration efficiency with
other sequence-based properties to predict IMP expression levels [31].
The experimental and computational tools used here are readily applicable to many
systems, potentially aiding the understanding and enhancement of IMP expression in many
other systems, as well as providing fundamental tools for the investigation of
co-translational IMP folding. By demonstrating inexpensive in silico methods for predicting
protein expression, we note the potential for computationally guided protein expression
Acknowledgements
I would personally like to thank all of the authors for their contributions. The
authors thank R.C. Van Lehn and D.C. Rees for comments on the manuscript and D. Daley
for helpful discussion of Daley et al. (2005)). Work in the W.M.C. lab is supported by an
NIH Pioneer Award to W.M.C. (5DP1GM105385) and an NIH training grant to S.S.M.
(NIH/National Research Service Award (NRSA) training grant 5T32GM07616). Work in
the T.F.M. group is supported in part by the Office of Naval Research
(N00014-10-1-0884), and computational resources were provided by the National Energy Research
Scientific Computing Center (NERSC), a (Department of Energy) DOE Office of Science
Methods
Designing and Cloning of TatC Chimeras
The parent plasmid used for cloning, pET28(a+)-GFP-ccdB, was derived from an
IMP-GFP vector used by [51]. TatC homologs and chimeras were prepared from genomic
DNA, with the exception of wild-type M. tuberculosis and A. aeolicus TatC genes that were synthesized by primer extension as applied in DNAWorks (NIH) [52]. In most cases,
the Gibson assembly cloning protocol was used for cloning [53]. Expression of a vector
containing AaTatC with an N-terminal ten-His tag and without the GFP fusion-tag was used as a negative control for in-gel fluorescence, western blot analysis and flow
cytometry. For constructs containing the β-lactamase tag, the GFP sequence was removed
and replaced with a β-lactamase sequence using Gibson cloning. For generation of M. smegmatis compatible plasmids, the entire coding region of the TatC homologs including the entire GFP sequence and the poly-His tag were PCR amplified out of their respective
pET28(a+)-GFP-ccdB vector using primers with compatible regions for placement into the
pMyNT vector using Gibson assembly [54]. For β-lactamase constructs, the GFP sequence
was replaced by a β-lactamase sequence using Gibson assembly.
E. coli Expression
Plasmids were transformed into BL21 Gold (DE3) cells and transferred onto LB
agar plates containing 50 µg/ml kanamycin plates after one-hour incubation. After
overnight incubation at 37°C, colonies were scraped off the plates into 5 mL of LB,
resuspended, and the OD600 was determined. These samples were then diluted into 50 mL
approximately 0.01. Cultures were grown in an orbital shaker at 37°C until they reached
an OD600 of 0.15. The temperature of the orbital shaker was then reduced to 16°C. Upon
reaching an OD600 of 0.3, IPTG was added to final concentration of 1mM to induce
expression. Cultures were grown for a further 16 hours prior to analysis.
β-Lactamase Survival Test
Plasmids containing the β-lactamase tag were expressed overnight at 16°C as
previously described. Cells from each overnight culture were washed with phosphate
buffered saline (PBS) to remove IPTG then diluted into fresh 50 mL 2xYT media
containing 50 µg/ml kanamycin to a starting OD600 of 0.1 in 125 mL baffled flasks.
Cultures were grown at 37°C to an OD600 of approximately 0.5 where a control sample
from each culture was taken, diluted 10,000 times in PBS, and 50 µL was plated onto LB
agar plates containing 50 µg/ml kanamycin. To each culture, 50 µg/ml ampicillin was
added and shaken at 37°C for a further 90 minutes. A sample from each culture was taken
and diluted 200 times in PBS, and 50 µL was plated onto LB agar plates containing 50
µg/ml kanamycin. Plates were grown overnight (~16 hours) and the number of colonies on
each plate was counted. Colony counts from the second plating were normalized by the
colony counts from the first plating to account for variation in the OD600 at which
ampicillin was added to determine relative survival. The procedure was performed in
triplicate and standard errors of normalized values were calculated. For each plot of relative
M. smegmatis Expression
For M. smegmatis overexpression, constructs were transformed into mc2155 cells
using electroporation and transferred onto Middlebrook 7H11 plates (10.25 g Middlebrook
7H11 Agar Base, 1 vial ADC growth supplement, 2.5 g glycerol, 1 mM CaCl2, 50 µg/mL
carbenicillin, 10 µg/mL cyclohexamide, 50 µg/mL hygromycin, and water to 500 mL) after
a three hour incubation in 1 mL Middlebrook 7H9 culture media (2.35 g Middlebrook 7H9
Broth Base, 1 vial ADC growth supplement, 0.5 g Tween-80, 1 mM CaCl2, 50 µg/mL
carbenicillin, 10 µg/mL cyclohexamide, and water to 500 mL). Plates were grown for three
to four days until colonies formed. Single colonies were picked into 5 mL Middlebrook
7H9 culture media containing 50 µg/mL hygromycin. The following day, 50 mL cultures
of Middlebrook 7H9 expression media (2.35 g Middlebrook 7H9 Broth Base, 0.25 g
Tween-80, 1 g glycerol, 1 g glucose, 1 mM CaCl2, 50 µg/mL carbenicillin, 10 µg/mL
cyclohexamide, 50 µg/mL hygromycin, and water to 500 mL) were inoculated at a starting
OD600 of 0.005. Cultures were grown at 37°C and expression was induced with 0.2%
acetamide at an OD600 of 0.5. Cultures were grown for six hours after induction prior to
analysis.
Flow Cytometry
A 200 µL sample of each expression culture was centrifuged at 4000g for 3 minutes
to pellet the cells and then the supernatant was removed. Cells were resuspended in 1 mL
of PBS and 200 µL of each were dispensed into 96-well plates and kept on ice for analysis.
Whole-cell GFP fluorescence was determined using a MACSQuant10 Analyzer. Forward
analysis. Measured events were gated based on the negative control sample to contain the
lowest 90% of both forward and side scattering values to remove anomalous particles, such
as dead or clumped cells. Mean cell fluorescence was calculated for the gated population
as a measure of folded TatC. At least four independent expression trials were performed
for each sequence tested to ascertain expression variance. Flow cytometry data analysis
was performed with FlowJo Software. Flow cytometry data is normalized to a standard for
each day data was collected. For example, for ‘Aa-tail/wild-type’ data points, the mean
fluorescence values of the Aa-tail swap chimeras were normalized by the mean fluorescence of their respective homologs containing the wild-type tail for that day’s trial.
Similarly, for relative fluorescence data points in which wild-type AaTatC was the standard, the mean fluorescence of each sample was normalized by the mean fluorescence
of the AaTatC sample for that day’s trial. In both cases, final calculated values are averages
of the normalized values over at least four trials with error bars representing standard errors
of the mean for those normalized values.
In-Gel Fluorescence and Western Blot Analyses
In-gel fluorescence and western blot analyses were used as an alternative measure
of total expressed proteins. 5 mL of expression samples were centrifuged and supernatant
discarded. Samples were resuspended to an OD600 of 3.0 in PBS. 1 mL of each sample
was collected and 250 µL lysis buffer (375 mM Tris-HCl pH 6.8, 6% SDS, 48% glycerol,
9% 2-Mercaptoethanol, 0.03% bromophenol blue) was added. Samples were lysed via
freeze fracturing by three rounds of freezing using liquid nitrogen and thawing using room
gels were imaged for fluorescence using a UV gel imager with a filter for GFP fluorescence
to determine in-gel fluorescence.
For western blot analysis, the samples were transferred from the gel onto a
nitrocellulose membrane using the Trans-Blot Turbo System. The membranes were
washed three times with 15 mL TTBS (50 mM Tris pH 7.6, 150 mM NaCl, 0.05%
Tween-20), incubated one hour with 15 mL 5% milk powder in TTBS, washed three times with
15 mL of TTBS, and then incubated with 1:5000 anti-GFP Mouse primary antibody (EMD
Millipore, Lot # 2483215) in 15 mL 5% milk powder in TTBS overnight. Membranes were
washed three times with 15 mL TTBS, incubated with 1:15000 IRDye® 800CW Donkey
anti-Mouse secondary antibody (LI-COR, Lot # C31024- 04) in 15 mL 5% milk powder in
TTBS for one hour, washed three times with 15 mL TTBS, and then visualized using a
Licor IR western blot scanner. ImageJ was used to process the images [55].
The CG Model Overview
The CG model is employed with only minor modifications from [46], all of which
are specified below. Key features of the CG model and its implementation are provided
here; for a full discussion of the CG model, the reader is referred to [36].
As described in [46], the CG model explicitly describes the configurational
dynamics of the nascent-protein chain, conformational gating in the Sec translocon, and
the slow dynamics of ribosomal translation. The nascent chain is represented as a freely
jointed chain of beads, where each bead represents three amino acids and has a diameter of
8 Å, the typical Kuhn length for polypeptide chains [56, 57]. Bonding interactions between
potential [58], short-ranged nonbonding interactions are modeled using the Lennard-Jones
potential, electrostatic interactions are modeled using the Debye-Hückel potential,
periplasmic binding is included as described in [36] for BiP, and solvent interactions are
described using a position-dependent potential based on the water-membrane transfer free
energy for each CG bead; all parameters are the same as used previously [36], unless
otherwise stated. The time evolution of the nascent protein is modeled using overdamped
Langevin dynamics, with the CG beads confined to a two-dimensional subspace that runs
along the axis of the translocon channel and between the two helices of the lateral gate
(LG). Conformational gating of the translocon LG corresponds to the LG helices moving
out of the plane of confinement for the CG beads, allowing the nascent chain to pass into
the membrane bilayer. The rate of stochastic LG opening and closing is dependent on the
sequence of the nascent protein CG beads that occupy the translocon channel. Ribosomal
translation is directly simulated via growth of the nascent protein at the ribosome exit
channel; throughout translation, the C-terminus of the nascent protein is held fixed, and
new beads are sequentially added at a rate of 24 residues per second. Upon completion of
translation, the C-terminus is released from the ribosome. It has been confirmed that the
results presented in the current study are robust with respect to changes in the rate of
ribosomal translation (Pearson correlation coefficient between Wt/Aa-tail ratios obtained
using a rate of translation of 24 residues/sec and 6 residues/sec, r = 0.99±0.06).
The CG Model Implementation Details
Two changes to the protocol for the CG simulation model were introduced in the
to remove unphysical artifacts in the simulations, although it is emphasized that
conclusions in the main text are qualitatively unchanged by these modifications (Pearson
correlation coefficient between Wt/Aa-tail ratios obtained with and without the
modifications to the simulation protocol, r = 0.97±0.09).
The first change in the CG model is that the ribosome is assumed to remain
associated with the translocon following translation of the nascent protein. In the
previously implementation of the model, the ribosome was assumed to dissociate from the
translocon immediately following stop-translation, which was found in the current study
to lead to artifacts for nascent proteins with extremely short C-terminal domains.
Furthermore, this modification is consistent with experimental evidence that indicates that
the timescale for ribosomal dissociation is slower than the trajectories simulated here [59,
60].
The second change in the CG model relates to the potential energy cost of flipping
hydrophilic nascent-protein loops across the lipid membrane at significant distances from
the translocon. The Wimley-White water-octanol transfer free energy scale [61] that was
used to parameterize the interactions of the CG beads with the membrane is appropriate for
describing the transfer of amino acids between an aqueous region and either the
phospholipid interface or the region of the membrane interior that is close to the translocon
lateral gate [62]. However, the flipping of hydrophilic nascent-protein loops across the
membrane at significant distances from the translocon involves moving CG beads through
the hydrophilic core of the membrane interior, which will incur a large potential energy
barrier [62]. To account for this effect, and to avoid unphysical flipping of short hydrophilic
potential energy function that describes the interactions between the CG beads and the
membrane. We emphasize that this new term has no noticeable effect on the potential
energy function for the CG beads at distances within 8 Å to the translocon channel; it
simply affects unphysical flipping of the TM domains across the membrane at larger
distances from the channel. This artifact was not observed in the earlier study using the CG
model, since only processes involving the translocation or membrane integration of a single
TM domain were considered.
The CG Model Bead Mapping
In the current study, amino-acid sequences for the TatC homologs are mapped onto
sequences of CG beads as follows. Each consecutive trio of amino acid residues in the
nascent protein sequence is mapped to an associated CG bead. The water-membrane
transfer free energy for each CG bead is taken to be the sum of the contributions from the
individual amino acids; these values are taken from the experimental water-octanol transfer
free energies for single residues [61]. The charge for each CG bead is taken to be the sum
of the contribution from the individual amino acids. As in [36], positively charged residues
(arginine and lysine) were modeled with a +2 charge to capture significant effects on
topology due to changes in the nascent protein sequence. Histidine residues were modeled
with a +1 charge to account for the partial protonation of these residues, and negatively
charged residues (glutamate and aspartate) were modeled with a charge of -1. The mapping
The CG Model Calculation Details
The co-translational membrane integration for each TatC sequence is simulated
using 1200 independent CG trajectories. As in [36], each CG trajectory is performed with
a timestep of 100 ns. All trajectories were terminated 30 seconds after the end of translation
for the protein sequence.
Analysis of Simulation Results.
To determine whether a given trajectory leads to integration in the correct
multispanning topology, the topology of a nascent protein configuration can be
characterized by the location of the soluble loops that connect the TMD. We thus specify
a collective variable λi associated with each loop, with i=1 corresponding to the loop that
leads TMD 1 in the sequence (i.e. the N-terminal sequence) and i=7 corresponding to the
loop that follows TMD 6 (i.e. the C-tail). If loop i is in the cytosol, then λi = 1; if loop i is
in the periplasm, then λi = -1; otherwise, λi = 0. Whether a given loop is in the cytosol, in
the membrane, or in the periplasm is determined by the tracking position of a representative
bead in that loop (Table 2.1). Representative beads were chosen based on having the lowest
probability of being inside the lipid region compared to other beads in that loop. A given
trajectory is determined to have reached correct IMP integration (λi = -1 for periplasmic
loops and, λi = 1 for cytosolic loops) if a configuration with the loops in the correct
orientation is sampled during a time window of 6 seconds taken 25 seconds after the end
of translation; the time window of 25 seconds was found sufficient to allow the nascent
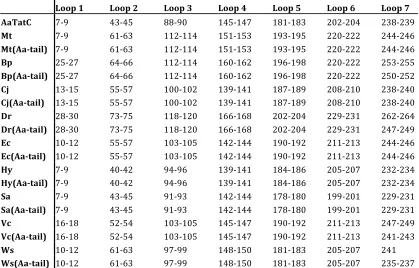
Table 2.1: Loop Definitions Used in Simulation Trajectory Analysis. Each loop is specified in terms of the amino-acid residue sequence numbers (end-points inclusive) associated with the wild-type sequence.
Figure 2.4 shows the fraction of trajectories that exhibit the correct topology for
each individual loop for all TatC homologs and chimeras considered in this study. It is
clear from Figure 2.4 that the changes to the amino-acid sequence considered in this study
largely only impact the topology of the domain where the changes to the amino acid
sequence were introduced; the topology of the rest of the protein is not predicted by the
CG simulation model to be significantly affected by the sequence changes. The calculated
results are robust with respect to the details of the definition of simulated integration
efficiency (Pearson correlation coefficient between Wt/Mutant ratios obtained analyzing
only the loop that was modified and those obtained analyzing all loops, r = 0.85±0.16); to
minimize statistical error, for all simulation results presented in the main text, the topology
of the IMP is thus characterized in terms of only the loop of interest.
Loop 1 Loop 2 Loop 3 Loop 4 Loop 5 Loop 6 Loop 7
C h a p t e r 3
A LINK BETWEEN INTEGRAL MEMBRANE PROTEIN EXPRESSION
AND SIMULATED INTEGRATION EFFICIENCY OF THE C-TAIL FOR
AN EXPANDED POOL OF TATC MUTANTS
Abstract
The heterologous overexpression of integral membrane proteins in Escherichia coli
often yields insufficient quantities of purifiable protein for applications of interest. The
current study leverages a recently discovered link between co-translational membrane
integration efficiency and protein expression levels to predict sequence modifications that
improve expression. Membrane integration efficiencies, obtained using a coarse-grained
simulation approach, robustly predict expression for a set of 140 sequence modifications
on the integral membrane protein TatC, including loop-swap chimeras and single-residue
mutations distributed throughout the protein sequence. Mutations that improve simulated
integration efficiency are found to be almost four-fold enriched with respect to improved
experimentally observed expression levels. Furthermore, the effect of double mutations,
on both simulated integration efficiency and experimentally observed expression levels, is
shown to be largely independent, suggesting that multiple mutations can be introduced to
yield higher levels of purifiable protein. This work provides a foundation for a general
method for the rational overexpression of integral membrane proteins based on
Introduction
Integral membrane proteins (IMPs) play crucial roles in the transport of molecules,
energy, and information across the membrane and are an important focus of structural and
biophysical studies. However, the production of sufficient levels of IMPs is a limiting
factor in their characterization [23]. Even among homologous IMP sequences, expression
levels can vary widely [22, 23, 63-65], and the mechanistic basis for this variability is often
unclear. Extensive efforts have been committed to identify IMP sequences, expression
conditions, and host modifications that yield IMP expression at sufficient levels for further
study [20, 37, 38]. Despite these efforts, general guidelines for successful overexpression
for IMPs of interest are lacking.
Heterologous overexpression of IMPs in E. coli involves multiple steps during biogenesis that are potential bottlenecks for overexpression, including the correct targeting
to the inner membrane[5, 6], integration [7, 9, 36, 66-68], and folding [13, 18, 27]. For a
given sequence, understanding how each of these steps affects observed expression levels
may lead to improved strategies for IMP overexpression.
Previous work indicates that the Sec-facilitated membrane integration step of
biogenesis is a limiting factor in the overexpression of the TatC IMP [22]. Sequence
changes that alter the efficiency of membrane integration efficiency, determined either
from coarse-grained simulations or experimentally, correlate with experimentally observed
IMP expression levels. Further work is necessary to explore the generality of this link and
its potential for enabling the rational enhancement of IMP expression.
The current study demonstrates the predictive capacity of simulated integration