Empirical Methods for Evaluating Dialog Systems
Tim Paek
Microsoft Research One Microsoft Way Redmond, WA 98052 [email protected]
Paper ID: SIGDIAL_TP
Keywords: dialog evaluation, dialog metric, descriptive statistics, gold standard, wizard-of-oz Contact Author: Tim Paek
Abstract
Empirical Methods for Evaluating Dialog Systems
Abstract
We examine what purpose a dialog metric serves and then propose empirical methods for evaluating systems that meet that purpose. The methods include a protocol for conducting a wizard-of-oz experiment and a basic set of descriptive statistics for substantiating performance claims using the data collected from the experiment as an ideal benchmark
or “gold standard” for
comparative judgments. The methods also provide a practical means of optimizing the system through component analysis and cost valuation.
1
Introduction
In evaluating the performance of dialog systems, designers face a number of complicated issues. On the one hand, dialog systems are ultimately created for the user, so usability factors such as satisfaction or likelihood of future use should be the final criteria. On the other hand, because usability factors are subjective, they can be erratic and highly dependent on features of the user interface (Kamm et al., 1999). So, designers have turned to “objective” metrics such as dialog success rate or completion time. Unfortunately, due to the interactive nature of dialog, these metrics do not always correspond to the most effective user experience (Lamel et al., 2000). Furthermore, several different metrics may contradict one another (Kamm et al., 1999), leaving designers with the tricky task of untangling the interactions or correlations between metrics.
Instead of focusing on developing a new metric that circumvents the problems above, we maintain that designers need to make better use of the ones that already exist. Toward that end, we first examine what purpose a dialog metric serves and then propose empirical methods for evaluating systems that meet that purpose. The methods include a protocol for conducting a
wizard-of-oz experiment and a basic set of descriptive statistics for substantiating performance claims using the data collected from the experiment as an ideal benchmark or “gold standard” for comparative judgments. The methods also provide a practical means of optimizing the system through component analysis and cost valuation.
2
Purpose
Performance can be measured in myriad ways. Indeed, for evaluating dialog systems, the one problem designers do not encounter is lack of choice. Dialog metrics come in a diverse assortment of styles. They can be subjective or objective, deriving from questionnaires or log files. They can vary in scale, from the utterance level to the overall dialog (Glass et al., 2000). They can treat the system as a “black box,” describing only its external behavior (Eckert et al., 1998), or as a “glass box,” detailing its internal processing. If one metric fails to suffice, dialog metrics can be combined. For example, the PARADISE framework allows designers to predict user satisfaction from a linear combination of objective metrics such as mean recognition score and task completion (Kamm et al., 1999; Litman & Pan, 1999; Walker et al., 1997).
Why so many metrics? The answer has to do with more than just the absence of agreed upon standards in the research community, notwithstanding significant efforts in that direction (Gibbon et al., 1997). Part of the reason deals with the purpose a dialog metric serves. Designers want a dialog metric to address the multiple, sometimes inconsistent needs. Here are four typical needs:
(1) Provide an accurate estimation of how well a system meets the goals of the domain task. (2) Allow for comparative judgments of one system against another, and if possible, across different domain tasks.
(3) Identify factors or components in the system that can be improved.
While the above list is not intended to be exhaustive, it is instructive. Creating such a list can help designers to anticipate the kinds of obstacles they are likely to face in trying to satisfy all of the needs. Consider the first need on the list.
Providing an accurate estimation of how well a system meets the goals of the domain task depends on how well the designers have delineated all the possible goals of interaction. Unfortunately, users often have finer goals than those anticipated by designers, even for domain tasks that seem well defined, such as airline ticket reservation. For example, a user may be leisurely hunting for a vacation and not care about destination or time of travel, or the user may be frantically looking for an emergency ticket and not care about price. The “appropriate” dialog metric should reflect even these kinds of goals. While “time to completion” is more appropriate for the emergency ticket, “concept efficiency rate” is more appropriate for the savvy vacationer. As psychologists have long recognized, when people engage in conversation, they make sure that they mutually understand the goals, roles, and behaviors that can be expected (Clark, 1996; Clark & Brennan, 1991; Clark & Schaefer, 1987, 1989). They evaluate the “performance” of the dialog based on their mutual understanding and expectations.
Not only do different users have different goals, they sometimes have multiple goals, or more often, their goals change dynamically in response to system behavior such as communication failures (Danieli & Gerbino, 1995; Paek & Horvitz, 1999). Because goals engender expectations that then influence evaluation at different points of time, usability ratings are notoriously hard to interpret, especially if the system is not equipped to infer and keep track of user goals (Horvitz & Paek, 1999; Paek & Horvitz, 2000).
The second typical need for a dialog metric – allowing for comparative judgments, introduces further obstacles. In addition to unanticipated, dynamically changing user goals, different systems employ different dialog strategies operating under different architectural constraints, making the search for a dialog metric that generalizes across systems nearly impossible. While the PARADISE framework facilitates some comparison of dialog systems in different domain tasks, generalization is limited
because different components can render factors irrelevant in the statistical model (Kamm et al., 1997). For example, a common measure of task completion would be possible if every system represented the domain task as an Attribute-Value Matrix (AVM). Unfortunately, that requirement excludes systems that use Bayesian networks or other non-symbolic representations. This has prompted some researchers to argue that a “common inventory of concepts” is necessary to have standard metrics for evaluation across systems and domain tasks (Kamm et al., 1997; Glass et al., 2000). As we discuss in the next section, the argument is actually backwards; we can use the metrics we already have to define a common inventory of concepts. Furthermore, with the proper set of descriptive statistics, we can exploit these metrics to address the third and fourth typical needs of designers, that of identifying contributing factors, along with their tradeoffs, and optimizing them.
This is not to say that comparative judgments are impossible; rather, it takes some amount of careful work to make them meaningful. When research papers describe evaluation studies of the performance of dialog systems, it is imperative that they provide a baseline comparison from which to benchmark their systems. Even when readers understand the scale of the metrics being reported, without a baseline, the numbers convey very little about the quality of experience users of the system can expect. For example, suppose a paper reports that a dialog system received an average usability score of 9.5/10, a high concept efficiency rate of 90%, and a low word error rate of 5%. These numbers sound terrific, but they could have resulted from low user expectations and a simplistic or highly constrained interface. Practically speaking, readers must either experience interacting with the system themselves, or have a baseline comparison for the domain task from which to make sense of the numbers. This is true even if the paper reports a statistical model for predicting one or more of the metrics from the others, which may reveal tradeoffs but not how well the system performs relative to the baseline.
metric that satisfies those needs. The obstacles themselves present distinct challenges: first, keeping track of user goals and expectations for performance based on the goals, and second, establishing a baseline from which to benchmark systems and make comparative judgments. Assuming that designers equip their system to handle the first challenge, we now propose empirical methods that allow them to handle the second, while at the same time providing a practical means of optimizing the system. These methods do not require new metrics, but instead take advantage of existing ones through experimental design and a basic set of descriptive statistics.
3
Empirical methods
Before designers can make comparative judgments about the performance of a dialog system relative to another system, so that readers unacquainted with either system can understand the reported metrics, they need a baseline. Fortunately, in evaluating dialog between humans and computers, the “gold standard” is oftentimes known; namely, human conversation. The most intuitive and effective way to substantiate performance claims is to compare a dialog system on a particular domain task with how human beings perform on the same task. Because human performance constitutes an ideal benchmark, readers can make sense of the reported metrics by assessing how close the system approaches the gold standard. Furthermore, with a benchmark, designers can optimize their system through component analysis and cost valuation.
In this section, we outline an experimental protocol for obtaining human performance data that can serve as a gold standard. We then highlight a basic set of descriptive statistics for substantiating performance claims, as well as for optimization.
3.1 Experimental protocol
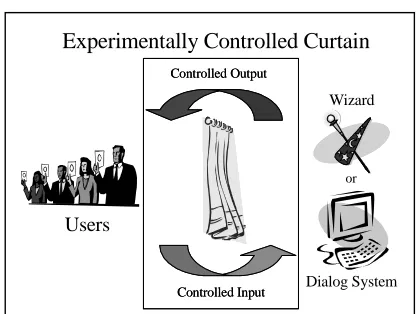
[image:4.612.316.524.70.227.2]Collecting human performance data for establishing a gold standard requires conducting a carefully controlled wizard-of-oz (WOZ) study. The general idea is that users communicate with a human “wizard” under the illusion that they are interacting with a computational system. For spoken dialog
Figure 1. Wizard-of-Oz study for the purpose of establishing a baseline comparison.
systems, maintaining the illusion usually involves utilizing a synthetic voice to output wizard responses, often through voice distortion or a text-to-speech (TTS) generator.
The typical use of a WOZ study is to record and analyze user input and wizard output. This allows designers to know what to expect and what they should try to support. User input is especially critical for speech recognition systems that rely on the collected data for acoustic training and language modeling. In iterative WOZ studies, previously collected data is used to adjust the system so that as the performance of the system improves, the studies employ less of the wizard and more of the system (Glass et al., 2000). In the process, design constraints in the interface may be revealed, in which case, further studies are conducted until acceptable tradeoffs are found (Bernsen et al., 1998).
In contrast to the typical use, a WOZ study for establishing a gold standard prohibits modifications to the interface or experimental “curtain.” As shown in Figure 1, all input and output through the interface must be carefully controlled. If designers want to use previously collected performance data as a gold standard, they need to verify that all input and output have remained constant. The protocol for establishing a gold standard is straightforward:
(1) Select a dialog metric to serve as an objective function for evaluation.
(2) Vary the component or feature that best matches the desired performance claim for the dialog metric.
Users
Wizard
Dialog System or
Experimentally Controlled Curtain
Controlled Input Controlled Output
(3) Hold all other input and output through the interface constant so that the only unknown variable is who does the internal processing. (4) Repeat using different wizards.
To motivate the above protocol, consider how a WOZ study might be used to evaluate spoken dialog systems. The Achilles’ heel of spoken interaction is the fragility of the speech recognizer. System performance depends highly on the quality of the recognition. Suppose a designer is interested in bolstering the robustness of a dialog system by exploiting various repair strategies. Using task completion rate as an objective function, the designer varies the repair strategies utilized by the system. To make claims about the robustness of these repair strategies, the designer must keep all other input and output constant. In particular, the wizard in the experiment must receive utterances through the same speech recognizer as the dialog system. The performance of the wizard on the same quality of input as the dialog system constitutes the gold standard. The designer may also wish to keep the set of repair strategies constant while varying the use or disuse of the speech recognizer to estimate how much the recognizer degrades task completion.
A deep intuition underlies the experimental control of the speech recognizer. As researchers have observed, people with impaired hearing or non-native language skills still manage to communicate effectively despite noisy or uncertain input. Unfortunately, the same cannot be said of computers with analogous deficiencies. People overcome their deficiencies by collaboratively working out the mutual belief that their utterances have been understood sufficiently for current purposes – a process referred to as “grounding” (Clark, 1996). Repair strategies based on grounding indeed show promise for improving the robustness of spoken dialog systems (Paek & Horvitz, 1999; Paek & Horvitz, 2000).
3.1.1 Precautions
A few precautions are in order. First, WOZ studies for establishing a gold standard work best with dialog systems that are highly modular. Modularity makes it possible to test components by replacing a module with the wizard. Without modularity, it is harder to use because the boundaries between components are
[image:5.612.320.521.75.237.2]the performance of the wizard as a gold standard
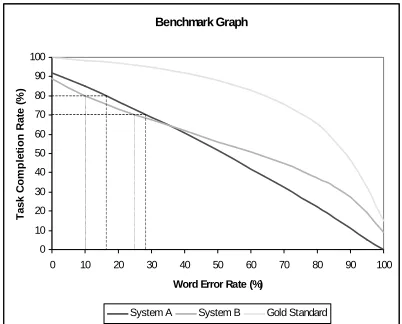
Figure 2. Comparison of two dialog systems with respect to the gold standard.
blurred. Second, what allows the performance of the wizard to be used as a gold standard is not the wizard, but rather the fact that the performance constitutes an upper bound. For example, the upper bound may be better established by graphical user interfaces (GUI) or touch-tone systems, in which case, those systems should be the gold standard.
3.2 Descriptive statistics
After designers collect data from the WOZ study, they can make comparative judgments about the performance of their system relative to other systems using a basic set of descriptive statistics. The descriptive statistics rest on first model fitting the data for both the wizard and the dialog system. Plotting the fitted curves on the same graph sheds light on how best to substantiate any performance claims. In fact, we advocate that designers present this “benchmark graph” to assist readers in interpreting dialog metrics.
Using spoken dialog again as an example, suppose a designer is evaluating the robustness of two dialog systems utilizing two different repair strategies. The designer varies the repair strategies, while holding constant the use of the speech recognizer. As speech recognition errors increase, numerous researchers have shown that task completion rate, or dialog success rate, not surprisingly decreases. Plotting task completion rate as a function of word error rate discloses an approximately linear relationship (Lamel et al., 2000; Rudnicky, 2000).
Figure 2 displays a benchmark graph for two
Benchmark Graph
0 10 20 30 40 50 60 70 80 90 100
0 10 20 30 40 50 60 70 80 90 100
Word Error Rate (%)
T
a
s
k
Co
m
p
le
ti
o
n
Ra
te
(%
)
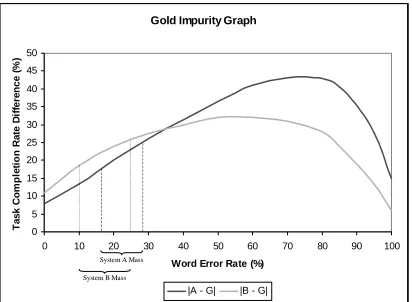
Figure 3. Distance in performance of the two systems from the gold standard.
dialog systems A and B, utilizing different repair strategies. Suppose that the fitted curve for System A is characteristically linear, while the curve for System B is polynomial. Because wizards are presumably more capable of recovering from recognition errors, their performance data make up the gold standard. Figure 2 shows a fitted curve for the gold standard staying close to the upper right hand corner of the graph in a monotonically decreasing fashion; that is, task completion rate remains relatively high as word error rate increases and then gracefully degrades before the error rate reaches 100%.
Looking at the benchmark graph, readers immediately get a sense of how to substantiate performance claims about robustness. For example, by noticing that task completion rate for the gold standard rapidly drops from around 65% at the 80% mark to about 15% by 100%, readers know that at 80% word error rate, even wizards, with human level intelligence, cannot recover from failures with better than 65% task completion rate. In other words, the task is difficult. So, even if System A and B report low task completion rates after the 80% word error rate, they may be performing relatively well compared to the gold standard.
In making comparative judgments, it helps to plot the absolute difference in performance from the gold standard as a function of the same independent variable as the benchmark graph. Figure 3 displays such a “gold impurity graph” for Systems A and B as a function of word error rate. The closer a system is to the gold standard, the smaller the “mass” of the gold impurity on
the graph. Anomalies are easier to see, as they typically show up as bumps or peaks. The advantage of the graph is that if a dialog system reports terrible numbers on various performance metrics but displays a splendidly small gold impurity, the reader can be assured that the system is as good as it can possibly be.
Looking at the gold impurity graph for Systems A and B, without having experienced either of the two systems, readers can make comparative judgments. For example, although B performs worse at lower word error rates than A, after about the 35% mark, B stays closer to the gold standard. With such crosses in performance, designers cannot categorically prefer one system to the other. In fact, assuming that the only difference between A and B is the choice of repair strategies, designers should prefer A to B if the average word error rate for the speech recognizer is below 35%, and B to A, if the average error rate is about 40%.
With a gold standard, readers are even able to substantiate performance claims about different dialog systems across domain tasks. They need only to look at how close each system is to their respective gold standard in a benchmark graph, and how much mass each system shows in a gold impurity graph.
3.2.1 Complexity
One reason why comparative judgments, without a gold standard, are so hard to make across different domain tasks is task complexity. For example, tutoring physics is generally more complex than retrieving email. Another reason is dialog complexity. A physics tutoring system will be less complex if the system forces users to follow a predefined script. An email system that engages in “mixed initiative” will always be more complex because the user can take more possible actions at any point in time.
The way to express complexity in a benchmark graph is to measure the distance of the gold standard to the absolute upper bound of performance. If wizards with human level intelligence cannot perform close to the absolute upper bound, then the task is complex, or the dialog interface is too restrictive for wizard, or both. Because complexity is measured only in connection with the gold standard ceteris
paribus, “intellectual complexity” can be
defined as:
Gold Impurity Graph
0 5 10 15 20 25 30 35 40 45 50
0 10 20 30 40 50 60 70 80 90 100
Word Error Rate (%)
T a s k Co m p le ti o n Ra te D iff e re n c e (% )
|A - G| |B - G|
System B Mass System A Mass
Gold Impurity Graph
0 5 10 15 20 25 30 35 40 45 50
0 10 20 30 40 50 60 70 80 90 100
Word Error Rate (%)
T a s k Co m p le ti o n Ra te D iff e re n c e (% )
|A - G| |B - G|
∑
=
− ⋅
= n
x x g U n IC
0 ) (
where U is the upper bound value of a performance metric, n is the upper bound value for an independent variable x, and g(x) is the gold standard along that variable.
Designers can use intellectual complexity to compare systems across different domain tasks if they are not too concerned about discriminating task complexity from dialog complexity. Otherwise, they can use intellectual complexity an objective function and vary the complexity of the dialog interface to scrutinize how much task complexity affects wizard performance.
3.2.2 Precautions
Before substantiating performance claims with a benchmark graph, designers should exercise a few precautionary measures. First, in model fitting a gold standard or the performance of a dialog system, beware of insufficient data. Without sufficient data, differences from the gold standard may be due to variance in the models. To guarantee that designers have collected enough data, we recommend that they go through an iterative process. First, run subjects, collect data, and fit a model. Then plot the least squares distance, or
∑
−i
i i f x y ( ))2
( ,
where f(x) is the fitted model, against the iteration. Keep running more subjects until the plot seems to approach convergence. To inform readers of the reliability of the fitted models, we suggest that designers either show the convergence plot or report their R2s for their curves (which relate how much of the variance can be accounted for by the fitted models). Second, to guarantee the reliability of the gold standard, use different wizards. The experimental protocol listed this as the last point because it is important to know whether a consistent gold standard is even possible with the given interface. Difference between wizards may reveal serious design flaws. Furthermore, just as adding more subjects improves the fit of the dialog performance models, the law of large numbers applies equally to the gold standard.
[image:7.612.315.518.75.236.2]Finally, designers may encounter problems with residual errors in model fitting that are typically well covered in most statistics
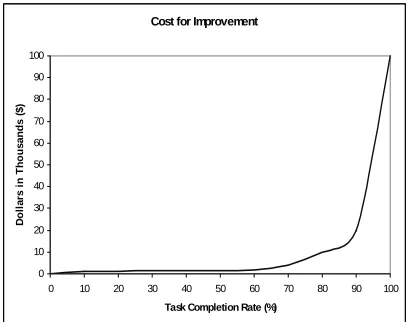
Figure 4. Dollar amount designer is willing to pay for improvements to task completion rate.
textbooks. For example, because the performance metric shown in Figure 2 and 3, task completion rate, has an upper bound of 100%, it is unlikely that residual errors will be equally spread out at all word error rates. Another common problem is the non-normality of the residual errors, which violates the model assumption.
3.2.3 Component analysis
Designers can identify which components are contributing the most to a performance metric by examining the gold impurity graph of the system with and without the component, rendering this kind of test similar to a “lesion” experiment. Carrying out stepwise comparisons of the components, designers can check for tradeoffs, and even use all or part of the mass under the curve as an optimization metric. For example, a designer may wish to improve a dialog system from its current average task completion rate of 70% to 80%. Suppose that System B in Figure 2 incorporates a particular component that System A does not. Looking at the corresponding word error rates in the gold impurity graph for both systems, the mass under the curve for B is slightly greater than that for A. The designer can optimize the performance of the system by selecting components that minimize that mass, in which case, the component in System B should be excluded. Because components may interact with each other, designers may want to carry out a multi-dimensional component analysis for optimization.
Cost for Improvement
0 10 20 30 40 50 60 70 80 90 100
0 10 20 30 40 50 60 70 80 90 100
Task Completion Rate (%)
D
o
ll
a
rs
in
T
h
ous
a
n
ds
($
3.2.4 Cost valuation
Suppose the main concern of the designer is to optimize the monetary cost of the dialog system. The designer can determine how much improving the system is worth by calculating the average marginal cost. To do this, a cost function must be elicited that conveys what the designer is willing to pay to achieve various levels of performance. This is actually very easy. Figure 4 displays what dollar amount a designer might be willing to pay for various rates of task completion. The average marginal cost can be computed by using the cost function as a weighting factor for the mass under the gold impurity graph for the system. So, following the previous example, if the designer wishes to improve the system that is currently operating at an average task completion rate of 70% to 80%, then the average marginal cost for that gain is simply:
∑
=
− ⋅ = 80
70
) ( ) ( ) (
t
t g t f t c AMC
where f(t) is the task completion rate of the system, g(t) is the task completion rate of the gold standard, and c(t) is the cost function.
Average marginal cost is useful for minimizing expenditure. For example, if the goal is to improve task completion rate from 70% to 80%, and the designer must choose between two systems, one with a particular component and one without, the designer should calculate the average marginal cost of both systems as stated in the above equation and select the cheaper system.
4
Discussion
Instead of focusing on developing new dialog metrics that allow for comparative judgments across different systems and domain tasks, we proposed empirical methods that accomplish the same purpose while taking advantage of dialog metrics that already exist. In particular, we outlined a protocol for conducting a WOZ experiment to collect human performance data that can be used as a gold standard. We then described how to substantiate performance claims using both a benchmark graph and a gold impurity graph. Finally, we explained how to
optimize a dialog system using component analysis and value optimization.
Without a doubt, the greatest drawback to the empirical methods we propose is the tremendous cost of running WOZ studies, both in terms of time and money. In special cases, such as the DARPA Communicator Project where participants work within the same domain task, a funding agency may wish to conduct the WOZ studies on behalf of the participants. To defray the cost of running the studies, the agency may wish to determine its own cost function with respect to a given performance metric and utilize average marginal cost to decide which dialog systems to continue sponsoring.
Because the focus of this paper has been on how to apply the empirical methods, hypothetical examples were considered. Work is currently underway to collect data for evaluating implemented dialog systems. We maintain that without these empirical methods, readers of reported dialog metrics cannot really make sense of the numbers.
References
Bersen, N. O., Dybkjaer, H. & Dybkjaer, L. (1998). Designing interactive speech systems: From
first ideas to user testing. Springer-Verlag.
Clark, H.H. (1996). Using language. Cambridge University Press.
Clark, H.H. & Brennan, S.A. (1991). Grounding
in communication. In Perspectives on Socially
Shared Cognition, APA Books, pp.127-149.
Clark, H.H. & Schaefer, E.F. (1987).
Collaborating on contributions to conversations.
Language and Cognitive Processes, 2/1, pp.19-41.
Clark, H.H. & Schaefer, E.F. (1989).
Contributing to discourse. Cognitive Science, 13,
pp.259-294.
Danieli, M. & Gerbino, E. (1995). Metrics for
evaluating dialogue strategies in a spoken language system. In Proc. of AAAI Spring Symposium on
Empirical Methods in Discourse Interpretation and Generation, pp. 34-39.
Eckert, W., Levin, E. & Pieraccini, R. (1998).
Automatic evaluation of spoken dialogue systems. In
Gibbon, D., Moore, R. & Winski, R. (Eds.) (1998). Handbook of standards and resources for
spoken language systems. Spoken Language System
Assessment, 3, Walter de Gruyter, Berlin.
Glass, J., Polifroni, J., Seneff, S. & Zue, V. (2000). Data collection and performance evaluation
of spoken dialogue systems: The MIT experience. In
Proc. of ICSLP.
Horvitz, E. & Paek, T. (1999). A computational
architecture for conversation. In Proc. of 7th
International Conference on User Modeling, Springer Wien, pp. 201-210.
Kamm, C., Walker, M.A. & Litman, D. (1999).
Evaluating spoken language systems. In Proc. of
AVIOS.
Lamel, L., Rosset S. & Gauvain, J.L. (2000).
Considerations in the design and evaluation of spoken language dialog systems. In Proc. of ICSLP.
Litman, D. & Pan, S. (1999). Empirically
evaluating an adaptable spoken dialogue system. In
Proc. of 7th International Conference on User Modeling, Springer Wien, pp. 55-64.
Paek, T. & Horvitz, E. (2000). Conversation as
action under uncertainty. In Proc. of 16th UAI, Morgan Kaufmann, pp. 455-464.
Paek, T. & Horvitz, E. (1999). Uncertainty,
utility, and misunderstanding. In Proc. of AAAI Fall
Symposium on Psychological Models of Communication, pp. 85-92.
Rudnicky, A. (2000). Understanding system
performance in dialog systems. MSR Invited Talk.
Walker, M.A., Litman, D., Kamm, C. & Abella, A. (1997). PARADISE: A framework for evaluating