IN STEREOSCOPIC VISION
Thesis by Cary Lu
In Partial Fulfillment of the Requirements for the Degree of
Doctor of Philosophy
California Institute of Technology Pasadena, California
1972
ACKNOWLEDGEMENT
The work described here was done under unusual conditions at Caltech which permitted the exploration of many areas not covered in conventional curriculums, not even at Caltech.
Derek Fender contributed much advice and helped to make this thesis readable; he was also tolerant of my many extraneous activities.
Many persons provided assistance, particularly Bob Kavanagh with computer programming and Dan Aranovich and Rinus Dekker with electronics. Gaetan St.-Cyr, Patrick Nye, Tony Goodwin, and Andrew Kertesz were
always helpful.
Bela Julesz first introduced me to the marvelous things which could be done with his stereo patterns at Bell Telephone Laboratories.
I also want to thank the taxpayers of the United States of America through the National Institutes of Health for supporting this project.
ABSTRACT
Experiments are described using the random dot stereo patterns devised by Julesz, but substituting various colors an.d luminances for the usual black and white random squares. The ability to perceive the patterns in depth depends on a luminance difference between the colors used. If two
colors are the same luminance, then depth is not perceived although each of the individual squares which make up the patterns is easily seen due to the color difference. This is true for any combination of different colors. If
different colors are used for corresponding random squares between the left and right eye patterns, stereopsis is
TABLE OF CONTENTS
Chapter Psge
1 Introduction l
2 The Basis of Binocular Vision 3
3 Color
15
4
Random Dot Stereo Pictures 265
Binocular Vision in Real Life35
6 Methods 39
7
Results57
CHAPTER ONE INTRODUCTION
Research in vision has almost always concentrated on isolating parameters; this has been necessary because of the complexity of the visual system. This has led to a large volume of experiments with results which are di.ffi-cult to relate to one another. In recent years, as the understanding o.f .fundamental processes of vision has improved, experiments have begun to be carried out Which study the interaction o.f various parameters.
In this thesis, two o.f the major areas o.f vision research, traditionally carried out in isolation, are
combined: binocular vision and color vision. Their inter-action is mapped, with o.f course a restricted set of
stimuli, to examine the way in which visual in.formation due to dif.ferences in color and di.fferences in luminance are used to perceive depth. (The term color conventionally includes hue, saturation and brightness. This is explained in Chapter
3.)
Neurophysiological and psychophysical experiments have provided a great deal o.f in.formation on how the discrimina-tions .for depth and color are achieved. We now know,
dimensional space, and how the cells receive information coded for the wavelength of li"ght. These results will be reviewed in the first chapters.
Because of the tendency to isolate parameters in vision research, the background information in the early chapters must necessarily be difficult to tie together until the
CHAPTER TWO
THE BASIS OF BINOCULAR VISION
There are three major physiological cues to depth
perception.: the accomodation. of the eyes, convergence of the eyes, and retinal disparity, that is the differences between the images of an object on the retinae. Of these, accomodation can. be a monocular cue, the others bin.ocular. Accomodation and convergence are not important factors in
seeing depth; very early work by Dove, 1841,showed depth perception was readily achieved during the brief illumina-tion of a spark, too brief for any changes in accomodaillumina-tion or convergence. Retinal disparity is a very important mechanism, and will now be considered in detail below.
Secondary cues, also called psychological or familiar-ity cues, such as perspective, size, clarfamiliar-ity, etc. are also important in normal visual experience. These factor~ can be fairly simply manipulated to produce erroneous depth
perception, since they are based on experience rather than fundamental physiological operations. They are discussed in Chapter
5.
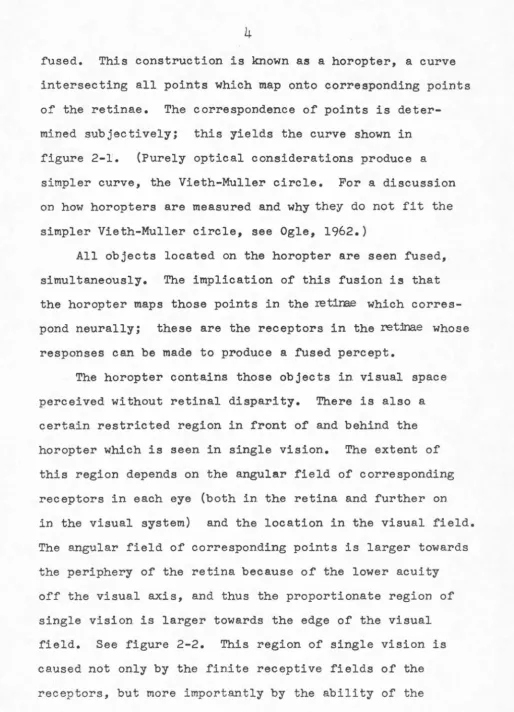
fused. This construction is known as a horopter, a curve intersecting all points which map onto corresponding points of the retinae. The correspondence of points is
deter-mined subjectively; this yields the curve shown in figure 2-1'. (Purely optical considerations produce a simpler curve, the Vieth-Muller circle. For a discussion on how horopters are measured and why they do not fit the simpler Vieth-Muller circle, see Ogle, 1962.)
All objects located on the horopter are seen fused, simultaneously. The implication of this fusion is that the horopter maps those points in the retira.e which corres-pond neurally; these are the receptors in the ret:inae whose responses can be made to produce a fused percept.
[image:10.563.28.543.33.746.2]Figure 2-1. A horopter. Points on the curve map
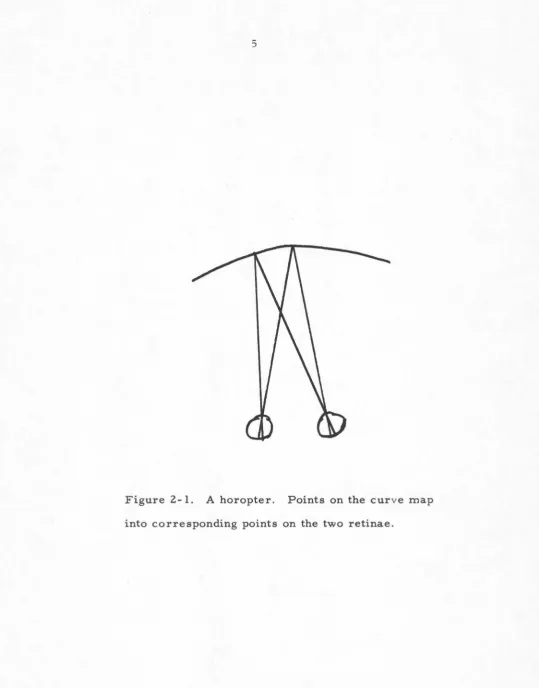
[image:11.562.10.550.32.721.2]Observation distan<;e
50cm 14 degree field
L.E. R.E.
Double images appear "farther" than fixation paint
[image:12.561.10.547.24.708.2]central visual system to fuse objects which are not
exactly on the horopter; neural correspondence need not
be exact for single vision, only close enough to be
correlated between the two eyes. Differences in the
corre-lation mean differences in disparity. Point by point
remapping of these differences in disparity by the central
visual system while all objects are still seen in single
vision yields depth perception.
Single vision results from two mechanisms which should
be distinguished. The first was mentioned above -the
range of retinal disparities which permit a single percept
of objects and involves a full range of depth perception
with single vision.
The fusion.al mechanism is a second mechanism which
brings about single vision. and does not deal with depth but
rather the permissible sloppiness in registration of the
two eye images which still allows a single percept of
objects. If the retinal image of one eye is rotated about
the line of sight with respect to the other image and the
stimuli are so constructed that rotation of one about its
center only produces equivalent vertical disparities, then
the depth perception mechanism is not stimulated. It is
found that the disparity is compensated by an apparently
central fusion mechanism, which is an example of the second
type of single vision (Kertesz, 1971).
be about 6 min arc in central vision using poin.t stimuli, and increases toward the periphery of the visual field.
The Kertesz experiments show that the disparity compensated for by the fusion.al mechanism is dependent on the complexity
of the patterns. The more complex the patterns (the greater the number of discrete elements in the visual field), the greater the permissible sloppiness which is compensated for centrally.
Note that this permissible sloppiness is larger than the disparities needed for depth perception.. Depth can be perceived in ordinary situations with disparities of about two min arc although under some laboratory conditions, with controlled high constrast stimuli, stereoscopic acuity can reach a few seconds of arc.
The fusional mechanism is often referred to as "Pan.um's Fusion.al Area" in the vision literature. Un.fortunately the term is not always used in the restricted sense described here, but for allowable binocular disparity with depth perception, (which is the first type of fusion described here). There are also many differences in. the way it is measured and even how the values of the area are quoted. See Mitchell, 1966.
the double vision is n.ot normally noticed. These are the regions of paten.t stereo vision.. In front of and behind the regions of paten.t stereo vision, there are two more regions where double vision. is perceived, yet spatial
localization is still unambiguous. Finally, the remaining two regions of visual space, in front of an.d behind all the others, generate retinal disparities too great for unambig-uous depth perception.
We may n.ow draw up a sequence of operations (undoubt-edly oversimplified, and idealized) which are performed by the visual system in. depth perception:
1. An object, which is the center of attention, is located in an horopter. To do this, the visual system must fuse corresponding features from the images in each eye by appropriate convergence. This is the fusion.al mechanism and does not
always operate correctly.
3.
Still other objects, farther away from thehoropter within the area of patent stereo vision
are identified, but not fused and their
corres-ponding depth positions with respect to the
horop-ter are determined and conflicting parts of the
percept are suppressed. Suppression normally
occurs to allow the maximum unambiguous percept
of the object.
4.
Another set of objects is identified, correlated,and localized in depth, but the disparity is too
great to suppress portions of their images.
5.
Other objects with very large retinal disparitiesare identified, but not correlated, so nD
localization is possible; they are perceived
double.
This thesis will describe experiments which deal with
points 1 and 2, where fusion. of images is performed by the
visual system using cues of differences in. color and
brightness in. the images. Points
3-5
are of less directrelevance and will be mentioned again only where
appro-priate.
The Neurophysiology of Binocular Vision.
Neurophysiology must ultimately account for or
some tentative information about what happens.
The fusion of objects at the center of attention from
the two eye images eventually results in a feature by
feature matching of the images.
How the visual cortex of the cat maps the visual
direction of stimulating light was shown by Hubel and
Wiesel (1962), who found that the neurons in the visual
cortex are organized into columns, where the cells of a
particular column have the same preference for direction
of movement of an edge in the visual field for maximal
stimulation. The columns contain a population of cells
and these cells have slightly different visual fields.
Extensions of this technique to binocular vision. have
led to experiments by Barlow, Blakemore and Pettigrew (1967)
and Nikara, Bishop, and Pettigrew (1968) which have shown
that the majority of the cells in the visual cortex of the
cat are binocularly driven, responding to light stimulation
in either eye in the appropriate visual direction. These
cells give a greater response (measured in number of spikes
per unit time) to simultaneous bin.ocular stimulation than the
sum of left and right eye monocular stimulation.
I
' The classifications of Blakemore (1970) provide the
most succinct summary of binocular vision. in the cat: He
reports that there are two types of columns of cells in the
visual cortex. The constant depth column consists of cells
disparity, which look out onto adjacent regions of visual space; these cells receive input from receptors which are grouped together on the retina. The column therefore looks out onto one segment of a horopter.
The constant direction column consists of neurons with superimposed inputs from the contralateral eye, and hori-zontally scattered inputs from the ipsilateral eye. Thus, these neurons "look" in a specific visual direction for the
contralateral eye but at different disparities from the
ipsilateral, that is, in the same direction but at differing
depths.
The binocular gate neurons described by Bishop (1972)
are cells which have the greatest sensitivity to accurate localization in visual space, typically responding only to
binocular stimuli simultaneously presented within a
0.3
degree cone in the visual direction from each eye. Outside of this cone, the cell is inhibited when stimulated in the other eye within a 2 degree cone which envelopes the 0.3degree cone. This presumably corresponds to the area around the horopter which permits single vision; for a given gate cell, objects within the 0.3 degree cone cann.ot be distinguished. Populations of cells each with slightly different disparities would account for depth perception
within this region.
The other categories of stereosis are more difficult
Psychophysical experiments depend on the percept of objects,
and are very difficult to interpret in terms of the activity
of particular cells in the visual cortex.
When the disparities a.re too large for fusion, there
is at present no clear neurophysiological data which offer
an explanation of the suppression of portions of an image.
Cells which have been. thus far analysed in terms of line
detectors are too simple to identify objects. Localization
of an object when it cannot be fused because of excessive
disparity involves recognition of the object; simple
objects such as rods ca.n be seen. double without localization,
while a more familiar object, such as a pen, will be
localized in space although not seen fused.
Identification of objects in two visual fields must
involve higher order correlation which looks at similar
features seen. by populations of cells.
The neurophysiological location. of these higher order
complex pattern detectors is uncertain; one can at present
only speculate on the way the percept of a real object is
formed; as one moves on higher in. the visual system from
the visual cortex, and indeed at the visual cortex, no
successful strategy has evolved to determine what is the
maximally effective stimulus for a given cell, or what is
References
Barlow, H., C. Blakemore, and I. Pettigrew (1967) J. Physiol. 193: 327.
Bishop, P. (1972) Neurophysiology of Binocular Single
Vision and Stereopsis, in Handbook of Sensory Physiology, Vol 7. Springer-Verlag, Berlin.
Blakemore, C. (1970) J. Physiol. 209: 155.
Hubel, D. and Wiesel, T. (1962)
J.
Physiol. 160: 106. Kertesz, A.E. Vision Research, in press, 1971.Mitchell, D.E. (1966) American Journal of Optometry, 43: 387. Nikara, T., P. Bishop, and I. Pettigrew (1968) Expt.
Brain Res. 6: 353.
CHAPTER THREE
COLOR
The concept of color has generated an enormous litera-ture and, it seems, an. even more enormous con.fusion. There is scarcely any facet of color which has not been subjected to conflicting study and conflicting vocabulary. The
purpose of this chapter is limited to clarifying the terms used in this thesis and describing the results of research which is relevant to the experiments to be described.
There is n.o wholly satisfactory definition of color; the common definition. is that it is the perceptual component of vision related to the wavelength of the stimulating
light. However,there are many examples of situations
where the 11coloru is not caused by the wavelengths of light, such as the many subjective color phenomena. It is not even necessary to have light in order to "see'' color (phospenes, for example).
Light sources differ by three approximately
in.depen-dent variables: brightness, hue, and saturation.
"Brightness" refers to the perceptual response to luminance.
Luminance is the physical quantity, integrated across the
visible spectrum of radiant energy multiplied by the
standard photopic response of the eye. In this thesis,
"color" is normally considered independent of luminance
or brightness; this tel"m is used for hue and saturation
only. The term color will include the neutral, or
achromatic colors, white, gray, and black. Note that white,
gray, and black are considered here to be the same color
{different brightness) just as dark green and light green
{both 512 nm) are the same color.
In some psychophysical experiments and in the
descriptions of vision, there is an important distinction
between. the wavelengths of stimulating light {the physical
parameters) and the perceived color, since there are many
instances where the perceived color is only casually
related to the spectral composition. .of the stimulus. These
complications do not arise in the experiments to be
described here; these experiments only require that
different colors be seen. distinctly and the relatively
small changes in perceived color under different conditions
are not important to the results {although these changes
are noted where appropriate). Because of this, physical
stimulus terms and perceived color names like 512 nm, green,
The surmise of Thomas Young in 1807 that color perception is dependent on. three color addition in. the visual system has been recently supported by experiments with the human retina. This was studied directly by
microspectrophometry (Marks, Dobelle, and MacNichol,
1964;
Wald,
1964)
and sensory methods (Stiles,1959).
These experiments have provided evidence for three pigments in the human fovea with responses peaked at about
445, 540,
and570
run. This corresponds, in Nation.alBureau of Standards nomenclature, to purplish blue,
yellowish green, and yellow green respectively. These are not the blue, green and red which were expected by
physiologists and psychologists in the last century, some of whom found support for their theories on the basis of the "unitary" colors--that is, colors which are perceptually 11pure"--blue, green, yellow, red. DeValois,(1972) for example does not use the more common description of "Blue, green., and red11 receptors, but rather "Short, medium, and long"
wavelength receptors (S, M, and L receptors).
The point of all this is that while there is good physiological basis for trichromatic color theory, the
form that color information takes does not appear to follow the traditional ideas of primary colors, at the level of the receptors and the neural pathways which immediately follow.
in the neural pathways has mostly been found to be based
on opponent-color processes, and most of the infomation. has been collected in the lateral gen.iculate body of the monkey.
(DeValois, 1972).
The term "opponent-color" was origin.ally used by Hering in the nineteenth century to describe his theory of color vision.. His concept is superficially con.firmed by modern. neurophysiology. The concept involves four basic colors, red, yellow, green, and blue. Pairings for complementary colors ("opponent colors") are red with green., and yellow with blue. Hering proposed that there were
three types of pathways mediating color vision: one channel responding to color content in terms of redness or greeness,
another in blue and yellow, and a third to changes in over-all light, regardless of wavelength (aside from the
funda-mental spectral sensitivity of the eye). (Note that red and green. are not true complementary colors.)
The six general categories of lateral geniculate body cells of DeValois fall generally into these three groups:
The first four are the "opponent-color cells" (about 70-801/o of the detected cells):
1. Cells stimulated by red, inhibited by green.
2. Cells stimulated by green, inhibited by red.
3.
Cells stimulated by yellow, inhibited by blue.4.
Cells stimulated by blue, inhibited by yellow.5.
Cells stimulated by increase in overall light intensity, inhibited by a decrease.6. Cells stimulated by a decrease in overall light intensity, inhibited by an increase.
For each group there is a population of cells stimu-lated or inhibited by the appropriate colors (or changes in overall light intensity) and the degree of stimulation and inhibition varies over a wide range.
Wavelengths of light corresponding to the colors described here as red, yellow, green, and blue are: 660,
580, 510, 450
nm. (Of course there is a range of colors abouteac.hof these wavelengths which yields the same types of
response.) These can be compared with the three color pigments in the retina described above. Thus the responses
of the receptors are already interactive in the LGB. The evidence suggests that the red/green cells have input from
L and M type cones (see above), while the blue/yellow cells have input from S and L type cones. (DeValois, 1965;
Abramov, 1968)
Beyond the lateral geniculate body, there have been only a few studies; Hubel and Wiesel (1968) found that in the striate cortex of the rhesus monkey most of the cells were achromatic, and responded to the overall in.tensity of
light, irrespective of wavelength. Only a small minority of cells, twelve out of 177, had had clear chromatic responses.
simply responded to light of a small range of wavelengths,
and the remaining five responded to moving slits of some
chromatic light.
One of the problems in interpreting n.europhysiological
data is that the cells studied by this technique are
selected by whatever recording and testing method is used;
thus it is very difficult to determine what percentage of
cells in the LGN or visual cortex are missed simply because
of in.appropriate stimuli. And, as noted in. the last
chapter, there is no ~n.own. strategy for determining the
optimum stimulus for a given. cell.
Psychophysics of Color Vision.
Discrimination of color is best described on the CIE
triangle. The experiments conducted to produce the CIE
triangle utilize a ten degree visual field (this is the
1964 system; the earlier 1931 system in current parallel
use is based on. a two degree visual field. For the
pur-poses of this discussion, the differences in the resulting
systems are minor). The visual field is split down. the
middle with the test stimulus on. the left. The matching
stimulus with subject control of the primary colors is on
the right. After matching of the two sides is acheived,
the values of the relative luminan.ces of the primaries are
transformed into coordinates of the CIE triangle.
Although it was not the original purpose of the CIE
detection. ot: simple or monocular contours, since matching
the two sides means that the contour is not visible. (A
monocular contour refers to a border in the visual field
which is detected by differences in hue, saturation and/or
brightness which are visible on. monocular viewing. This
will be distinguished from the concept of a binocular
contour, described in the next chapter.)
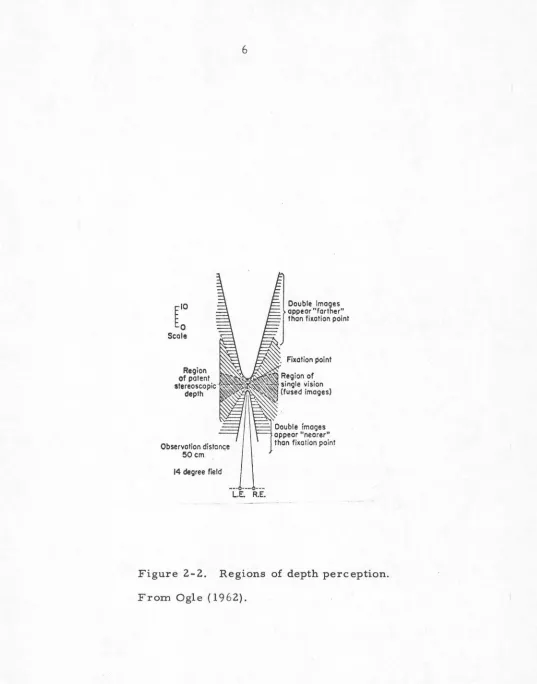
The threshold for detection of a simple contour has
been studied by MacAdam (1942) who measured the chromaticity
coordinates for matching a test stimulus with a fixed
stimulus. The bivariate standard deviation of the error
in matching plotted about the fixed stimulus on the CIE
triangle gave an ellipse which was a measure of the
accuracy of matching. Points outside the ellipse
indicate colors which have a high probability of
being seen distinct from the fixed stimulus. This means
that the border between the two sides of the visual field
is perceived, thus the ellipses indirectly plot the
just-noticeable-difference in the CIE triangle. See figure 3-1.
The sizes and shapes of the ellipses vary because of the
non uniform perceptual scaling of the CIE system.
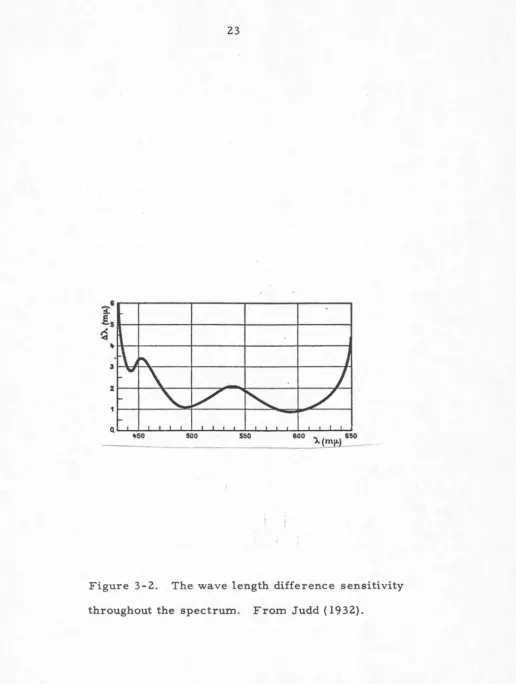
The detection of differences in wavelength as a function
of wavelength over the visible spectrum is shown in figure
3-2 (Judd, 1932). The minimum perceptible wavelength
0.8
0.6
~
500
@
y
0.4
&
$
~
@$
e?'
$
@~
el'
@0.2 ~
ef?
$~
@ $
0
0 0.2 0.4 0.6 0.8
%
Figure 3-1. MacAdam ellipses. The ellipses are the one
standard deviation just noticeable differences for variations
in color about a fixed point (the center of the ellipses).
The size of the ellipses is magnified ten times for clarity.
[image:28.564.7.549.33.730.2]'3: I
!.s
~•
3
1
'
Cl
~50 500 550
Figure 3-2. The wave length difference sensitivity
[image:29.567.25.542.37.722.2]difference corresponds to an ellipse with a cross-section
of this size plotted along the spectrum locus of the CIE
triangle.
The major axes of the MacAdam ellipses approximately
point toward the white point on the CIE diagram. Therefore
the minor axes of the ellipses are approximately the
just-I
noticeable-differences in hue, and the major axes the
just-noticeable-differences in saturation. Noting that the
plot exaggerates the size of the ellipses ten times for
clarity, it is apparent that the monocular perception of
contours requires about 3 nanometers or less difference
across a boundary in the visual field (this can be seen in
figure 3-2 also) or about
5%
difference in the saturation.The experiments to be reported later all use interference
filters for generating colors of very high saturation, and
thus the colors used are on the spectrum locus. This means
that only the resolution of the eye along the hue axis is
important, and the color difference between any adjacent
pair of interference filters used in these experiments is
always larger that the 3 nanometer
just-noticeable-difference quoted (the closest separation used is 15
[image:30.565.15.551.21.748.2]References
Abramov, I. (1968) J. Opt. Soc. Am.
58:
574.DeValois, R. (1965) Cold Spring Harbor Symp. Quant. Biol. JO: 567.
DeValois, R. (1972) Central Mechanisms of Color Vision, in. Handbook of Sensory Physiology, Springer-Verlag, Berlin.
Hubel, D. and T. Wiesel {1968) J. Physiol. 195: 215.
Judd, D. (1932) J. Opt. Soc. Am. 22: 72. MacAdam, D. (1942) J. Opt. Soc. Am. 32: 247.
Marks, W.B., W.H. Dobel1e, and E.F. MacNichol, Jr. (1964) Science, 143: 1181. ·
CHAPTER FOUR
RANDOM DOT STEREO PICTURES
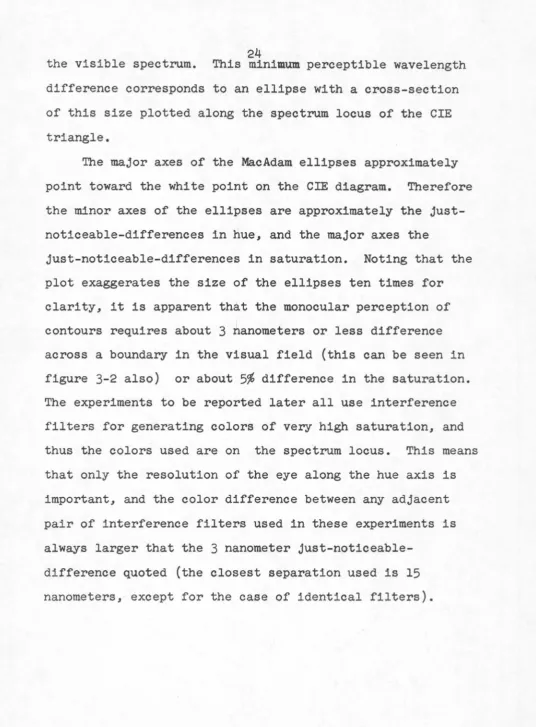
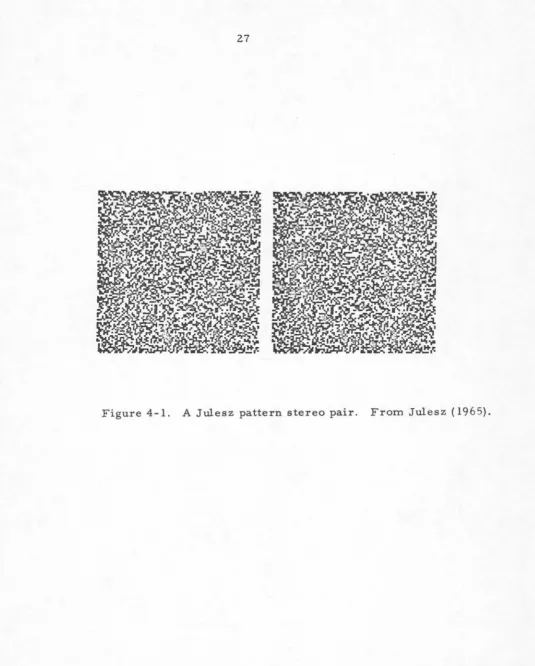
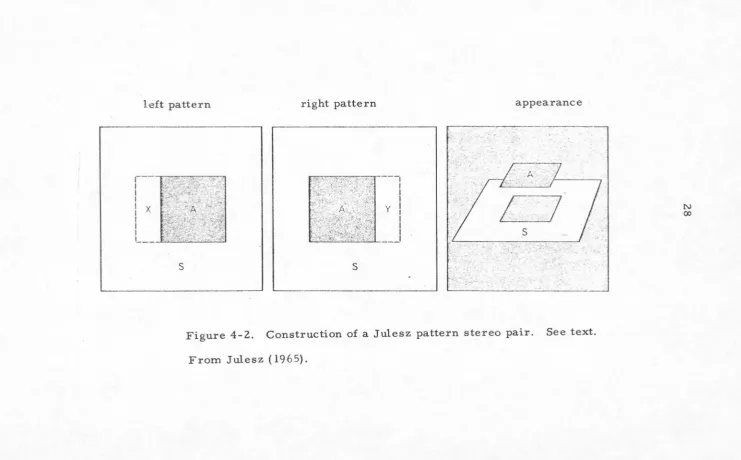
Julesz Patterns
A Julesz pattern stereo pair (Julesz,
1964)
consistsof two patterns (figure
4-1)
each with a grid of one hundredby one hundred squares which are randomly white or black.
(The size of the grid is arbitrary, as are the figures
given below. The actual sizes used are chosen for
convenience.) The right eye pattern is the same as the
left eye pattern., except that part of the center of the left
eye pattern (marked "A" in figure
4-2)
is shifted foursquares to the left and the opened space of
4
by40
squares(marked y in figure
4-2)
is then filled up with more randomsquares. Upon monocular inspection, the patterns are both
random dot arrays. When viewed binocularly, the images
are compared by the visual system, and tnose sections in
which the left and right eye images match are located in
the same depth. Because the correlated center
40
by40
squares are shifted nasally with respect to the surrounding
squares, the center is seen in front of the surround. If
the shift is temporal then the center square is seen in the
back of the surround.
This describes the basic black and white arrays as
I I
I X
I
I
I
I
I_ ti_.:,:~-tr-t~~?~:i-·r· ··.-.... .-..:;-,.~'!'.)
s
---,
I
I
I
y I
I
I I I
r-. ..-... '"""-~-:;:;:. ___ ,·--i~:;-,·--~" .. ~:'.~1 I
s
. .;:·.'
Figure 4-2. Construction of a Julesz pattern stereo pair. See text.
From Julesz ( 1965).
N
[image:34.771.13.755.43.503.2]Kaufman
(1964)
has produced a variation of the basicJulesz technique, by using typewritten letters instead of
squares, and blocks of correlated letters are shifted.
The actual patterns themselves used for these
experiments were produced by computer generated microfilm,
using an. Information International FR-80 which makes direct
negative photographs of a CRT tube face. The control of
the CRT is provided by a program which makes the random
squares by scanning lines on the screen. A random number
generator is used to select the squares which are to be
black, and the center
40
by40
square shift is achieved bymanipulating arrays in the computer. A complementary or
negative pattern is the same as the original pattern
except that white squares are substituted in the
comple-mentary pattern for the black squares of the original, and
black squares for the white. The complementary pattern is
produced by inverting arrays in the computer. After this
operation, the identification of which pattern is the
original or positive and which one is the complementary is
arbitrary.
Monocular and Binocular Contours
At this point a distinction should be made for the
perception of objects which can be seen monocularly, such
as the small squares of the Julesz patterns, which is simple
such as seeing the
40
by40
central square in depth. Thisla.tter perception. is termed stereo or bin.ocular con.tour
detection, and requires central processing in the visual
pathways. Monocular con.tour detection requires no further
information than that already available at the retina of
one eye.
Monocular con.tour detection can be divided into two
types, local and global perception. Local perception. is of
small details, while global perception is for large areas
and complex figures.
We can trace what the visual system D'lust do in order
to see the Julesz stereo pair in. depth. Local perception.
locates the small squares; global perception of many
squares determines the structure of the image which can be
compared with the global perception of the other eye image.
Where agreement is substantial, the images are concluded
to be the same and are perceived as fused in single vision
(subject, of course, to the retinal disparity limitations
discussed above). A:t'ter fusion. is achieved, the amount of
retinal disparity in.vol ved in. each region where f'usion.
occurs is computed and the differential disparity yields
the depth perceived.
Several effects studied by Julesz indicate the
flexibility of the global perception. process as applied to
his patterns.
lo% or one image may be out of focus (locations of the black and white squares are still discernible) and the
stereo contour is still perceived. Hence global perception operates with optical mismatch in local perception.
The left and right eye images maybe adjusted so the correspondence between the two sides is
75'/o
instead of 100%. That is, the distribution of the black and white squares no longer exactly match (aside .from the center shift). For example,25'/o
of the squares, chosen randomly, arereversed from white to black or black to white in one image. The stereo contour is still perceived, as the global
perception process looks for the statistically best matched
features; here one can consider the
25'/o
mismatch noise. Kau.fman's patterns using typewritten letters show thatlocal perception operates on relatively complex objects (compared to the simple squa:res o.f the Julesz patterns).
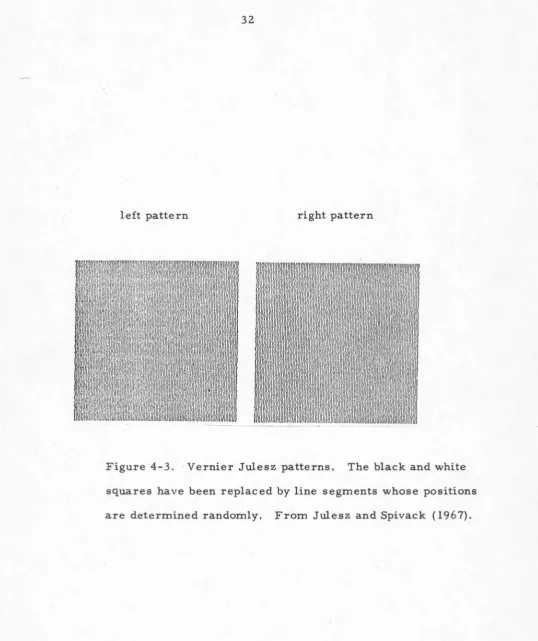
The squares of the Julesz patterns can be replaced by short lines of length equal to the side of the small squares
(Julesz and Spivack, 1967). These are called vernier Julesz patterns and are shown in .figure
4-3.
If each of the small squares of a Julesz pattern is considered ten un~ts wide, then a white square is replaced with a vertical line in the middle of the square. (position5)
A blacksquare is replaced by a vertical line two units to the
right. (position 7) Now when the center shift is performed,
left pattern right pattern
Figure 4-3. ·Vernier Julesz patterns. The black and white
squares have been replaced by line segments whose positions
[image:38.559.7.545.48.689.2]another produce a retinal disparity separate from the
center shift;
5o%
of the line segments in the40
by40
center array will have the same position in the pattern as
the surround after center shift,
25%
will have a smalldisparity corresponding to a nasal shift (positions 7 on
the left with position
5
on the right) and should be seenin front of the surround and
25%
have a disparity which istemporal and thus seen behind the surround (position
5
onleft and position 7 on the right). However, the visual
system does not perform this element by element analysis of
disparities, but matches the entire
40
by40
elementregion, to yield the same percept as for the standard
Julesz pattern of squares, preferring global perception
for depth rather than local perception. The implication
is that depth is perceived by global processes which
receive input from the larger area (in this case) which can
REFERENCES
Julesz, B. (1964) Science, 143: 356
Julesz, B. (1965)Scien.tific American v. 212, no. 2: 38 Julesz, B. and G. Spivack (1967) Science 157: 563
CHAPTER FIVE
BINOCULAR VISION IN REAL LIFE
The visual world in real life is so complicated that
no useful psychophysical experiments have been done using
real images. The experiments and data reviewed on the
previous chapters on depth perception should not leave the
impression that retinal disparity must be an integral part
of depth perception under all circumstances. To put things
into perspective (among other factors), it is useful to
review briefly some of the evidence for visual information
and learning which at times makes disparity insignificant.
Familiarity cues (also called secondary and
psycho-logical cues) such as clarity, overlapping of objects,
shading, geometric perspective, etc., complicate the
physiological cues most of the time. Accomodation and
convergence can be shown to be of little importance in
real life: accommodation alone cannot distinguish the
depths of objects more than a meter from the eye (Peter,
1915). Convergence is of little use distinguishing depths
of objects more than three meters away (Gogel, 1961).
Retinal disparity is by far the most important
physio-logical cue, and is operative to about 600 meters,
assuming minimum detectible disparity of 20 sec arc and
interpupil lary distance of 65 mm (in some special
sec arc).
(Head movements are sometimes regarded as another physiological cue, allowing the observer to move and see which objects in turn obscure other objects. Given
enough movement, this would operate over any range. Head motion is controlled in every visual experiment to some degree; most psychophysical experiments used fixed head position.)
Even at close range, where physiological cues, parti-cularly retinal disparity are clearly operative, the
familiarity cues are probably sufficient most of the time. Persons blind in one eye rarely encounter depth situations which give them trouble; most visual recreations, such as photographs and motion pictures have only flat images, yet with care there is little difficulty in producing what most would describe as a "realistic" image. (The technical difficulties in producing true three dimension.al images, almost always using disparity as the cue, usually result in these displays
dimensional ones.)
being less satisfactory than two
For persons with normal bin.ocular vision, ambiguous interpretations of depth can occur even when viewing objects with all three physiological cues operating. For example, a wire outlinB of a cube, held close can still be made
of reality). This can give rise to a most extraordinary
percept. If the cube is rotated clockwise, it is seen to
move counter-clockwise; the visual and tactile senses
do not agree.
There is a complex interaction between physiological
and familiarity cues. In the experiment just described,
reversing the accurate percept of the wire outline cube is
more difficult to achieve than when looking at a Necker
cube, which is simply a two dimensional drawing of an
outline cube, and physiological cues are inoperative.
The familiarity of an object can prevent accurate
utilization of physiological cues-- for example a stereo
view of a person's face should, when the left and right
images are interchanged, yield a face with the nose seen as
a depression. This is never perceived; the knowledge of
how a face should look is overwhelming, disparity and
other cues notwithstanding.
The importance of retinal disparity as a physiological
cu& to depth perception is because it is the most
signifi-cant unambiguous interpreter of novel stimuli.
Depth perception uses many cues, which are interactive.
At the present state of understanding of the visual system,
disparity is the most important cue accessible to
systematic study. The Julesz patterns have special
impor-tance because they have no familiarity cues, and
References
Gogel, W. (1961) U.S. Army Med. Research Laboratory Report no.
467.
CHAPTER SIX
METHODS
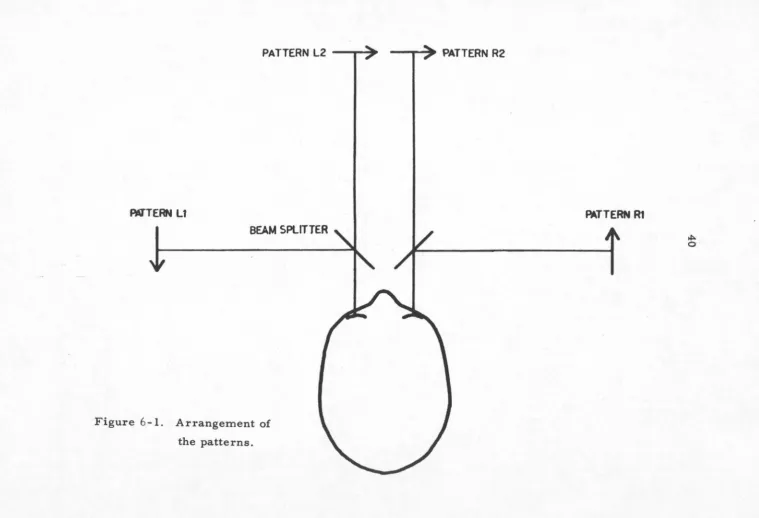
The .following terminology is used in describing the
experiments (re.fer to figure 6-1): Four patterns are used,
two on each side (left and right). For each side, the
patterns are complements of each other-- in photographic
terms, one is a positive (pattern one) and the other a
negative (pattern. two). Superimposed in white light, each
side produces a uniform white field when projected with
the same light source. The individual patterns will be
called le.ft 1, left 2, right 1 and right 2 (Ll, L2, Rl,
R2). Figure 6-1 is a simplified diagram which shows how
the patterns are viewed; the complete optical system is
described below. Ll and Rl are the same except for the
center section shift, as are L2 and R2.
From the perceptual standpoint, there is no discernible
difference between patterns one and two since each is a
100 x 100 element pattern of squares. Thus if pattern. one
is viewed binocularly (pattern two not illuminated) the
center is seen in depth, and the aame is true for pattern
two viewed in the absence of pattern one.
The complete optical system is shown in figure 6-2. In
a typical experiment, Ll and L2 are lined up using the same
I
light for a .field uni.form in appearance. The same is done
AU"TERN Lt
[image:46.778.7.766.24.541.2]BEAM SPLITTER
Figure 6-1. Arrangement of
the patterns.
PATTERN R1
~
Figure 6-2. Diagram of complete optical system used in the experiments. See text.
Figure
6-3A.
Overlay for figure6-3.
H6
PATTERN LZ
LEFT EYE RIGHT EYE
PHOTC'YULTJPLIER W.Z
Figure 6-2. A complete diagram of the optical system.
~
[image:48.779.12.763.57.519.2]• e t
•
•
••
•
-.-=
Q
•
so they converge at infinity optically. Filters for
control of color and luminance are inserted between Ml and Hl (and between Ml' and Hl' and on the right side) for the specific experiment at hand. Holding the luminance of Ll and Rl constant, the subject adjusts the luminance of L2 and R2, by servo driven neutral density wedges (at W' and similarly on the right side; the two servoes are driven in step by electrical interlock). In general, the subject will observe that as the luminance is adjusted, depth is easily perceived when pattern two is dimmer than pattern one; as the luminance of pattern two is increased, a point is reached at which the depth can no longer be perceived, and only when pattern two is at a higher
luminance than pattern one is the percept of depth regained. The criterion for seeing depth is subjective; however there is a simple method of providing a direct comparison between the test stimulus and a stimulus which does have easily perceived depth. This involves simply turning off either pattern one or two, so the images are then seen as some color and luminance against black. This always results in easy depth perception. When the blanked pattern is
turned on again, the subject judges if the depth remains. In practice, it is found that subjects are fairly consistent in their criterion for determining the threshold for depth perception.
(marked "source"). The center of the filament is used for
the light source and the system is telecentrically
illuminated and the fin.al image of the filament is formed
in. the en.trance pupil of the eye (Maxwellian view).
Patterns are aligned with micrometer screws. Luminance and
color are controled tu filters introduced between Ml and Hl
(and similarly for the other channels); neutral density
wedges, marked W and W' are servo driven and normally
controlled by the subject. These wedges provided about
1.7 log units of luminance control. Larger changes in
luminance or matching of luminances in the various channels
are achieved with neutral density filters {Kodak Wratten
filter number 96, various densities). Color is controlled
by the use of interference filters {Balzers type B-40).
For all experiments, the field of view of the patterns
was 10 degrees. The optical distance of the patterns was
one meter {i.e., the image is accomodated one diopter in
from infinity, which all subjects found comfortable). The
field outside the Julesz patterns is not illuminated
{aside from minor scattered light).
The luminance of the patterns is measured by
photo-mul tipliers (RCA 931A) illuminated by the unused light from
beam splitter BS 1. Solenoid driven shutters permitted
light from only one pattern at a time to reach the
photo-multiplier tubes. The voltage drop across the anode and
automatically printed.
Calibration of the readings from the photomultipliers
was done with a Gamma Scientific model 2000 telephotometer,
which measures in absolute foot-lamberts. The photometer
was placed at the eyepiece of the system, after each
experiment, before any changes had been made and readings
of the photometer and the photomultipliers on the apparatus
compared. The telephotometer measured the central 3 degrees
of the field. After correction for the specific response
of the photometer (using the data supplied with the
instrument) and applying a correction factor for the
difference between the exit pupil of the apparatus and the
entrance pupil of the photometer, the comparison.
measure-ments are made for each channel, for each color. A
computer program converts the photomultiplier readings to
absolute foot lamberts. At each step of the process, a
error detection system is used, and tests of the conversion
technique assure accuracy for all the measurements reported
to about 5~, which is acceptable for this type of experiment.
Filters were introduced into the system for the
particular experiment at hand. Pattern one was set to the
highest luminance possible, and then the subject adjusted
pattern two until depth could be perceived. This adjustment
was made so pattern two was lower in luminance than pattern
one and a point was found at which depth could be seen, but
lost. Pattern two was always adjusted from low luminance
upwards. Depending on the transmission of the various
filters, the luminance of pattern two could not at times
be increased sufficiently with respect to the highest
possible luminance of pattern one to prevent depth
percep-tion. These cases required the luminance of pattern one
to be reduced so that depth could not be perceived with
the available luminances of pattern two; again pattern
two was adjusted from low luminance upwards.
There were two possible threshold criteria: the point
where depth CQlJ.djust be seen, and the point where depth could
just ~ be seen. In all the data reported here, the
measurements are for the case where depth could be seen.
The luminances of each channel were used to calculate
the contrast ratio, which is always given as higher
luminance/lower luminance (luminance pattern one/luminance
pattern two).
Experiments began with high luminance in pattern one,
and after an adjustment of pattern two and measurement of
luminances, pattern one was reduced in luminance and
pattern two readjusted, always from a very low luminance
setting. This process was normally repeated until the
patterns were too dim to permit the patterns to be easily
seen (monocularly and binocularly). Typically, the
luminance of pattern on.e would begin at about 250
minutes was required for a series of these measurements with
a given set of colors.
Table 6-1 displays the results of a typical
experiment. Tr.i.e numbers under the column headings Ll, L2,
Rl, R2 are the absolute luminances in foot-lamberts
measured from the four channels respectively.
These results are for an experiment where red
(634
nm)and green (512 nm) were used. The first set of numbers
are for the case of the red at higher luminance, and the
second for the case of green at higher luminance.
The contrast ratio calculated from the luminances of
the channels is shown. in the right hand column. These
contrast ratios are plotted against the log luminance of
the brighter pattern in figure
6-4
for thered-at-higher-luminance data, figure
6-5
for thegreen-at-higher-luminance data. On the graphs, "x" corresponds to the
contrast ratio to the left eye,
"+"
for the right eye, and'' o" for the average.
The average contrast ratios for each graph are
them-selves averaged, to obtain a single number which is then
transferred to the graphs which will be discussed in the
next chapter. Thus each of these two experiments is
reduced to a single point, one for the case of red higher
luminance, one for the case of green higher luminance.
The reduction to a single point is maqe for several
[image:55.565.16.553.25.742.2]Table
6-1.
Measured values or the luminan.ces or patterns one and two at
the threshold ror depth perception, with calculated
contra.st ratio. Pattern one was red
(634
nm) and patterntwo green
(512
nm); red set brighter than green. SubjectCL.
Luminance
Pattern one (red} Pattern two (green)
Contrast ratio (pattern one/ pattern two)
256.47
167.25
104.25
54.40
34.21
22.12
13.08
26.40
1).008.95
4.62
3.86
2.42
1.42
mean contrast ratio
9.78
12.9011.68
11.75
8.80
9.47
9.17
[image:56.564.22.545.29.729.2]Table 6-1, continued
This second set of data is for the reverse case of the data
above. These are the measured values of luminance for the
case green brighter than red.
Luminance, foot lamberts
Pattern one (green)
199.44 97.36 69.00
45.03
30.20
19.30 11.91
Pattern two (red)
151.16
45.38
45.08
31.33
22.15
15.03
7.89
Contrast ratio (pattern one/ pattern two)
1.32
2.17
1.53
1.45
1.37 1.27
1.48
mean contrast ratio
[image:57.568.14.552.29.712.2]/ 53 0 • lf)
.
C\I ~z
a:
0w
• ~ C\I ~a:
a....
a:
w
.__
lJ)~
-
•a:
-ro
"-Jw
u
z
a:
z
0 -• :E -~ _J 1./) D I -.Ci 0 Cl) _J""
~luminance and the required contrast ratio for stereopsis.
Figure 6-4 seems to show a tendency toward lower contrast
ratios at low luminances, but when compared to other graphs
of other experiments, it appears to be only a chance
variation, and many graphs have tendencies toward a slight
positive or negative slope. Experiments with the same
conditions on the same subject at different times have
yielded two curves, one with a slight positive slope, the
other with a slight negative slope. Because of the
subjective criteria employed in these experiments, this kind
of variation is to be expected. In the following chapters,
the data of many subjects will be compared, and the
significance of data is shown not in the specific point to
point numbers, which varies widely between subjects, but
in the general phenomena shown by all subjects.
Image Quality
The monocular alignment {Ll with L2, Rl with R2) was
done by the subject visually aligning the patterns. There
were several minor problems in alignment: the final size
of the image varied with the color used because of the
secondary color aberrations of the achromatic lenses. This
reached about l~ for differences between red {634 nm) and
deep blue {421 nm). This corresponds to about 3/4 of a
square error around the edges of the patterns (the subjects
[image:60.570.23.551.27.735.2]visible. Over the part of the.pattern with the center
square shift, the error thus varied between zero and about
t
square error, not enough to obscure the visibility of thesmall component squares which make up the Julesz patterns.
Pincushion distortion was visible, but was the same
for all patterns and thus did not affect alignment.
Light scattering occurred due to the complexity of
the optical system; as a result, the portions of the
patterns which were nominally not illuminated did have a
small luminance, in all cases less than 2'/, of the illuminated
portions of the patterns.
Alignment of the exit pupils was achieved by viewing
the exit pupils on axis, and adjusting beam splitter BS 1
until they coincided. Small errors were of little
consequence since the exit pupil of the system was smaller
than the entrance pupil of the eye under the dim
light-adapted conditions of the experiment. Subjects were
instructed to keep their heads in a position such that the
apparent brightness of all parts of the image was as high
as possible.
Subjects
All subjects were experienced observers familiar with
the operation of the experimental apparatus but not the
purpose of the experiment initially. All subjects had no
and white Julesz patterns, and were trained to use the
various optical adjustments of the apparatus for alignment
and experiments While maintaining the correct head position
for Maxwellian view exit pupils. Quantitative data were
recorded from five subjects, and qualitative data from an
additional six subjects \'ere used to confirm the basic
effect found, that is the disappearance of depth perception
with patterns having no luminance differences, only color
differences. All persons who passed the initial screening
'
CHAPTER SEVEN
RESULTS
The most important result has already been mentioned,
and was shown for one particular case in chapter 6. This
is the inability of the visual system to see depth when
contours are presented in color differences only; that
luminance differences are required for stereopsis.
The luminance difference required is dependent on
which of the stimulating colors is at a higher luminance.
In the case of red and green
(634
and 512 nanometers)discussed in. chapter 6 for example, depth is perceived
when the green is brighter than the red by a factor
(contrast ratio) of about 1.51, or when red is brighter
than green. by a factor of about 10.5 (subject CL). Between.
these two points, there is a range of contrast ratios where
depth is not perceived. (For subject CL, this range of
contrast ratios is larger than for the other subjects and
was used in chapter 6 for clarity; see below.)
Thus the curves on figure
6-4
and6-5
divide a planeof points corresponding to varying contrast ratios at
varying luminances into two sectors; regions where
depth can be perceived, above the line, and where depth
cannot be perceived, below the line. As described in
chapter 6, the graphs are reduced to a single point, and
graph: a contrast ratio for red brighter than green., and
for green brighter than red. These numbers can. be
regarded as points on a continuous scale of contrast
ratios; see figure 7-1. In the middle of the scale, the
contrast ratio is one, where the red and green. are of
equal luminance. There are three regions on the scale;
one in the center corresponding to contrast ratios where
depth is not perceived, and two regions on either side
where depth is perceived.
The scale can be transferred to a continuous graph
shown in figure
7-2,
where the scale is plotted verticallypassing through the x axis at
512
nm. Here there is arange of colors across the spectrum, let us call these
colors Cl. Red appears in all .the data plotted here, call
this fixed color C2, and a series of scales of the type
shown in figure 7-1 are plott~d, , with the points connected
by the lines. Above the x axis, the contrast ratios are
plotted for patterns with the red (C2) brighter than the
color Cl on the x axis; below the axis, the color on the
axis Cl is brighter than red (C2). The regions of the
scale in figure 7-1 are now areas in the graph; between
the plotted lines, depth is not perceived, above and below
the lines depth is perceived.
Similar plots are shown in figures
7-2
to 7-10, fortwo other values of the color C2, green
(512
nm) and bluehigher luminance luminance
depth region without
perceived
~
depth perception"
10 2 1 2
Contrast ratios
depth
perceived
Figure 7-1. Ranges of depth perception for varying contrast ratios
using red (634 nm) and green (512 nm). Subject CL.
higher luminance
,·
1.11
[image:65.779.10.761.25.535.2]Captions for figures
7-2
to7-11:
[image:66.566.14.547.37.711.2]Subject CL:
figure
7-2
The primary color is7-3
The primary is green7-4
The primary is blueSubject JRC:
figure
7-5
The primary is red7-6
The primary is green7-7
The primary is blueGrouped graphs, for several subjects:
figure
7-8
The primary is red7-9
The primary is green7-10
The primary is bluered
(634
nm)(512
nm)(477
nm)7-11:
A three dimensional surface of contrastACY
I
...
JRC
~
I I I I. J _ _ _ _ J
~ISO lOO
WAVELENGTH NANOHETEllS
Figure 7-8.
(634 nm).
Data from five subjects; the primary color is red
The subjects are identified by the initials.
LMO
[image:73.562.8.548.25.737.2]~---a: "!
...
"' (/') .... (/') ~ CL ti. ~0 "! U.J
a: ,... 2
U.J a: ... CZ:
(/')
=
a: a: Q,. "!0 "' ... 0 ...J 0 J: (/') 550
U.J a: 600 650 700
~
...
... ~
0
~ "?
...
er ~ •
a:
... 6 "!
(/') u 0 •
er
"' I
a:
... z >< "! a: 0
"'
<..J x
I
WAVELENGTH NANOMETERS
a: "!
...
~§
iC
CD "!
,... 2
a:
CZ:
:c
f "!
"'
WAVELENGTH NANOMETERS
Figure 7-9. Data from three subjects; the primary is green (512 nm).
a: "!
...
"'
~ § ACY
(/')
~ iC
U.J CD "!
a: ,... 0
w ~
...
(/')
=
a: a: CL "!
0 "' ... 0 _,
---·
0 "! ....
J:
(/') 0
U.J a:
~r
II()(] ~50 ~ 550 600 650 700a: J:
...
... ~
..
0
~
... er a:
a: c ... c -'
(/') u
~[
er"'
a:
... z x
CZ:
0
<..J x
[image:74.566.16.550.18.726.2](()
ffil
"'
g-a.. a: IO "''=!
w
a: ,.... 0
w er
-... a:
"'
=
er a: 0
Cl. •
IO
~l
~ 0 -' IO :c "'w a:
er
:c ...
...
g
'=! 0 ~ ~ ... CL " ., .,
---
• I • • I•
I I I
1100 1150 500 550 600 650 700
"
..
a: ~
a:
... C> _, '=!
"' u S!
a: "' '
a:
... >< '=!
z a:
IO
"'
u .><
..
'
WAVELENGTH NANOMETERS
•
a: '=!
... !!!
...
csex:
ID '=! JRC
>- 0 a: ! a: '=! Cl. "'
1150 650 700
..
WAVELENGTH NANOMETERS
Figure 7-10. Data from three subjects; the primary is blue (477 nm).
ACY
1150 600 650 700
[image:75.561.15.550.24.729.2]If, for one subject, the three graphs corresponding to C2 equals red, green, and blue are put together, a three dimensional plot can be obtained in the following way: The x axis of the graphs such as figure 7-2 is wavelength of Cl. Figure 7-3, 7-4 are similar but for different wavelengths of C2; a third axis can. be
constructed using this pararne:!;er C2, where figure 7-4 (for .blue, 477 nm) is assigned 477 nm on the y axis, figure 7-3 assigned 512 nm and so on. The result is figure 7-11, based on figures 7-3, 7-4, and 7-5, which shows two wavelength axes Cl and C2 on the horizontal plane, and the contrast ratios are plotted vertically above the x-y plane for the case of y axis color C2 brighter than the x axis color Cl.
If both values of contrast ratios, above and below the x axis of figures 7-2, 7-3, 7-4 were used in figure 7-11, another surface below the x-y plane would be constructed. This is not plotted in figure 7-11 since this second surface is mirror anti-symmetric to the surface above the x-y plane about the line Cl equals C2. This lower curve
plots the case of x axis color Cl brighter than the y axis color C2. Therefore the position of X
=
634, y=
477 nm below the x-y plane is equivalent to the condition y=
6