1
Major depression in children with β-thalassemia major is strongly associated with the number of blood transfusions, iron overload and increased levels of interleukin-1β.
Hussein Kadhem Al-Hakeim a, Asawer Hassan Najmb, Arafat Hussein Al-Dujaili c, Michael Maesd,e,f *.
a Department of Chemistry, College of Science, University of Kufa, Iraq. E-mail:
mail: -E University of Kufa, Iraq. Department of Chemistry, College of Science,
b
c Senior psychiatrist at College of Medicine, University of Kufa, Iraq. E-mail:
d Department of Psychiatry, Faculty of Medicine, Chulalongkorn University, Bangkok, Thailand; e Department of Psychiatry, Medical University of Plovdiv, Plovdiv, Bulgaria;
f IMPACT Strategic Research Centre, Deakin University, PO Box 281, Geelong, VIC, 3220,
Australia.
* Corresponding Author:
Prof. Dr. Michael Maes, M.D., Ph.D., Department of Psychiatry,
Faculty of Medicine, Chulalongkorn University, Bangkok,
2 Thailand
E-mail: [email protected]
3 Abstract
4
5 Introduction
Beta-thalassemia major (β-TM) is a genetic disorder with mutations in the β-globin gene on chromosome 11 resulting in a lack or reduction of the beta-globin chain causing globin chain imbalances [1]. Excess of free α-globin chains in maturing red blood cells may lead to their destruction with consequent anemia [2, 3]. When the thalassemia symptoms are severe and the patients become blood transfusion-dependent the thalassemia is named “thalassemia major” implicating that other organs are or will be affected [4, 5]. β-TM patients have an increased risk for systemic infections, suggesting that a basic defect in the host defense is present [6]. Infections and heart failure are the first two causes of death and hepatic disease is the third most common cause of death in TM [7, 8]. Immune defects in β-TM comprise the innate and the adaptive immune systems including aberrations in cell-mediated immunity, neutrophil chemotaxis, antibody response and decreased activity of T- and B-lymphocytes [6, 9, 10].
6
Intracellular iron accumulation may induce M1 macrophage polarization [19] and increased inflammatory gene expression [20].
Iron chelation therapy, which is used in β-TM to reduce IO, is widely used to prevent the consequences of IO on heart, liver, bones, and immune system [21] but is usually associated with many adverse effects including infections [9, 22]. Some clinicians propose that treatment with vitamin C and folic acid in TM patients may improve erythropoiesis and the secondary deficiencies in these vitamins [23, 24]. The iron status in β-TM patients undergoing blood transfusions can be monitored by noninvasive methods including measurements of serum iron (Fe), which is distributed within the body via plasma transferrin (Tf), a transport protein that mediates iron exchange between tissues, total iron-binding capacity (TIBC), Tf levels, Tf saturation percentage (TS%), unsaturated iron-binding capacity (UIBC) and ferritin levels [25]. Ferritin is the primary storage compound for the body's iron while serum ferritin concentrations offer a reliable index of iron stores and inflammation as well [26-28].
Patients with β-TM show increased vulnerability to develop emotional and behavioral problems and this is further increased in children [29, 30-32]. Many β-TM patients (up to 50%) have some type of mental disorder including depression and anxiety, which are additionally negatively associated with lowered quality of life [30, 32, 33]. Other studies showed high rates (30.8%-49.0%) of depressed mood or major depressive disorder (MDD) in those patients [31, 34, 35]. Moreover, MDD in β-TM is associated with increased suicide attempts, increased social isolation, low school performance, limited life opportunities, maladaptive surviving strategies, and lower physical abilities [34, 36].
7
immune cell phenotypes, including M1 macrophages with elevated levels of interleukin (IL)-1β and tumor-necrosis factor (TNF)-α, T helper (Th)1, Th2 (with increased levels of CCL11 or eotaxin) and T regulatory (Treg) (with increased production of IL-10) cells [38]. As such, MDD is characterized by increased production of pro-inflammatory and neurotoxic products (IL-1β, TNF-α, CCL11) as well as immune-regulatory (IL-10) cytokines, which downregulate the primary inflammatory response and have protective properties [38]. The aggregate of all immune-regulatory components that exert negative feedback on the immune response is named the “compensatory immune-regulatory system” (CIRS) [38]. MDD is also accompanied by iron-related aberrations including the “anemia of inflammation” with lowered levels of iron and Tf, aberrations in the erythron, increased ferritin [39] and maybe ferroptosis [40]. Ferroptosis is a programmed cell death characterized by the accumulation of iron, lipid hydroperoxides and their metabolites in the cytosol, and peroxidation of polyunsaturated fatty acids in the plasma membrane [40-42]. Nevertheless, there are no data whether MDD in β-TM is associated with blood transfusions, iron overload or immune-inflammatory responses.
Hence, the present study was conducted to examine the iron-related and immune-inflammatory biomarkers of children with β-TM with and without MDD versus normal controls. The specific hypothesis is that MDD in children with β-TM is associated with an increased number of blood transfusions leading to increased IO which may cause inflammatory responses and, therefore, MDD.
8
One hundred and eleven Iraqi β-TM male and female children (aged 6-12 years) participated in the present study. The β-TM patients were recruited at the Thalassemia Unit at Al-Zahra'a Teaching Hospital, Najaf, Iraq. The diagnosis of β-TM was made by pediatricians according to the 2019 ICD-10-CM Diagnosis Code D56.1. The diagnosis was based on the clinical symptoms (including severe anemia, hepato-splenomegaly, and abnormal bone growth), hematological parameters (including hemoglobin <7g/dl; microcytic hypochromic RBCs with anisopoikilocytosis and increased reticulocyte percentage), and Hb HPLC (VARIANTTM β-Thalassemia Short Program).
Fifty-five apparently healthy children (28 male and 27 female) were selected as control group and their age ranges were comparable to that of the patients. None of these subjects was anemic or had an obvious systemic or inflammatory disease. We excluded patients or controls with splenectomy, systemic diseases such as diabetes mellitus, hypertension, renal failure or patients with overt inflammation defined as serum C-reactive protein (CRP) levels > 6mg/l. In addition, the exclusion of subjects with serum CRP > 6mg/l indicates that increased levels of ferritin are probably associated with IO rather than with an acute phase response [43].
9
erythropoiesis. The patients were administered One-alpha capsules when the patients had calcium metabolism disorder due to reduced 1-α hydroxylation.
Symptoms of depression were measured using the Children’s Depression Inventory (CDI), a self-rating screening tool with 27 items rated on a 3-point scale [44]. For each item, the children are asked to select the response that best describes their feelings in the preceding two weeks. The total CDI score was used as an index of severity of depression and children were considered depressed when the total CDI score was ≥19. The CDI score is validated in children and is one of the most commonly used screening methods for childhood depression [45]. β-TM patients were classified into two groups according to the presence or absence of MDD. The β-TM with MDD subgroup comprised 54 patients (29 male, and 25female ) while the β-TM without MDD subgroup comprised 57 patients (24 male, and 33 female).
Written informed consent was obtained from the patients’ first-degree relatives (mother or father). The study was approved by the IRB of University of Kufa number 487/2018.
Assays
10
instrument (BioMérieux Co., France). The interassay CV% of ferritin was <5.70% and for iron <2.19%. Unsaturated Iron binding capacity (UIBC) was calculated from the following formula: UIBC= TIBC - serum iron concentration [46]. Transferrin saturation percentage (TS%) was calculated from the following equation: TS% = Iron × 100/TIBC [47]. Transferrin concentrations were estimated from the percentage of transferrin saturation and serum iron using the formula: Tf (g/L)= serum iron (µmol/L) /(3.98 X TS%). The formula is based on the maximal binding of 2 molFe3+/mol of transferrin and a molecular weight of 79,570 fortransferrin [43].
Commercial ELISA sandwich kits (Elabscience, Inc. CA, USA) were used to measure serum CCL11, IL-1β, IL-10 and TNF-α using an ELISA microplate reader from Biotek (USA) and Biotek software (KC4TM). No significant cross-reference with analogues is observed. For samples with highly concentrated biomarkers, we used sample dilution as required. All assyas were run in duplicate. The intra-assay coefficients of variation (CV) (precision within-assay) were < 7.0%. There were no missing values in the data set. Serum CRP was measured using a kit supplied by Spinreact®, Spain. The test is based on the principle of latex agglutination.
Statistical analysis
Analysis of variance (ANOVA) was employed to assess differences in scale variables between diagnostic categories and analysis of contingency tables (χ2-test) was used to check
associations between nominal variables. Associations among variables were computed using Pearson’s product-moment and Spearman’s rank-order correlation coefficients. We used
11
means. Model-generated estimated marginal mean (SE) values were computed after adjusting for covariates. Multiple comparisons and correlations were corrected for false discovery rate (FDR) [48]. Multiple regression analysis was used to delineate the significant biomarkers that are associated with the CDI total score and the results of those analyses were checked for multicollinearity (tolerance and VIF values) and homoscedasticity (White and Breusch-Pagan tests). Binary logistic regression analysis was used to delineate the important explanatory variables that predict MDD (versus no MDD as reference group). All analyses were bootstrapped (2000 bootstrap samples) and the bootstrapped results are reported in case there would be a difference between the classical and bootstrapped approach. In order to normalize the data distribution of the immune and iron biomarkers (tested with the Kolmogorov-Smirnov test) we processed IL-1β in Ln transformation and TNF-α, CCL11, UIBC and ferritin in square root (sqr) transformation. We computed two relevant z unit-weighted composite scores, namely comp1 (indicating M1 macrophage activation) computed as z sqr TNF-α + z Ln IL-1β; and comp2 (indicating M1/CIRS ratio) computed as z (z sqr TNF-α + z Ln IL-1β) – z IL-10. All tests were 2-tailed and a p-value of 0.05 was used for statistical significance. All statistical analyses were performed using IBM SPSS windows version 25, 2017.
12
Cronbach’s alpha > 0.7, composite reliability > 0.7, rho_A > 0.8, average variance extracted (AVE) > 0.5; and all outer model factor loadings > 0.6 at p<0.001 [49]. Using complete consistent PLS (5000 bootstrap samples), path coefficients with exact p-values and total effects, total indirect and specific indirect effects are computed.
Results.
1. Socio-demographic data
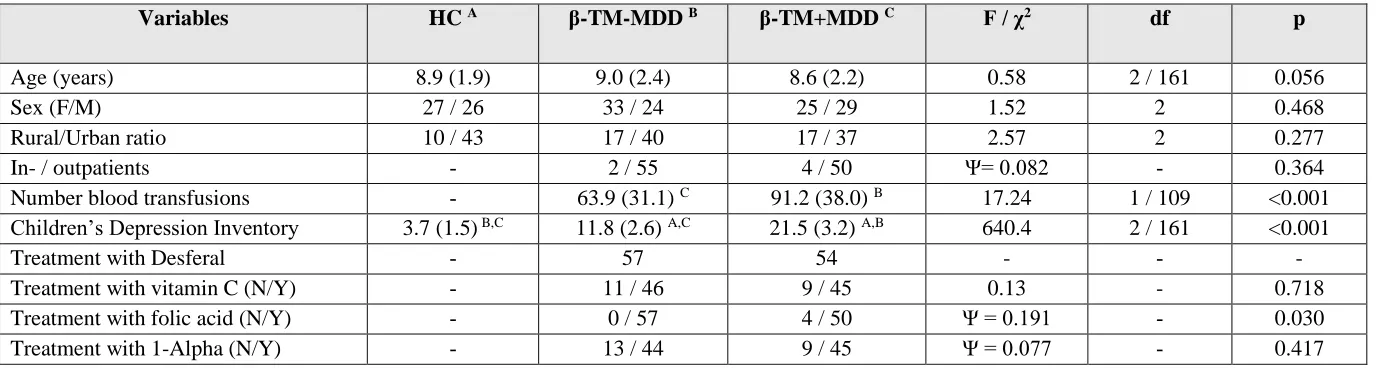
Table 1 shows the socio-demographic and clinical data in the children participating in the current study. There were no significant differences in age, sex ratio, rural/urban ratio between healthy children and β-TM children with and without MDD. The in- vs outpatient ratio did not differ between both β-TM subgroups. β-TM children with MDD had significantly more blood transfusions than those without MDD. The CDI score was significantly different between the three subgroups and increased from controls → β-TM without MDD and → TM with MDD. All β-TM children were treated with Desferal while there were no significant differences between both TM groups with and without MDD in use of vitamin C and one-alpha drug. All patients with
β-TM without MDD were treated with folic acid, while four of the depressed β-β-TM patients did not receive folic acid.
13 2. Iron status and β-TM with and without MDD
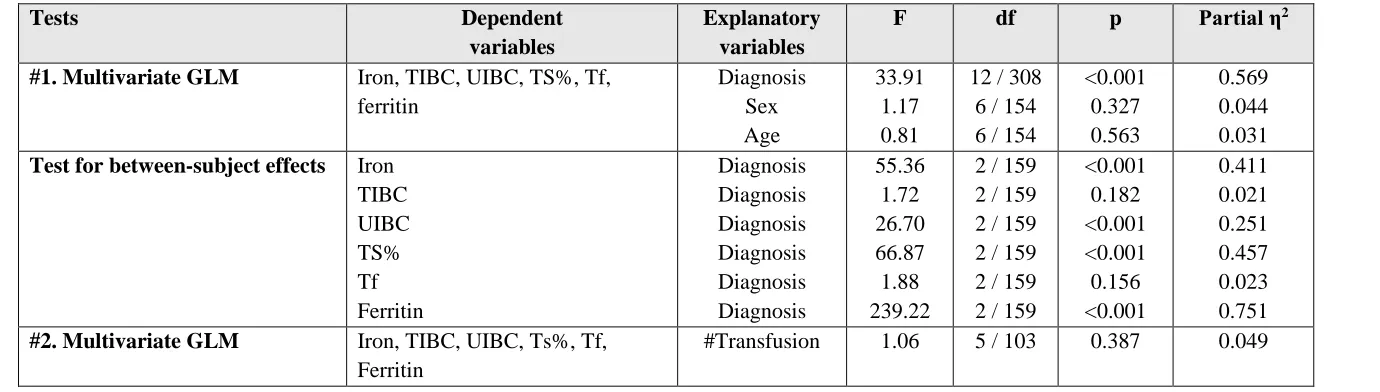
Table 2 shows the results of multivariate GLM analysis with the 6 iron status variables (Fe, TIBC, UIBC, TS%, Tf and ferritin) as dependent variables and diagnosis (controls versus β-TM without MDD versus β-β-TM with MDD) as explanatory variables while adjusting for age and sex. We found that there was a significant association between diagnosis and iron status variables with an effect size of 0.569 while there were no significant effects of age and sex. Tests for between-subject effects showed that there were significant associations between diagnosis and iron (effect size: 0.411), UIBC (effect size: 0.251), TS% (effect size: 0.457) and ferritin (effect size: 0.751). The mean ferritin values were very high in both β-TM groups (> 2000 ng/mL) and all patients had serum ferritin values > 1000 ng/mL, except three cases (834, 924 and 884 ng/mL).
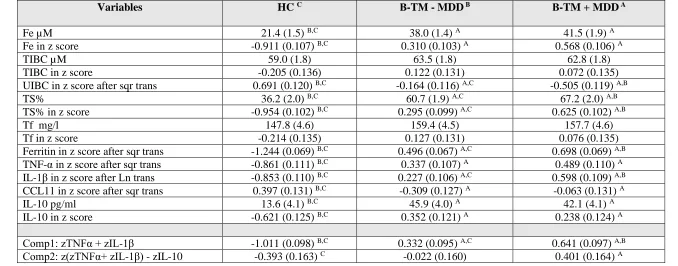
Table 3 shows the model-generated estimated mean (SE) values of the iron state variables in the three study groups. Iron was significantly increased in β-TM versus normal controls. TS%, ferritin, and UIBC showed significant differences between the three study groups with TS% and ferritin increasing from controls → β-TM without MDD → β-TM with MDD, while UIBD decreased from controls to β-TM with MDD. Regression #2 in Table 2 shows that there were no significant effects of the number of blood transfusions on the iron status data in subjects with β-TM.
3. Immune variables and β-TM with and without MDD
14
effect size of 0.372 while age and sex had no significant effects. Tests for between-subject effects showed significant associations between diagnosis and TNF-α (effect size: 0.361), IL-1β (effect size: 0.375), CCL11 (effect size: 0.088), IL-10 (effect size: 0.189), Comp1 score (effect size: 0.507) and Comp2 score (effect size: 0.068). Table 3 shows the model-generated estimated marginal means of the immune markers in the three study groups. IL-1β and the Comp1 composite score were significantly different between the three groups and increased from controls → β-TM without MDD → β-TM with MDD. TNF-α and IL-10 were significantly higher in both β-TM groups as compared with controls, while CCL11 was significantly lower in both β-TM groups as compared with controls. The composite score Comp2 was significantly higher in children with β-TM with MDD than in controls, while β-β-TM children without MDD occupied an intermediate position.
4. Prediction of MDD using iron status and immune biomarkers
Table 5 shows the results of three different binary logistic regression analysis with β-TM with MDD as dependent variable (and β-TM without MDD as the reference group). The first regression analysis in Table 5 shows that MDD was significantly predicted by the number of transfusions with an odds ratio of 2.93 and a Nagelkerke effect size of 0.180. Regression #2 shows the outcome of binary regression analysis with number of transfusions and all 6 iron state variables (and age and sex) as explanatory variables. We found that MDD was best predicted by the number of transfusions and TS% with a Nagelkerke value of 0.233; 77.5% of all β-TM children were correctly classified with a sensitivity of 70.4% and a specificity of 84.2%.
15
found that number of transfusions, TS% and IL-1β best predicted MDD with a Nagelkerke effect size of 0.286 whereby 77.8% of all β-TM children were correctly classified with a sensitivity of 72.2% and a specificity of 77.2%.
5. Iron status, immune biomarkers, and the CDI
Pearson’s correlation analyses performed in the total study group showed significant associations between the CDI score and IL-1β (r=0.561, p<0.001, all n=164), TNF-α (r=0.531, p<0.001), IL-10 (r=0.319, p<0.001), CCL11 (r=-0.185, p=0.018), and the comp1 (r=0.644, p<0.001) and comp2 (r=0.264, p=0.001) composite scores. In the restricted study group of subjects with β-TM there were additional associations between the CDI score and IL-1β (r=0.262, p=0.005,
n=111) and comp1 score (r=0.285, p=0.002). Pearson’s correlation analyses performed in the total study group also showed significant associations between the CDI score and Fe (r=0.544, p<0.001, all n=164), UIBC (r=-0.411, p<0.001), TS% (r=0.563, p<0.001), and transferrin (r=-0.727, p<0.001), although no significant associations were detected in the restricted study group of β-TM children.
16
examine the combined effects of the significant explanatory variables (as established in regressions #1, #2 and #3) on the severity of depression scale score and found that 68.0% of the variance in CDI score was explained by number of transfusions, the composite score Comp1, ferritin, and iron. Regression #5 shows that in the restricted study sample of children with β-TM, the CDI score was predicted by number of transfusions combined with the Comp1 composite score and in addition use of folic acid (inversely associated), whereas the iron state variables had no significant effect.
Regressions #6 - #10 show the outcome of multiple regression analyses with the immune biomarkers as dependent variables and the iron state variables and number of transfusions (and age and sex) as explanatory variables. We found that 43.9% of the variance in the composite score Comp1 was explained by the regression on ferritin and TS%. Regression #7 shows that 32.4% of the variance in 1β was explained by the number of transfusions, ferritin, and TS%. TNF-α, IL-10 (both positively) and CCL11 (inversely) were all three associated with ferritin levels. After removing ferritin from the analysis, it appeared that TS% was the second most important predictor of these cytokines/chemokines.
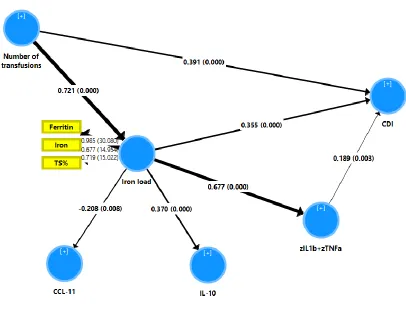
6. Results of PLS analysis
17
the variance in the CDI score was explained by the direct effects of number of transfusions, iron load, and the composite score comp1. There were also direct effects of iron load on IL-10 (positively) and CCL11 (inversely) but these 2 cytokines/chemokines were not associated with the CDI score. Moreover, 52.0% of the variance in the iron load LV was explained by number of transfusions. There were specific indirect effects of number of transfusions on the CDI score mediated by iron load LV (t=+3.84, p<0.001) and by the path from iron load to the composite score comp1 (t=2.88, p=0.004). There were also specific indirect effects of number of transfusions on CCL11 (t=-2.63, p=0.009), IL-10 (t=6.13, p<0.001) and the composite score comp1 (t=+8.42, p<0.001), which were all mediated by the iron load LV. Finally, there was also an indirect effect of the iron load LV on the CDI score which was mediated by comp1 (t=2.88, p=0.004). As such, the CDI score was highly significantly predicted (total effects) by iron load LV (t=7.29, p<0.001), number of transfusions (t=19.12, p<0.001) and comp1 (t=2.94, p=0.003). The latter was highly significantly predicted by number of transfusions (total effects: t=8.42, p<0.001) and iron load (t=11.97, p<0.001).
Discussion
18
Our study showed that blood transfusions were significantly associated with increased IO in β-TM, including higher serum iron, TS%, and ferritin as compared with controls. Our results are in line with previous results reporting a significant elevation in serum iron in β-TM patients as compared with healthy controls [25, 54]. The predominant mechanisms driving the iron loading process includes transfusion therapy and enhanced intestinal absorption as a consequence of the impairments in erythropoiesis [51]. Increased ferritin levels are associated with iron-related damage to tissues including liver and heart [54], which is not only related to increased oxidative stress but also to the direct effects of IO on the tissues.
19
activation, the current study found that increased iron load may be a cause of MDD in β-TM patients who underwent repeated blood transfusions.
TM patients are dependent on regular blood transfusions which are applicated to attenuate the complications of anaemia and expand bone marrow, although repeated blood transfusions are associated with excessive iron absorption, IO, a chronic hypoxic state, and neurotoxicity due to lifelong chelating therapy while all these factors together may lead to brain dysfunction [57]. Metafratzi et al. (2001) reported that, in patients with β-TM, increased iron deposition may be observed in the putamen, caudate nucleus, and motor and temporal cortex, which are important for cognitive functions including implicit and explicit memory [58]. The damage to the nervous system in those patients may be attributed to many factors acting as cumulative minor injuries over many years including hemolysis and repeated blood transfusions, which lead to a decrease in nitric oxide levels and IO in the brain [59]. The latter, in turn, may lead to oxidative stress aggravating brain tissue damage [60]. Moreover, accumulation of intracellular iron may cause DNA fragmentation, which may ultimately damage lymphocyte functions, leading to immune dysfunction and increased susceptibility to infections in β-TM patients [61].
20
β-TM patients, namely that T cells show a stimulated phenotype while in fact their activity is suppressed [65]. As described in the Introduction, IO is associated with immune-inflammatory responses, M1 macrophage polarization and increased TNF-α expression due to IO and antigenic stimulation induced by chronic transfusion therapy [18-20]. Moreover, chelation therapy may further increase the inflammatory burden by lowering the iron pool thereby augmenting the transcription of IL-1β [66]. Multiple blood transfusions in β-TM patients may explain that the immune system is under constant alloantigen stimulation, despite the suppressed immune responses due to IO [67]. IO also causes neuroinflammation that leads to the upregulation of divalent metal transporter-1 on the surface of astrocytes, microglia and neurones, making them highly sensitive to IO in the presence of high levels of non-transferrin bound iron [40].
21
intracellular hepcidin to reduce intracellular iron content [74]. Therefore, it could be suggested that the lack of an appropriate IL-10 response in children with β-TM and MDD contributes to a greater impact of the neurotoxic effects of TNF-α and IL-1β. Moreover, the increased levels in TNF-α without a simultaneous response in IL-10 may cause decreased differentiation of erythroid cells leading to exacerbation of ineffective erythropoiesis in β-TM [75]. Activated macrophages may selectively phagocytose apoptotic erythroid precursors, thereby contributing to ineffective erythropoiesis [76]. Although an increase in CCL11 is sometimes reported in MDD patients [77-79], this study found no specific alterations in this cytokine in β-TM with MDD.
Limitations of the study.
Firstly, this is a case-control study and, therefore, the possible causal associations established here should be checked in future prospective studies. Second, it would have been more interesting if we had measured a complete panel of pro-inflammatory and CIRS cytokines as well as oxidative and nitrosative stress biomarkers. Third, our results show that treatment with folic acid may have some protective effects by attenuating the CDI score. Nevertheless, our results show that current treatment modalities with folic acid and vitamin C are insufficient to attenuate IO and immune-inflammatory responses and, therefore, to prevent MDD. Future research should examine the effects of other natural anti-inflammatory and anti-oxidant substances (NAIOSs) including curcumin and N-acetyl-cysteine [80] in preventing the onset of MDD in children with β-TM.
Conclusions
22
an increased number of blood transfusions explain 68.8% of the variance in the CDI score (and by inference are associated with MDD); b) immune activation mediates in part the effects of iron overload on the CDI score; c) the effects of blood transfusions on the CDI score are in part mediated by effects of iron overload and the path from iron load to immune activation; and d) blood transfusions have also direct effects on the CDI score suggesting that other factors not related to iron overload or immune activation may be involved, for example, psychosocial stressors. Regular screening for depressive symptoms in patients with β-TM undergoing blood transfusions is indicated to provide appropriate medical and psychological support to improve both emotional and physical health [36]. Clinicians should be aware that IO may be a possible cause of psychiatric illness including MDD and that IO may be treated using chelation therapy [81].
Acknowledgment
We thank the staff of the Thalassemia Unit at Al-Zahra'a Teaching Hospital-Najaf city-Iraq for their help in the collection of samples. We also acknowledge the work of the highly-skilled staff of the Asia Laboratory in measuring the biomarkers.
Funding
There was no specific funding for this specific study.
Conflict of interest
23 Author’s contributions
All the contributing authors have participated in preparation of the manuscript.
References
1. Thein SL (2013) The Molecular Basis of β-Thalassemia. Cold Spring Harb Perspect Med 3(5): a011700.
2. Hagag AA, El-Shanshory MR, AboEl-Enein AM (2015) Parathyroid function in children with beta thalassemia and correlation with iron load. Adv Pediatr Res;2:3.
3. Wahidiyat PA, Sastroasmoro S, Fucharoen S, Setianingsih I, Putriasih S (2018) Applicability of a clinical scoring criteria for disease severity of ß-thalassemia/ hemoglobin E in Indonesia. Med J Indones 27:26-32.
4. Cao A, Galanello R (2010) Beta-thalassemia. Genet Med 12(2):61-76.
5. Al-Hakeim HK, Al-Khakani MM, Al-Kindi MA (2015a) Correlation of hepcidin level with insulin resistance and endocrine glands function in major thalassemia. Adv Clin Exp Med 24(1):69-78.
6. Javad G, Saeid A (2011) Mohammadmehdi N. thalassemia and immune system dysfunction-review article. IJCR (12)3:105-108.
7. Ladis V, Chouliaras G, Berdousi H, Kanavakis E, Kattamis C (2005) Longitudinal study of survival and causes of death in patients with thalassemia major in Greece. Ann N Y Acad Sci 1054:445-50.
24
9. Farmakis D, Giakoumis A, Polymeropoulos E, Aessopos A (2003) Pathogenetic aspects of immune deficiency associated with beta-thalassemia. Med Sci Monit 9(1):RA19-22.
10. Ghaffari J, Vahidshahi K, Kosaryan M, Soltantooyeh Z, Mohamadi M (2011) Humeral immune system state in β thalassemia major. Med Glas Ljek Komore Zenickodoboj kantona 8(2): 192-196.
11. Capellini M, Cohen A, Eleftheriou A. Guidelines for the clinical management of thalassemia (2nd revised edition), Nicosia. 2008.
12. Hamed AA, Elguindy W, Elhenawy YI, Ibrahim RH (2016) Early cardiac involvement and risk factors for the development of arrhythmia in patients with β-thalassemia major. J Pediatr Hematol Oncol 38(1):5-11.
13. Daher R, Manceau H, Karim Z (2017) Iron metabolism and the role of the iron-regulating hormone hepcidin in health and disease. La Presse Médicale 46(12):e272-8.
14. Walker EM Jr, Walker SM (2000) Effects of iron overload on the immune system. Ann Clin Lab Sci 30(4):354-65.
15. Ezer U, Gulderen F, Culha VK, Akgül N, Gürbüz O (2002) Immunological status of thalassemia syndrome. Pediatr Hematol Oncol 19:51-58.
16. Gharagozloo M, Bagherpour B, Tahanian M, Oreizy F, Amirghofran Z, Sadeghi HM, Hourfar H, Moayedi B. (2009a) Premature senescence of T lymphocytes from patients with beta-thalassemia major. Immunol Lett. 122:84-88.
25
18. Wessling-Resnick M (2010) Iron Homeostasis and the Inflammatory Response. Annu Rev Nutr 30: 105–122.
19. Zhou Y , Que K, Zhang Z, Yi ZJ, Zhao PX, You Y, Gong J, Liu Z (2018) Iron overloaded polarizes macrophage to proinflammation phenotype through ROS/acetyl‐p53 pathway. Cancer Med 7(8): 4012–4022.
20. Maras JS, Das S, Sharma S, Sukriti S, Kumar J, Vyas AK, Kumar D, Bhat A, et al (2018) Iron-Overload triggers ADAM-17 mediated inflammation in Severe Alcoholic Hepatitis.Sci Rep 8(1):10264.
21. Hammond J, Thompson AA, Fogel MA, Hammond K, Kokroko J, Kwiatkowski JL (2019) Combination Oral Chelation in Adult Patients With Transfusion-dependent Thalassemia and High Iron Burden. J Pediatr Hematol Oncol 41(1):e47-e50.
22. Shah FT, Sayani F, Trompeter S, Drasar E, Piga A (2019) Challenges of blood transfusions in β-thalassemia. Blood Rev 100588. doi: 10.1016/j.blre.2019.100588.
23. Sherief LM, Abd El-Salam SM, Kamal NM, El Safy O, Almalky MA, Azab SF, Morsy HM, Gharieb AF (2014) Nutritional biomarkers in children and adolescents with Beta-thalassemia-major: An Egyptian center experience. Biomed Res Int 2014:261761.
24. Baghersalimi A, Hemmati Kolachahi H, Darbandi B, Kamran Mavardiani Z, Alizadeh Alinodehi M, Dalili S, Hassanzadeh Rad A (2018) Assessment of serum folic acid and homocysteine in thalassemia major patients before and after folic acid supplement cessation. J Pediatr Hematol Oncol 40(7):504-507.
26
26. Cook JD, Lipschitz DA, Miles LEM, Finch CA (1974) Serum ferritin as a measure of iron stores in normal subjects. Am J Clin Nutr 27:681-687.
27. Maes M, Bosmans E, Scharpé S, Hendriks D, Cooremans W, Neels H, De Meyer F, D'Hondt P, Peeters D (1997) Components of biological variation in serum soluble transferrin receptor: relationships to serum iron, transferrin and ferritin concentrations, and immune and haematological variables. Scand J Clin Lab Invest 57(1):31-41.
28. Moris W, Verhaegh P, Jonkers D, Deursen CV, Koek G (2019) Hyperferritinemia in nonalcoholic fatty liver disease: iron accumulation or inflammation? Semin Liver Dis doi: 10.1055/s-0039-1693114.
29. Keskek SO, Kirim S, Turhan A, Turhan FG (2013) Depression in subjects with beta-thalassemia minor. Ann Hematol 92:1611-1615.
30. Messina G, Colombo E, Cassinerio E, Ferri F, Curti R, Altamura C, Cappellini MD (2008) Psychosocial aspects and psychiatric disorders in young adult with thalassemia major. Intern Emerg Med 3:339-343.
31. Khoury B, Musallam KM, Abi-Habib R, Bazzi L, Ward Z, Succar J, Ward ZA, Succar J, et al (2012) Prevalence of depression and anxiety in adult patients with ß-thalassemia major and intermedia. Int J Psychiatry Med 44:291-303.
32. Yengil E, Acipayam C, Kokacya MH, Kurhan F, Oktay G, Ozer C (2014) Anxiety, depression and quality of life in patients with beta thalassemia major and their caregivers. Int J Clin Exp Med 7:2165-72.
27
34. Ghanizadeh A, Khajavian S, Ashkani H (2006) Prevalence of psychiatric disorders, depression, and suicidal behavior in child and adolescent with thalassemia major. J Pediatr Hematol Oncol 28(12): 781-784.
35. Shafiee A, Nazari S, Jorjani S, Bahraminia E, Sadeghi-Koupaei M (2014) Prevalence of depression in patients with β-thalassemia as assessed by the Beck's Depression Inventory. Hemoglobin 38(4):289-291.
36. Koutelekos J., Haliasos N (2013) Depression and thalassemia in children, adolescents and adults. Health Sci J 7(3):239-246.
37. Maes M, Stevens W J, Declerck L S., Bridts CH, Peeters D, Schotte C, Cosyns P. (1993) Significantly increased expression of T-cell activation markers (interleukin-2 and HLA-DR) in depression: further evidence for an inflammatory process during that illness. Prog. Neuropsychopharmacol. Biol. Psychiatry 17:241-255.
38. Maes M, Carvalho AF (2018) The Compensatory Immune-Regulatory Reflex System (CIRS) in Depression and Bipolar Disorder. Mol Neurobiol 55(12):8885-8903.
39. Maes M, Van de Vyvere J, Vandoolaeghe E, Bril T, Demedts P, Wauters A, Neels H (1996) Alterations in iron metabolism and the erythron in major depression: further evidence for a chronic inflammatory process.J Affect Disord 40(1-2):23-33.
40. Morris G, Berk M, Carvalho AF, Maes M, Walker AJ, Puri BK (2018) Why should neuroscientists worry about iron? The emerging role of ferroptosis in the pathophysiolaogy of neuroprogressive diseases, Behav Brain Res 341:154-175.
28
42. Yang WS, Stockwell BR (2016) Ferroptosis: Death by Lipid Peroxidation. Trends Cell Biol 26(3):165-176.
43. Kennedy A, Kohn M, Lammi A, Clarke S (2004) Iron status and haematological changes in adolescent female inpatients with anorexia nervosa. J Paediatr Child Health 40:430-432.
44. Kovacs M. Children’s Depression Inventory Manual. New York, NY: Multi-health Systems; 1992.
45. Stockings E, Degenhardt L, Lee YY, Mihalopoulos C, Liu A, Hobbs M, Patton G (2015) Symptom screening scales for detecting major depressive disorder in children and adolescents: a systematic review and meta-analysis of reliability, validity and diagnostic utility. J Affect Disord. 174:447-63.
46. Tietz NW, Rinker AD, Morrison SR (1994) When is a serum iron really a serum iron? The status of serum iron measurements. Clin Chem 40(4):546-51.
47. McLaren CE, Li KT, Gordeuk VR, Hasselblad V, McLaren GD (2001) Relationship between transferrin saturation and iron stores in the African American and US Caucasian populations: analysis of data from the third National Health and Nutrition Examination Survey. Blood 98(8):2345-51.
48. Benjamini Y, Hochberg Y (1995) Controlling The False Discovery Rate - A Practical And Powerful Approach To Multiple Testing. J Royal Statis Soc B 57:289-300.
49. Ringle CM, Wende S, Becker J-M (2015) SmartPLS 3. Bönningstedt: SmartPLS. Retrieved from http://www.smartpls.com
29
51. Taher AT, Saliba AN (2017) Iron overload in thalassemia: different organs at different rates. Hematology Am Soc Hematol Educ Program 2017(1):265-271.
52. Telfer P, Constantinidou G, Andreou P, Christou S, Modell B, Angastiniotis M (2005) Quality of life in thalassemia. Ann N Y Acad Sci 1054: 273-282.
53. Alsubaie SS, Almathami MA, Abouelyazid A, Alqahtani MM (2018) Prevalence of depression among adults with sickle cell disease in the southern region of Saudi Arabia. Pak J Med Sci 34(4):929-933.
54. Suriapperuma T, Peiris R, Mettananda C, Premawardhena A, Mettananda S (2018) Body iron status of children and adolescents with transfusion dependent β-thalassaemia: trends of serum ferritin and associations of optimal body iron control. BMC Res Notes 11:547.
55. Richardson AC, Heath AM, Haszard JJ, Polak MA, Houghton LA, Conner TS (2015) Higher body iron is associated with greater depression symptoms among young adult men but not women: Observational Data from the Daily Life Study. Nutrients 7(8): 6055-6072.
56. Rybka J, Kędziora-Kornatowska K, Banaś-Leżańska P, Majsterek I, Carvalho LA, Cattaneo
A, Anacker C, Kędziora J (2013) Interplay between the pro-oxidant and antioxidant systems
and proinflammatory cytokine levels, in relation to iron metabolism and the erythron in depression. Free Radic Biol Med 63:187-194.
57. Poggiali E, Cassinerio E, Zanaboni L, Cappellini MD (2012) An update on iron chelation therapy. Blood Transfus 10:411-422.
30
59. El-Alameey IR, Alzaree F, Shehata MA, Shady MMA, Atti MA, El-Khonezy MI (2019) Neurocognitive function and its related potentials in children with beta thalassemia major: An Egyptian study. Open Access Maced J Med Sci 7(3):322-328.
60. Borgna-Pignatti C, Cappellini MD, De Stefano P, Del Vecchio GC, Forni GL, Gamberini MR, Ghilardi R, Origa R, et al (2005) Survival and complications in thalassemia. Ann N Y Acad Sci 1054:40-47.
61. Shaw J, Chakraborty A, Nag A, Chattopadyay A, Dasgupta A, Bhattacharyya M (2017) Intracellular iron overload leading to DNA damage of lymphocytes and immune dysfunction in thalassemia major patients. Eur J Haematol 99(5):399-408.
62. Lombardi G, Matera R, Minervini MM, Cascavilla N, D’Arcangelo P, Carotenuto M, Di Giorgio G, Musto P (1994) Serum levels of cytokines and soluble antigens in polytransfused patients with beta-thalassemia major: relationship to immune status. Haematologica 79:406-412.
63. Atasever B, Ertan NZ, Erdem-Kuruca S, Karakas Z (2006) In vitro effects of vitamin C and selenium on NK activity of patients with beta-thalassemia major. Pediatr Hematol Oncol 23(3):187-97.
64. Balouchi S, Gharagozloo M, Esmaeil N, Mirmoghtadaei M, Moayedi B (2014) Serum levels of TGFβ, IL-10, IL-17, and IL-23 cytokines in β-thalassemia major patients: the impact of silymarin therapy. Immunopharmacol Immunotoxicol 36(4):271-274.
31
66. O'Brien-Ladner AR, Nelson SR, Murphy WJ, Blumer BM, Wesselius LJ (2000) Iron is a regulatory component of human IL-1beta production. Support for regional variability in the lung. Am J Respir Cell Mol Biol 23(1):112-119.
67. Sari TT, Gatot D, Akib AA, Bardosono S, Hadinegoro SR, Harahap AR, Idjradinata PS (2014) Immune response of thalassemia major patients in Indonesia with and without splenectomy. Acta Med Indones 46(3):217-225.
68. Maes M, Bosmans E, Suy E, Vandervorst C, DeJonckheere C, Raus J (1991) Depression-related disturbances in mitogen-induced lymphocyte responses and interleukin-1 beta and soluble interleukin-2 receptor production. Acta Psychiatr Scand 84(4):379-86.
69. Mikova O, Yakimova R, Bosmans E, Kenis G, Maes M (2001) Increased serum tumor necrosis factor alpha concentrations in major depression and multiple sclerosis. Eur Neuropsychopharmacol 11(3):203-208.
70. Chao CC, Hu S, Ehrlich L, Peterson PK (1995) Interleukin-1 and tumor necrosis factor-alpha synergistically mediate neurotoxicity: involvement of nitric oxide and of N-methyl-D-aspartate receptors. Brain Behav Immun 9(4):355-65.
71. Guo H, Jin YX, Ishikawa M, Huang YM, van der Meide PH, Link H, Xiao BG (1998) Regulation of beta-chemokine mRNA expression in adult rat astrocytes by lipopolysaccharide, proinflammatory and immunoregulatory cytokines. Scand J Immunol 48(5):502-8.
32
73. Leonard B, Maes M (2012) Mechanistic explanations how cell-mediated immune activation, inflammation and oxidative and nitrosative stress pathways and their sequels and concomitants play a role in the pathophysiology of unipolar depression. Neurosci Biobehav Rev 36(2):764-85.
74. Chang JS, Li YL, Lu CH, Owaga E, Chen WY, Chiou HY (2014) Interleukin-10 as a potential regulator of hepcidin homeostasis in overweight and obese children: a cross-sectional study in Taiwan. Nutrition 30:8099-9007.
75. Libani IV, Guy EC, Melchiori L, Schiro R, Ramos P, Breda L, Scholzen T, Chadburn A, et al (2008) Decreased differentiation of erythroid cells exacerbates ineffective erythropoiesis in β-thalassemia. Blood 112:875-885.
76. Angelucci E, Bai H, Centis F, Bafti MS, Lucarelli G, Ma L, Schrier S (2002) Enhanced macrophagic attack on beta-thalassemia major erythroid precursors. Haematologica 87:578- 583.
77. Simon NM, McNamara K, Chow CW, Maser RS, Papakostas GI, Pollack MH, Nierenberg AA, Fava M, Wong KK (2008) A detailed examination of cytokine abnormalities in major depressive disorder. Eur Neuropsychopharmacol 18(3):230-3.
78. Grassi-Oliveira R, Brieztke E, Teixeira A, Pezzi JC, Zanini M, Lopes RP, Bauer ME (2012) Peripheral chemokine levels in women with recurrent major depression with suicidal ideation. Braz J Psychiatry 34(1):71-5.
33
80. Maes M, Fišar Z, Medina M, Scapagnini G, Nowak G, Berk M (2012) New drug targets in
depression: inflammatory, cell-mediated immune, oxidative and nitrosative stress, mitochondrial, antioxidant, and neuroprogressive pathways. And new drug candidates--Nrf2 activators and GSK-3 inhibitors. Inflammopharmacology 20(3):127-50.
34
Figure 1. Results of Partial Least Squares path analysis with the CDI (Children’s Depression Inventory) score as dependent variable.
Iron load is entered as a latent vector extracted from ferritin, iron and TS% (transferrin saturation percentage) levels.
IL: interleukin
TNF: tumor necrosis factor
35
Table 1. Sociodemographic and clinical data in patients with β-thalassemia major (β-TM) with and without depression (MDD) and
healthy controls (HC).
All results are shown as mean (SD). A,B,C: pairwise comparisons between group means
p df
F / χ2
β-TM+MDD C
β-TM-MDD B
HC A
Variables
0.056 2 / 161
0.58 8.6 (2.2) 9.0 (2.4) 8.9 (1.9) Age (years) 0.468 2 1.52 25 / 29
33 / 24 27 / 26
Sex (F/M)
0.277 2
2.57 17 / 37
17 / 40 10 / 43
Rural/Urban ratio
0.364 -
Ψ= 0.082 4 / 50
2 / 55 -
In- / outpatients
<0.001 1 / 109
17.24 91.2 (38.0) B
63.9 (31.1) C
- Number blood transfusions
<0.001 2 / 161
640.4 21.5 (3.2) A,B
11.8 (2.6) A,C
3.7 (1.5) B,C
Children’s Depression Inventory
- - - 54 57 -
Treatment with Desferal
0.718 -
0.13 9 / 45
11 / 46 -
Treatment with vitamin C (N/Y)
0.030 -
Ψ = 0.191 4 / 50
0 / 57 -
Treatment with folic acid (N/Y)
0.417 -
Ψ = 0.077 9 / 45
13 / 44 -
36
Table 2. Results of multivariate GLM analysis: associations between diagnosis (3 groups: β-thalassemia major with and without depression and normal controls) and iron (Fe) status variables.
Tests Dependent variables
Explanatory variables
F df p Partial η2
#1. Multivariate GLM Iron, TIBC, UIBC, TS%, Tf, ferritin Diagnosis Sex Age 33.91 1.17 0.81
12 / 308 6 / 154 6 / 154
<0.001 0.327 0.563 0.569 0.044 0.031
Test for between-subject effects Iron TIBC UIBC TS% Tf Ferritin Diagnosis Diagnosis Diagnosis Diagnosis Diagnosis Diagnosis 55.36 1.72 26.70 66.87 1.88 239.22
2 / 159 2 / 159 2 / 159 2 / 159 2 / 159 2 / 159
<0.001 0.182 <0.001 <0.001 0.156 <0.001 0.411 0.021 0.251 0.457 0.023 0.751
#2. Multivariate GLM Iron, TIBC, UIBC, Ts%, Tf, Ferritin
#Transfusion 1.06 5 / 103 0.387 0.049
TIBC: Total iron binding capacity
UIBC: Unsaturated iron binding capacity
TS%: Transferrin saturation percentage
37
Table 3. Model-generated estimated marginal means values of iron and immune variables in patient with β-thalassemia major with (β-TM + MDD) and without (β-TM – MDD) depression and healthy controls (HC).
Variables HC C Β-TM - MDD B Β-TM + MDD A
Fe µM 21.4 (1.5) B,C 38.0 (1.4) A 41.5 (1.9) A
Fe in z score -0.911 (0.107) B,C 0.310 (0.103) A 0.568 (0.106) A
TIBC µM 59.0 (1.8) 63.5 (1.8) 62.8 (1.8)
TIBC in z score -0.205 (0.136) 0.122 (0.131) 0.072 (0.135)
UIBC in z score after sqr trans 0.691 (0.120) B,C -0.164 (0.116) A,C -0.505 (0.119) A,B
TS% 36.2 (2.0) B,C 60.7 (1.9) A,C 67.2 (2.0) A,B
TS% in z score -0.954 (0.102) B,C 0.295 (0.099) A,C 0.625 (0.102) A,B
Tf mg/l 147.8 (4.6) 159.4 (4.5) 157.7 (4.6)
Tf in z score -0.214 (0.135) 0.127 (0.131) 0.076 (0.135)
Ferritin in z score after sqr trans -1.244 (0.069) B,C 0.496 (0.067) A,C 0.698 (0.069) A,B
TNF-α in z score after sqr trans -0.861 (0.111) B,C 0.337 (0.107) A 0.489 (0.110) A
IL-1β in z score after Ln trans -0.853 (0.110) B,C 0.227 (0.106) A,C 0.598 (0.109) A,B
CCL11 in z score after sqr trans 0.397 (0.131) B,C -0.309 (0.127) A -0.063 (0.131) A
IL-10 pg/ml 13.6 (4.1) B,C 45.9 (4.0) A 42.1 (4.1) A
IL-10 in z score -0.621 (0.125) B,C 0.352 (0.121) A 0.238 (0.124) A
Comp1: zTNFα + zIL-1β -1.011 (0.098) B,C 0.332 (0.095) A,C 0.641 (0.097) A,B
Comp2: z(zTNFα+ zIL-1β) - zIL-10 -0.393 (0.163) C -0.022 (0.160) 0.401 (0.164) A
All results are shown as mean (SE). A,B,C: pairwise comparisons between group means
Fe: Iron; TIBC: Total iron binding capacity; UIBC: Unsaturated iron binding capacity; TS%: Transferrin saturation percentage; Tf: Transferrin;
TNF: Tumor necrosis factor; IL: Interleukin; CCL11: Eotaxin; Comp1 and Comp2: Two z unit-weighted composite scores indicating M1 macrophage activation (comp1) and M1/CIRS ratio (comp2).
38
Table 4. Results of multivariate GLM analysis: association between diagnosis (3 groups: β-thalassemia major with and without depression and normal controls) and immune biomarkers.
Tests Dependent variables
Explanatory variable
F df p Partial η2
#1. Multivariate GLM TNF-α, IL-1β, CCL11, IL-10, Comp1, Comp2
Diagnosis Sex Age 23.09 0.83 1.16
8 / 312 4 / 156 4 / 156
<0.001 0.508 0.329 0.372 0.021 0.029
Tests for between-subjects effects TNF-α IL-1β CCL11 IL-10 Comp1 Comp2 Diagnosis Diagnosis Diagnosis Diagnosis Diagnosis Diagnosis 44.99 47.63 7.64 18.47 81.67 5.84
2 / 159 2 / 159 2 / 159 2 / 159 2 / 159 2 / 159
<0.001 <0.001 0.001 <0.001 <0.001 0.004 0.361 0.375 0.088 0.189 0.507 0.068
#2. Multivariate GLM TNF-α, IL-1β, CCL11, IL-10, Comp1, Comp2
Number of transfusions
0.75 4 / 104 0.559 0.028
TNF-α: tumor necrosis factor
IL: interleukin
Comp1: computed as zTNFα + zIL-1β indicating M1 macrophage activation
39
Table 5. Results of binary logistic regression analysis with β-thalassemia major with major depression (MDD) as dependent variable and no MDD as reference group.
Dependent variables Explanatory variables
B SE Wald df p OR 95% CI
#1. MDD vs. No-MDD #Transfusions 1.073 0.294 13.45 1 <0.001 2.93 1.64-5.20
#2. MDD vs. No-MDD #Transfusions TS% 1.120 0.595 0.306 0.269 13.41 4.91 1 1 <0.001 0.027 3.07 1.81 1.68-5.59 1.07-3.07
#3. MDD vs. No-MDD #Transfusions TS% IL-1β 1.16 0.614 0.631 0.320 0.277 0.280 13.26 4.92 5.10 1 1 1 <0.001 0.027 0.024 3.20 1.84 1.88 1.71-5.60 1.07-3.18 1.09-3.25
#Transfusions: total number of blood transfusion units
TS%: Transferrin saturation percentage
40
Table 6. Results of multiple regression analysis with the Children’s Depression Inventory (CDI) as dependent variable and iron status and immune biomarkers, number of transfusions and use of vitamin C as explanatory variables.
Dependent variables
Explanatory variable β t p F model df p R2
#1. CDI in all subjects Model
Ferritin Iron 0.612 0.208 9.78 3.30 <0.001 0.001
181.43 2/161 <0.001 0.559
#2. CDI in all subjects Model
#Transfusions Ferritin Iron 0.444 0.329 0.147 6.60 4.68 2.61 <0.001 <0.001 0.010
100.38 3/160 <0.001 0.653
#3. CDI in all subjects Model
#Transfusions
Comp1 (zTNF+ zIL-1β)
0.569 0.333 10.10 5.91 <0.001 <0.001
144.08 2/161 <0.001 0.642
#4. CDI in all subjects Model
#Transfusions Comp1(TNF+IL-1β) Ferritin Iron 0.411 0.217 0.231 0.116 6.26 3.63 3.16 2.11 <0.001 <0.001 0.002 0.036
84.29 4/159 <0.001 0.680
#5. CDI in thalassemia major Model
#Transfusions
Comp1 (zTNF+ zIL-1β) Folic acid 0.367 0.220 -0.204 4.37 2.60 -2.41 <0.001 0.011 0.018
18.97 1/109 <0.001 0.148
Comp1 (zTNFα + zIL-1β) in all subjects Model Ferritin TS% 0.514 0.213 7.00 2.90 <0.001 <0.001
62.99 2/161 <0.001 0.439
IL-1β in all subjects Model
Ferritin 0.249 2.48 0.014
41
TS%
#Transfusions
0.206 0.206
2.52 2.20
0.013 0.030
TNF-α in all subjects Model
Ferritin 0.567 8.77 <0.001
76.95 1/162 <0.001 0.322
CCL11 in all subjects Model
Ferritin -0.24 3.02 0.003
9.14 1/162 0.003 0.053
IL-10 in all subjects Model
Ferritin 0.433 6.11 <0.001
37.34 1/162 <0.001 0.187
Comp1: z unit-weighted composite score indicating M1 macrophage activation.
TNF: tumor necrsis factor
IL: interleukin