THREE DIMENSIONAL CONFORMAL
RADIOTHERAPY TREATMENT PLANNING FOR
NON-SMALL CELL LUNG CANCER
DR ELENA MACNAUGHT WILSON
BSc (Hons) MB BS MRCP FRCRMOUNT VERNON CANCER CENTRE
MOUNT VERNON HOSPITAL
NORTHWOOD
MIDDLESEX HA6 2RN
UK
THESIS SUBMITTED FOR THE DEGREE OF
DOCTOR OF MEDICINE (MD)
TO THE UNIVERSITY OF LONDON
ProQuest Number: U642148
All rights reserved
INFORMATION TO ALL USERS
The quality of this reproduction is dependent upon the quality of the copy submitted. In the unlikely event that the author did not send a complete manuscript and there are missing pages, these will be noted. Also, if material had to be removed,
a note will indicate the deletion.
uest.
ProQuest U642148
Published by ProQuest LLC(2015). Copyright of the Dissertation is held by the Author. All rights reserved.
This work is protected against unauthorized copying under Title 17, United States Code. Microform Edition © ProQuest LLC.
ProQuest LLC
789 East Eisenhower Parkway P.O. Box 1346
ABSTRACT
The purpose was to determine whether new technological developments could improve
radical radiotherapy for NSCLC. Patients treated with CHARTWEL to 60Gy were
investigated.
3D Conformai Radiotherapy Treatment Planning
2D and 3D planning were compared in 24 patients. Dose volume histograms were
constructed for planning target volumes (PTV), lung and spinal cord. 3D planning
achieved a higher dose to the PTV due to a significant dosimetric advantage.
Geometric coverage with 2D was adequate at the expense of higher doses to lung and
spinal cord.
External Immobilisation Frame
An external metal immobilisation frame was validated with CT scanning. Alignment of
internal and external anatomy occurred in all patients with the frame.
Active Breathing Control (ABC)
Intra- and inter-fraction variation with ABC and effect of ABC were assessed with CT
scanning and the 3D radiotherapy treatment planning software. PTVs, doses to lung,
spinal cord and oesophagus were compared for free breathing and ABC in 10 patients.
ABC enabled better delineation of disease and normal structures and allowed
reproducible breath holds over several weeks. Reduction in V20 occurred in all plans
and maximum spinal cord dose in 80 %. The reductions would give an extra margin of
Assessment o f Lung and Oesophageal Morbidity
Acute and late lung (14 patients) and oesophageal (21 patients) morbidity were
assessed. Although most developed radiological pneumonitis and spirometry generally
decreased after treatment, dyspnoea did not necessarily develop. There was correlation
between mean lung dose (MLD) and V20 and between PTV and the following:
radiological pneumonitis score, MLD, V20.
Acute dysphagia occurred in most patients with full recovery by week 8. M aximum
dysphagia score correlated with maximum dose to oesophagus but not length of
oesophagus treated.
The results indicate that the dose limitations currently employed in the radiotherapy
CONTENTS
TITLE 1
ABSTRACT 2
CONTENTS 4
LIST OF FIGURES 9
LIST OF TABLES 13
DEDICATION 15
ACKNOWLEDGEMENTS 16
SUMMARY OF ACHIEVEMENTS AND PUBLICATIONS 18
STATEMENT OF ORIGINALITY 24
ETHICAL STATEMENT 25
INTRODUCTION: THE NATURAL HISTORY AND TREATMENT OF
NON-SMALL CELL LUNG CANCER
1.1 Natural history of Non-Small Cell Lung Cancer 26
Aetiology 26
Pathology 27
1.2 Surgery 30
Neo-adjuvant and Adjuvant Radiotherapy 32
Neo-adjuvant and Adjuvant Chemotherapy 34
1.3 Radiotherapy 35
CHART 35
CHARTWEL 37
Chemotherapy 38
Concurrent chemotherapy and radiotherapy 40
Sequential versus concurrent chemo-radiotherapy 40
Neo-adjuvant chemotherapy followed by
concurrent chemo-radiotherapy 44
Adjuvant chemotherapy 44
1.4 Three-dimensional conformai radiotherapy (3D CRT) to treat non-small
cell lung cancer 45
1.5 3D CRT procedures 47
Data acquisition: Tumour and patient data for planning 47
Imaging 47
Target volume and normal tissue definition 49
Definition of the GTV 49
Normal tissue constraints 52
Spinal cord tolerance 52
Oesophageal tolerance 53
Lung tolerance 54
Definition of the CTV 55
Definition of the PTV 55
PTV coverage 58
Conformai block/MLC penumbra 58
PTV to TV margins 58
Dose calculations 59
Evaluation of 3D plans 59
Verification of 3D treatment plans 62
1.6 Techniques to improve set-up and organ motion errors 63
Immobilisation 63
Organ motion 63
2. METHODS
2.1 Patient eligibility 66
2.2 Pre-treatment investigations 67
2.3 Treatment with chemotherapy before radiotherapy 67
2.4 Positioning o f the patient 68
Immobilisation frame 68
2.5 Assessment o f the immobilisation frame 70
2.6 Planning software 71
M ultidata DSS® 2D planning system 71
3D Pinnacle® version 4.2f planning system 72
2.7 CT scanning for 2D/3D comparison 75
2.8 2D planning 76
2.9 3D planning 76
Prescribed dose and dose limits 79
2.10 Radiotherapy 2D/3D planning comparison 79
2.11 ABC procedure and CT scanning 82
2.12 3D planning for the FB and ABC comparison 85
2.13 Morbidity assessment 86
3. COMPARISON OF 2 DIMENSIONAL AND 3 DIMENSIONAL
RADIOTHERAPY TREATMENT PLANNING IN LOCALLY
ADVANCED NON-SMALL CELL LUNG CANCER TREATED WITH
RADICAL RADIOTHERAPY
3.1 Introduction 88
3.2 Subjects 90
3.3 Methods 92
3.4 Results 94
3.5 Conclusions 102
4. GATED THERAPY WITH ACTIVE BREATHING CONTROL TO
REDUCE ERROR DUE TO RESPIRATORY EXCURSION IN RADICAL
RADIOTHERAPY FOR NON-SMALL CELL LUNG CANCER
4.1 Introduction 104
4.2 Subjects and methods 105
4.3 Results 106
4.4 Conclusions 121
4.5 Discussion 123
5. EVALUATION OF LUNG AND OESOPHAGEAL MORBIDITY
FOLLOWING RADICAL 3D CONFORMAL RADIOTHERAPY FOR
NON-SMALL CELL LUNG CANCER
5.1 Introduction 126
Dose volume and dose function histograms 129
DVH simplification strategies 130
5.2 Subjects and methods 131
Oesophageal morbidity 132
5.3 Results 133
Lung morbidity 133
Oesophageal morbidity 149
5.4 Conclusions 161
5.5 Discussion 162
6. CONCLUSIONS AND FUTURE WORK
6.1 Sununary 165
6.2 Prospects for future research 169
REFERENCES 171
APPENDICES
1. Volumes as defined by ICRU Report 50 189
2. Volumes as defined by ICRU Report 62 190
3. Follow-up protocol 192
4. WHO Performance Scale 195
5. Conformai bronchus planning CT scanning protocol 196
6. Protocol for the use of Active Breathing Control equipment 201
LIST OF FIGURES
1.1 Outcome of patients referred for surgery 31
1.2 Overall survival for patients with NSCLC treated with
CHARTWEL ± neo-adjuvant chemotherapy 43
1.3 2D PTV outlined on a planning CT scan 51
1.4 3D volumes outlined on a planning CT scan 52
1.5 (a) Cumulative dose volume histogram 60
(b) Differential dose volume histogram 60
1.6 3D PTV display viewed in axial, sagittal and coronal planes 61
2.1 (a) Mount Vernon immobilisation frame 69
(b) Model demonstrating the treatment position using the
immobilisation frame attached to the couch in the CT scanner 69
2.2 (a) Fused pre-and post-chemotherapy CT scans taken
without the immobilisation frame 70
(b) Fused pre-and post-chemotherapy CT scans taken
with the immobilisation frame 70
2.3 2D and 3D plans to display isodose distributions 81
2.4 2D and 3D field arrangements and positioning of lead shielding 81
2.5 The ABC apparatus 84
2.6 Respiratory trace with ABC displayed on a laptop screen 85
3.1 Median V 9 5 prescribed 2D and V 9 5 3D 95
3.2 Median V 9 5 c a l c u l a t e d 2 0 and V 9 5 3 0 96
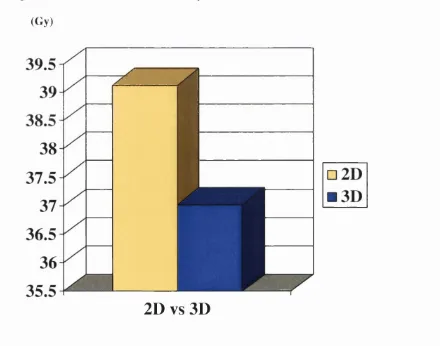
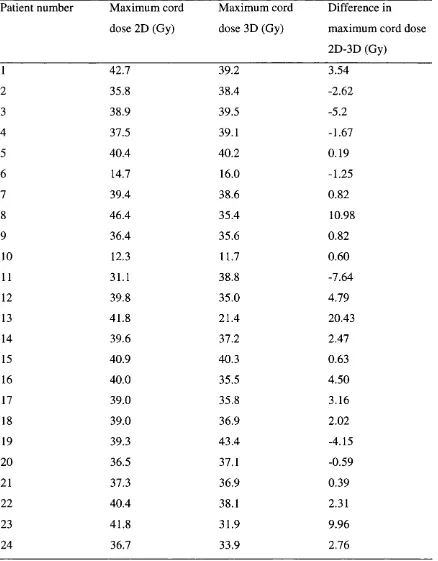
3.3 Median maximum dose to spinal cord 2D and 3D 97
3.5 Cumulative DVHs to display the difference between 2D and 3D doses
to the PTV and critical normal tissues (lung and spinal cord) 101
4.1 Free breathing (FB) and ABC phase 1 and 2 plans 108
4.2 Fused FB and ABC planning CT scans displaying the
effect of ABC 109
4.3 V95 for PTV 1 FB and ABC 113
4.4 V 9 5 for PTV 2 FB and ABC 114
4.5 Lung volumes for FB and ABC scans 115
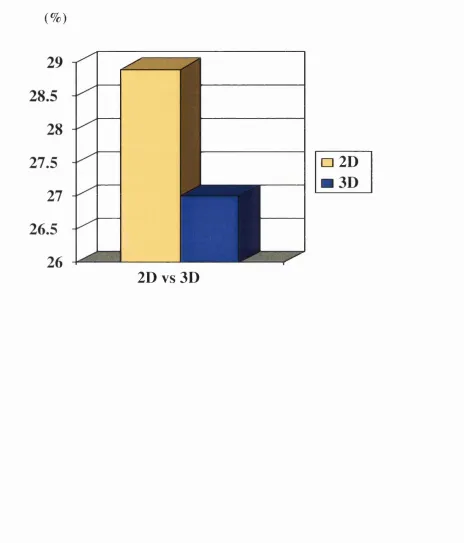
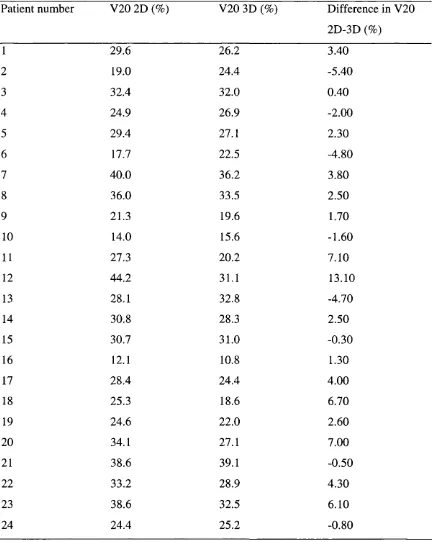
4.6 V20 for FB and ABC plans 116
4.7 M aximum spinal cord dose for FB and ABC plans 118
4.8 Fused FB and ABC CT scans demonstrating minimal shift
with ABC due to tumour infiltration of the mediastinum 119
4.9 (a) Fused ABC 1 and 2 scans displaying the intrafraction
variation 122
(b) Fused ABC 1 and 3 scans displaying the interfraction
variation 122
5.1 Scatter plot of correlation between the change in
FEV I and FVC measurements after treatment 136
5.2 Scatter plot of correlation between the MLD and V20 137
5.3 Scatter plot of correlation between the radiological pneumonitis
scores and the PTV 137
5.4 Scatter plot of correlation between the V20 and the PTV 138
5.5 Scatter plot of correlation between the MLD and the PTV 138
5.6 Scatter plot of correlation between the changes in FEV 1
5.7 Scatter plot of correlation between the changes in FEV 1
and radiological pneumonitis scores post treatment 140
5.8 Scatter plot of correlation between the changes in FEV 1
post treatment and the MLD 140
5.9 Scatter plot of correlation between the changes in FEV 1
post treatment and the V20 141
5.10 Scatter plot of correlation between the changes in FEV 1
post treatment and the PTV 141
5.11 Scatter plot of correlation between the changes in FVC
and the dyspnoea scores post treatment 142
5.12 Scatter plot of correlation between the changes in FVC
and radiological pneumonitis scores post treatment 142
5.13 Scatter plot of correlation between the changes in FVC
post treatment and the MLD 143
5.14 Scatter plot of correlation between the changes in FVC
post treatment and the V20 143
5.15 Scatter plot of correlation between the changes in FVC
post treatment and the PTV 144
5.16 Scatter plot of correlation between the changes in dyspnoea
scores and radiological pneumonitis scores post treatment 144
5.17 Scatter plot of correlation between the changes in dyspnoea
scores post treatment and the MLD 145
5.18 Scatter plot of correlation between the changes in dyspnoea
scores post treatment and the V20 145
5.19 Scatter plot of correlation between the changes in dyspnoea
5.20 Scatter plot of correlation between the radiological pneumonitis
scores post treatment and the MLD 146
5.21 Scatter plot of correlation between the radiological pneumonitis
scores post treatment and the V20 147
5.22 Scatter plot of correlation between the maximum dysphagia
scores post treatment and the maximum oesophageal dose received 152
5.23 Scatter plot of correlation between the oesophageal volume
and the oesophageal length treated 153
5.24 Scatter plot of correlation between the maximum and
mean oesophageal doses received 153
5.25 Scatter plot of correlation between the maximum dysphagia
scores post treatment and the oesophageal volume treated 154
5.26 Scatter plot of correlation between the maximum dysphagia
scores post treatment and the oesophageal length treated 155
5.27 Scatter plot of correlation between the maximum dysphagia
scores post treatment and the mean oesophageal dose received 155
5.28 Scatter plot of correlation between the oesophageal length
treated and the maximum dose received by the oesophagus 156
5.29 Scatter plot of correlation between the oesophageal volume
treated and the maximum dose received by the oesophagus 157
5.30 Scatter plot of correlation between the oesophageal length
treated and the mean dose received by the oesophagus 157
5.31 Scatter plot of correlation between the oesophageal volume
LIST OF TABLES
1.1 Incidence of lung cancer in a UK district according to age group 26
1.2 WHO classification of lung cancer 27
1.3 UICC TNM 1997 staging of NSCLC 28
1.4 International staging system, groupings of TNM subsets
and survival 29
1.5 Neo-adjuvant chemotherapy and radiotherapy 39
1.6 Concurrent chemotherapy and radiotherapy 40
1.7 Sequential versus concurrent chemo-radiotherapy 41
1.8 Overall survival for patients with NSCLC treated with
CHARTWEL ± neo-adjuvant chemotherapy 43
1.9 Neo-adjuvant chemotherapy followed by concurrent
chemo-radiotherapy 44
2.1 Mediastinal nodal areas outlined as ENI 78
3.1 Patient and tumour characteristics for 2D/3D comparison 91
3.2 Median dose to PTV ( V 9 5 ) for 2D and 3D plans 94
3.3 Maximum dose to spinal cord 2D and 3D and the saving with 3D 98
3.4 Whole lung V20 for 2D and 3D and the saving with 3D 100
4.1 Patient and tumour characteristics for the ABC study 107
4.2 Intra and inter-fraction differences in lung volumes with ABC 111
4.3 Differences between FB and ABC PTVs 112
4.4 Differences in V 9 5 for PTV 1 between FB and ABC plans 113
4.5 Differences in V 9 5 for PTV 2 between FB and ABC plans 114
4.7 Isocentre shift with ABC 117
4.8 Maximum spinal cord dose for FB and ABC plans and the
saving with ABC 118
4.9 FB and ABC oesophageal lengths and volumes treated and the
maximum and mean doses received by the oesophagus 120
5.1 Patient characteristics for those in CR suitable for the
lung morbidity assessment 134
5.2 Lung morbidity data 135
5.3 Lung morbidity correlations 148
5.4 Patient and tumour characteristics in patients suitable for
the oesophageal morbidity study 150
5.5 Pre-and post-treatment dysphagia scores 151
5.6 Oesophageal morbidity correlations 159
5.7 Maximum dysphagia scores for patients who did and
DEDICATION
This thesis is dedicated to my parents, Mary and Howard, my daughters, Sophie and
ACKNOWLEDGEMENTS
I am grateful to Dr Edwin Aird and his staff in the Department of Medical Physics at
Mount Vernon Hospital for their guidance throughout this project, and for the great
assistance of Mrs Joy W illiams who planned all of the patients and helped to devise the
protocols for the 2D/3D comparison and the ABC work. I am also very grateful to Mr
Gerry Lowe who provided the technical and computer support and to Miss Mary Oatey
for her advice about the planning systems and to Mrs Anne-Louise Ford, planning
radiographer, who initially helped to devise the ABC protocol.
I wish to acknowledge the help of the CHART radiographers at Mount Vernon without
whom this work could not have been done: Kate Parkin, Nicky Letts, Zoe Wright, Jean
Tremlett, Ewa Pettit, Helen Galloway and Angela Read who coordinated appointments,
treated the patients and gave them their support.
I am extremely grateful to the nursing staff in the Marie Curie Research Wing for
Oncology: Sister Heather Phillips, Sister Pauline Wims, Sister Tracy Corkery, Sister
Julia Phillips and to Mrs Maureen Tinsey who coordinated all of the follow-up
appointments for the CHARTWEL patients and ensured that the protocol was adhered
to, particularly for X-ray, CT scanning and blood test appointments. I would also like
to thank the data managers: Mrs Neeta Verma and Mrs Janice Graham.
I am grateful to my colleagues in the Paul Strickland Scanner Centre: Dr AW Ayoub
and Mrs Pat Fernie for helping to devise the CT scanning protocols and for cheerfully
accommodating the extra workload involved.
I would also like to thank Dr Nazera Dakhil for her assistance with the statistical
analysis and my particular thanks go to Mrs Jane McFarlane in the library at Mount
My thanks also go to the Bioengineering Department at Mount Vernon Hospital and in
particular to M r Ken W alker who designed and built the immobilisation frame which
was used in this project.
I am also very grateful to our colleagues at the W illiam Beaumont Hospital in
Michigan, USA, to Dr John Wong, Dr Mike Sharpe, Dr Di Yan and Dr David Jaffray
who first introduced the ABC device to us and with whom we collaborated during this
project and to Elekta Oncology Systems who provided financial and technical support.
The clinical studies reported herein would not have been possible without the support of
the Consultant Staff at the Mount Vernon Cancer Centre who referred their patients for
treatment, notably Professor Michèle Saunders. My particular thanks go to Dr Peter
Hoskin, for acting as my University of London supervisor and under whose guidance
this thesis was produced, for his encouragement and advice during the project.
Finally, and most importantly, I wish to thank Dr Ethan Lyn who first stimulated my
interest in technical radiotherapy and to whom I am extremely grateful for training me
to treat lung cancer patients with radical radiotherapy and for his support, help and
SUMMARY OF ACHIEVEMENTS AND PUBLICATIONS
See personal bibliography overleaf for listing of papers published in/accepted for
publication in peer reviewed journals, and proffered papers/posters presented at national
and international scientific meetings.
The following publications and presentations relate to work incorporated in this thesis:
3D Conformai Treatment Planning for Non-Small Cell Lung Cancer
Wilson E
Invited lecture presented at the Royal College of Radiologists’ CHART Study Day
Royal Marsden Hospital, London, 15‘^ June 2000
The Application of Breathing Control for the Treatment of Lung Cancer with
CHARTWEL
Wong J, Lyn E, Wilson E, Lowe G, Sharpe M, Robertson J, Martinez A, Aird E
Presented to the American Association of Physics in Medicine, July 2000
Radical Radiotherapy for Non-Small Cell Lung Cancer: Current and Future Approaches
Wilson E
Invited lecture presented at St Thomas’ Hospital, London, 3 L ‘ October 2000
Can the Radical Treatment of Inoperable Non-Small Cell Lung Cancer be Improved?
W ilson E
Invited Lecture to the William Beaumont Hospital, Royal Oak, Michigan, USA, 3"^^ July
Active Breathing Control (ABC) in the treatment of non-small cell lung cancer (NSCLC)
with CHART Week End Less (CHARTWEL)
Wilson E, Williams J, Lyn E, Aird E
Oral presentation to the 6^ Biennial ESTRO Meeting “Physics for Clinical Radiotherapy”
and “Radiation Technology for Clinical Radiotherapy” 19^*’ September 2001, Seville,
Spain
Radiotherapy & Oncology 2001 ;61 :S63
Feasibility study of a custom - made immobilisation frame for treatment of patients with
locally advanced non-small cell lung cancer (NSCLC) with CHART Week End Less
(CHARTWEL)
Williams J, Wilson E, Lyn E, Aird E
Poster with Oral Presentation to the Biennial ESTRO Meeting “Physics for Clinical
radiotherapy” and “Radiation Technology for Clinical Radiotherapy” 17-20 September
2001, Seville, Spain
Radiotherapy & Oncology 2001;61:S66
Comparison of 2D and 3D radiotherapy in locally advanced non-small cell lung cancer
(NSCLC) treated with CHART Week End Less (CHARTWEL)
Wilson E, Williams J, Lyn E, Aird E
Poster Presentation to the 6^ Biennial ESTRO Meeting “Physics for Clinical radiotherapy”
and “Radiation Technology for Clinical Radiotherapy” 17-20 September 2001, Seville,
Spain
CHART to CHARTWEL with neo-adjuvant chemotherapy
Wilson E, Lyn B, Williams J, Saunders MI
Invited lecture presented at the The Effective Management of Lung Cancer UK Key
Advances in Clinical Practice Series 2002 [3"^^ annual] Update, Royal College of
Physicians of London, 29^ October 2002
Book Chapter, Editors: Muers ME, Macbeth F, Wells EC, Miles A (In press)
Dose-escalation with CHARTWEL (Continuous Hyperfractionated Accelerated
Radiotherapy Week-End Less) combined with neo-adjuvant chemotherapy in the
treatment of locally advanced non-small cell lung cancer.
Saunders MI, Rojas A, Lyn BE, Wilson E, Phillips H
Clinical Oncology 2002;14:352-360
The Treatment of Lung Cancer
Invited lecture to the Lung Cancer Study Day, The Pasque Hospice, Luton, UK
29^*^ January 2003
Three Dimensional Conformai Radiotherapy in the Radical Treatment of Non-Small
Cell Lung Cancer.
Wilson EM
2D vs 3D Conformai Planning in the Thorax
Wilson E
Invited lecture presented at the UK Radiation Oncology Teaching Course on
Radiotherapy Planning in the Thorax, University of Bath , 10‘*’ April 2003
Clinical Oncology 2003 (In press)
Validation of Active Breathing Control in Patients with non-small cell lung cancer to be
treated with CHARTWEL.
Wilson EM, Williams FJ, Lyn BE, Wong JW and Aird EGA
International Journal of Radiation Oncology Biology Physics 2003 (In press)
Comparison of 2 dimensional and 3 dimensional radiotherapy treatment planning in
locally advanced non-small cell lung cancer treated with CHARTWEL.
Wilson EM, Williams FJ, Lyn BE and Aird EGA
Manuscript submitted to Radiotherapy and Oncology
CHART to CHARTWEL to chemotherapy and CHARTWEL in non-small cell lung
cancer
Lyn BE, Wilson EM, W illiams FJ, Saunders MI, Phillips H
Accepted for Oral Presentation to the British Cancer Research Meeting 2-5‘^ July 2003,
Bournemouth, UK
Lung and Oesophageal morbidity following 3D conformai radiotherapy for non-small
cell lung cancer (NSCLC) treated with CHART Week End Less (CHARTWEL)
Wilson E, Lyn E, Williams J
Accepted for Presentation to the 7^^ Biennial ESTRO Meeting on Physics and Radiation
Technology for Clinical Radiotherapy 13-18 September 2(X)3, Geneva, Switzerland
STATEMENT OF ORIGINALITY
This thesis is based solely on original work carried out by the author between 1999 and
2002 whilst employed as a clinical research registrar in the Mount Vernon Centre for
Cancer Treatment.
Design of the studies was by the author in liaison with the hospital departments of
Medical Physics and Bioengineering. Patient selection and initial assessment were
performed by the author, who was also responsible for the administrative aspects
including organisation of the necessary pre-treatment investigations, hospital admission
for neo-adjuvant chemotherapy, organisation of pre- and post-chemotherapy CT scans,
volume drawing on the planning scans, follow-up assessments and toxicity gradings.
The author carried out data retrieval from case notes and investigations and performed
the data analysis. The author prepared the manuscript and accompanying figures and
ETHICAL STATEMENT
The clinical studies described in this thesis received ethical approval by the Chairman
o f the Local Ethics Committee at Mount Vernon Hospital. All patients entered received
CHAPTER 1.
INTRODUCTION: THE NATURAL HISTORY AND TREATMENT
OF NON-SMALL CELL LUNG CANCER.
1.1 Natural history of Non-Small Cell Lung Cancer INSCLC)
Lung cancer is the commonest malignancy in the Western world. In the United
Kingdom there are about 42,000 new cases per year [1] and lung cancer causes
approximately 40,000 deaths per year, 25% of all cancer deaths (Table 1.1).
Table 1.1. Incidence o f lung cancer in a U K district according to age group [2] A ge group Incidence per 100,000 population per year
(years) Male Female Overall
All ages 100 41 69
75+ 751 162 359
65-75 388 120 238
55-64 NC NC 81
45-54 NC NC 39
NC = not calculated (numbers too few)
Aetiology
90% of lung cancers are attributed to smoking and there is a direct relation to the
cumulative number of cigarettes smoked in a lifetime (duration and number) [3]. Up to
2% of cases are related to passive smoking. Asbestos exposure increases the risk of
is a similar synergistic relationship between smoking and exposure to radiation and
arsenic. Other associations include radon; air pollution; occupational exposure to
chromium, nickel or PVC; working in the coal and gas industry and previous lung
disorders (tuberculosis and fibrosing alveolitis predispose to adenocarcinoma).
Pathology
NSCLC comprises 75% of all cases of lung cancer (Table 1.2). It is well known that
NSCLC has an aggressive behaviour and 83% of patients die in the first year. Overall
prognosis for NSCLC tends to be dismal whatever the therapeutic approach and long
term survival ranges from 8 to 15% [4]. There is scope for improvement in the results
of radical treatment.
Table 1.2. W HO classification o f lung cancer (1981)
WHO HISTOLOGY %Worldwide %UK
1 Squamous cell carcinoma 30 40
II Adenocarcinoma 30 20
III Large cell carcinoma 10 10
IV Small cell carcinoma 25 25
M iscellaneous
(carcinoid,adenosquamous, adenoid cystic, mucoepidermoid)
Table 1.3. Staging o f NSCLC (UICC TNM * 1997) [5]
TX Primary tumour cannot be assessed, or tumour proven by the presence o f malignant cells in sputum or bronchial w ashings but not visualised by imaging or bronchoscopy
TO N o evidence o f primary tumour Tis Carcinoma in situ
T1 Tumour < 3 cm in greatest dimension, surrounded by lung or visceral pleura, without bronchoscopic evidence o f invasion more proximal than the lobar bronchus (i.e. not in the main bronchus)
T2 Tumour with any o f the follow ing features o f size or extent; > 3 cm in greatest dimension
Involves main bronchus > 2 cm distal to the carina Invades visceral pleura
Associated with atelectasis or obstructive pneumonitis which extends to the hilar region but does not involve the entire lung
T3 Tumour o f any size which directly invades any o f the follow ing: chest wall (including superior sulcus tumours), diaphragm, mediastinal pleura, parietal pericardium; or tumour in the main bronchus < 2 cm distal to the carina but without involvem ent o f the carina; or associated atelectasis or obstructive pneumonitis o f the entire lung
T4 Tumour o f any size which invades any o f the following: mediastinum, heart, great vessels, carina, trachea, oesophagus, vertebral body; or separate tumour nodule(s) in same lobe; or tumour with malignant pleural effusion.
N X Regional lymph nodes cannot be assessed NO N o regional lymph node metastasis
N1 Metastasis in Ipsilateral peribronchial and/or ipsilateral hilar lymph nodes and/or intrapulmonary nodes including involvem ent by direct extension
N 2 Metastasis in Ipsilateral mediastinal and/or subcarinal lymph node(s)
N3 M etastasis in contralateral mediastinal, contralateral hilar, ipsilateral or contralateral scalene or supraclavicular lymph node(s)
M X Distant metastasis cannot be assessed MO N o distant metastasis
M l Distant metastasis, includes separate tumour nodule(s) in different lobe (ipsilateral or contralateral)
Table 1.4. International staging system , groupings o f TNM subsets and survival (1997 version) [6].
Stage groupings
TNM subset Percentage
o f cases
% Survival after treatment (months)
12 36 60
Stage lA T1 NO MO 13 91 71 61
Stage IB T2 NO MO 23 72 46 38
Stage HA T1 N1 MO 0.5 79 38 34
Stage IIB T 2 N 1 MO
T3 NO MO 7 59 33 24
Stage III A T l-3 N 2 MO
T 3 N 1 MO 10 50 18 13
Stage IIIB T4 Any N MO
Any T N 3 MO 20 34 7 5
1.2 Surgery
Surgical resection is recommended for patients with Stage 1 (T1-2N0M0) or II (T I-
2N1M0) disease (Table 1.3, 1.4). Some patients with stage IIIA disease (T3N0), due to
chest wall involvement and without nodal involvement, may be effectively treated by
surgery and 5 year survival rates close to 50% may be achieved following en-bloc
resection [7]. Other patients with stage III disease and positive nodes have a poor
prognosis, resulting in overall 5-year survival rates lower than 15% following surgery
(Table 1.4).
Surgery is appropriate for patients who are relatively fit, have adequate respiratory
reserve as assessed with FEV l and FVC measurements (usually FE V l > 1.5 litres and
FEV l/FV C predicted values of > 40% after resection), no evidence of métastasés and
no co-morbidity that might prejudice survival.
The surgical procedure of choice depends on the site and stage of disease:
• Wedge or segmental resection for small peripheral Stage 1 tumours (< 2 cm)
• Lobectomy for central tumours lying completely within one lobe. If the lobar
bronchus is involved, an adequate clearance margin is required. Nodal involvement
limited to the intrapulmonary or immediate hilar region can be removed en bloc for
Stage II disease
• Pneumonectomy for fit patients with more extensive disease, including tumours
within the orifice of a lobar or main stem bronchus or involving more than one lobe.
Extended pneumonectomy is indicated in the presence of mediastinal node
involvement (N2 or Stage III) if limited to ipsilateral tracheobronchial or subcarinal
• Where disease extends proximally to major vessels radical pneumonectomy with
intrapericardial ligation of vessels is technically possible
• Bronchoplastic or sleeve resection for carinal tumours
Prognostic factors in resectable NSCLC include:
• Performance status
• Weight loss (survival 74% if absent, 41% if present)
• Size of primary (survival of 70% for T1 and 50% for T2)
• Differentiation and lymphatic or vascular invasion
Unfortunately, most patients present with locally advanced or advanced disease and a
therapeutic resection is achieved in only a minority of patients (Figure L I).
Figure 1.1 Outcome of patients referred for surgery (n=100)
5 cure
25 operable
15 local or distant recurrence
100
15
N2 at mediastinoscopy
60
Inoperable
inoperable at thoracotomy
Surgery for NSCLC carries a 5% overall operative mortality risk and causes significant
morbidity. 10% of patients have major life threatening complications and 50% have
persistent pain at the thoracotomy site for 1-4 years. Quality of life is temporarily
Stage IIIB disease is currently considered unresectable in the United Kingdom, although
some locally advanced initially unresectable IIIB tumours may become operable after
induction chemotherapy. Transternal bilateral lymphadenectomy, extended to the
supraclavicular areas if necessary, is technically feasible [8]. Superior vena caval
invasion can be resected, with or without a prosthetic graft [9]. A sleeve resection is
possible in patients having tumours situated on the tracheal carina, or the lower wall of
the trachea, if not too extensive [10]. Some tumours invading the vertebral bodies can
be resected via an en-bloc procedure, including partial or total vertebrectomy [11].
Pancoast's tumours are now operated on through a transmanubrial osteomuscular
sparing approach, avoiding cosmetic and functional disadvantages of the former
transclavicular approaches [12]. Tumours invading the implantation of pulmonary
veins in the left atrium are resectable by lateral clamping and direct suture of the atrial
wall. These extended resections are associated with an increased risk of postoperative
complications compared to operations on early stage disease. Moreover, locally
advanced disease carries a high chance of metastatic spread and careful selection of
cases is thus essential.
Neo-adjuvant and Adjuvant Radiotherapy
Pre-operative radiotherapy for tumours considered initially operable was tested in
randomised trials conducted 20 years ago and failed to show any benefit, but did show a
clear increase in postoperative complications [13, 14]. The role of pre-operative
radiation for locally advanced tumours (Stage III disease) has never been evaluated in a
large-scale randomised trial. Some are proposing this approach for tumours of the
superior sulcus due to the risk of mediastinal node involvement. In a phase II study, the
Lung Cancer Study Group (LCSG) observed a response rate of 50% among 32 patients
resection and only one complete response was seen [15]. The available data is
conflicting and thus pre-operative radiation is not currently recommended in routine
practice.
Advantages of postoperative radiation include avoidance of delay in definitive treatment
(surgery), avoidance of morbidity associated with pre-operative radiotherapy and
precise knowledge of the tumour extent from operative and pathological findings to
guide the radiotherapy. A review of the data from several randomised trials allows the
following general conclusions to be made:
(i) There is no place for routine postoperative thoracic radiotherapy after a
complete resection of a Stage 1 or II tumour as all randomised trials have failed
to show any benefit in survival; the data are in good agreement on the pattern
of failure (less than 10% local failure) [16, 17].
(ii) In contrast, for N2 disease the results of the LCSG and the Medical Research
Council (MRC) trials suggested that postoperative radiotherapy decreased the
risk of local relapse, but this did not translate into a survival benefit. This may
reflect the small sample size of most trials with consequently weak statistical
power; there were only 106 cases in the last published MRC trial.
(iii) The Post Operative Radiotherapy (PORT) meta-analysis of data on 2128
patients in nine randomised controlled trials showed that postoperative
radiotherapy had an adverse effect overall survival being reduced from 55% to
48% [18]. Subgroup analysis showed that the adverse effect was greatest in
patients with Stage I/II, NO-1 disease. In those patients with stage III, N2
disease there was no clear adverse effect. It appeared that postoperative
radiotherapy should not be routinely used although the role of postoperative
radiotherapy in the treatment of completely resected N2 tumours was not clear.
known to have a low risk of failure, details of type of surgery were not known,
Co60 machines (sub-optimal for lung irradiation) were used in all trials except
one, radiation dose and fractionation was not standardised, computerised
planning was used in only one trial and in only two trials was inhomogeneity
correction used. It is possible that post-operative radiotherapy using modern
machines, treatment planning and fractionation would not be detrimental and
therefore further research is warranted.
Neo-adjuvant and Adjuvant Chemotherapy
Chemotherapy may be added to surgery in an attempt to improve local control and
eradicate latent metastatic disease. The benefits of pre-operative chemotherapy for
patients with Stage I and II NSCLC are unknown because there have been no
randomised trials. A current trial, LU22, in the UK is addressing the question and
results are awaited. Almost all trials of pre-operative chemotherapy have investigated
patients with Stage IIIA/B disease. They have been largely non-randomised trials,
usually with cisplatin based regimens. Two randomised trials have compared neo
adjuvant chemotherapy followed by surgery with surgery alone in Stage IIIA NSCLC
and both were closed early as there was a highly significant improvement in survival for
patients in the neo-adjuvant chemotherapy arms [19, 20]. There has been criticism of
the trials because of the early closure, small sample size, definitive diagnosis of Stage
IIIA disease prior to treatment and imbalances of prognostic factors.
Meta-analysis of data from 14 randomised controlled trials involving a total of 4357
patients with NSCLC suggests that adjuvant chemotherapy after surgical resection does
not improve survival. The hazard ratios for earlier trials using alkylating agents
favoured surgery alone. For later trials using regimens containing cisplatin there was a
In 2000 Keller reported a trial where 488 patients with completely resected Stage 11 or
lllA NSCLC were randomised to receive postoperative chemotherapy with cisplatin and
etoposide administered concurrently with radiotherapy, or radiotherapy alone. There
was no improvement in local control or survival with the concurrent chemoradiotherapy
compared with radiotherapy alone [22]. NSCLC thus appears responsive to
chemotherapy but the value of adjuvant chemotherapy to surgical resection remains
unanswered and trials are ongoing.
1.3 Radiotherapv
Patients with localised NSCLC who are inoperable, either because of extent of disease
or co-morbidity, or who decline surgery, may be suitable for treatment with radical
radiotherapy. The role of radical radiotherapy in these cases has not always been
universally accepted [23], although extended survival was reported as early as 1968
[24]. A review of more recent literature indicates that radical radiotherapy may offer
the chance of long-term survival [25]. A multi-centre randomised trial compared a
novel fractionation regime, Continuous Hyperfractionated Accelerated RadioTherapy
(CHART), with conventional daily radiotherapy in patients with locally advanced
NSCLC. Patients treated with CHART showed a significant improvement in survival
[26]. This led the Department of Health, in its guidance for the treatment of NSCLC, to
recommend CHART as the treatment of choice for early inoperable disease. [27].
C H A R T
Laboratory and clinical research showed that human lung cancers have a capacity for
rapid cellular proliferation. Growth of cancers was previously estimated using the
which was usually weeks or months. The potential doubling time (Tpot) is the time
taken by a tumour cell population to double in number, correction being made for the
age distribution of the cell population. It may be measured in vivo in human tumours
from a single biopsy using incorporation of bromodeoxyuridine (BrUdR) and flow
cytometry and Tpot is considered to be a better reflection of the biological activity of
the cancer than VDT. The median Tpot was 7 days in 28 human lung cancers and in
some specimens it was as low as 1.6 days [28]. The implication in clinical practice of
such short potential doubling times is that cancers may repopulate during a course of
conventional daily radiotherapy where 2 Gy daily fractions are given Monday to Friday
with weekend breaks to a total dose of about 60 Gy in 6 weeks. Acceleration of
radiotherapy with earlier completion of treatment could improve results. However,
experience showed that acceleration was associated with increased acute toxicity. The
severity of reactions required breaks in treatment, to allow reactions to subside before
treatment could be continued, and such interruptions defeated the principle of
acceleration. For CHART, hyperfractionation (the use of smaller-than-conventional
fractions) was utilised to reduce the acute reactions with the additional benefit of
reduced late normal tissue toxicity. In CHART 1.5 Gy fractions are administered 3
times per day at 0800, 1400 and 2000 hrs, to a total dose of 54 Gy. Treatment is given
7 days per week without breaks for weekends and is completed in only 12 days
compared to 40-42 days for a conventional 6-week course of treatment.
At Mount Vernon Hospital in a pilot study of 76 patients with NSCLC, the CHART
regime showed improved local tumour control and survival compared to historical
controls. A multi-centre randomised trial was performed between 1990 and 1995
comparing CHART with conventional radiotherapy (60 Gy in 30 fractions over 40
days) in patients with locally advanced inoperable NSCLC. Five hundred and sixty
(CT) and lung correction was used and all participating centres were subject to quality
assurance. In those patients treated with CHART there was an absolute improvement in
two-year survival of 9% (29% compared with 20%, p=O.OOS) and a 21% reduction in
the relative risk of local progression (p=0.033). Subgroup analysis (predefined) showed
that in those patients with squamous carcinoma (81% of cases), there was an absolute
improvement in survival of 13% (from 20 to 33 %, /7=0.0007) at two years and a 27%
reduction in the risk of local progression (p=0.012). Furthermore, in squamous
carcinoma there was a 25% reduction in the relative risk of local and/or distant
progression (p=0.025) and a 24% reduction in the relative risk of metastasis (p=0.043).
There were no important differences in acute or late morbidity. However, since the
primary tumour was the cause of death in 61% of the cases treated with CHART [26],
there was a need to improve local control: possible methods include dose escalation,
addition of cytotoxic chemotherapy and improvement in the accuracy of planning and
administration of treatment.
C H A R T W eek-End-Less (C H A R TW EL)
As centres found treatment at weekends difficult to implement, the CHARTWEL
regime was designed and the dose escalated. It was desirable to maintain the inter
fraction interval to allow repair of normal tissue damage, and the low dose per fraction,
to reduce acute and late toxicity. Dose escalation was therefore achieved by increasing
the total number of fractions. As CHART was administered in only 12 days, there was
scope to increase the number of fractions and overall treatment time without
endangering the advantage of acceleration. In CHARTWEL treatment was given three
times daily at 0800, 1400 and 2000 hrs, as in CHART, but Monday to Friday without
treatment at weekends. Dose was escalated from 54 Gy in 16 days to 57 Gy, then to
advanced NSCLC were treated. Analysis of toxicity data showed that dysphagia due to
acute oesophageal mucositis was more severe in those patients treated with higher doses
to 60 Gy but this was not clinically apparent and there was no late damage. After 6
months there was a higher incidence of Grade I pulmonary toxicity. No cases of
radiation myelitis, oesophageal strictures or Grade II or III lung morbidity were seen.
Retrospective comparison of tumour response with the previous CHART trials indicated
that the increase in overall time from 12 to 18 days did not compromise tumour control
or survival [29].
By contrast, the Radiation Therapy Oncology Group (RTOG) randomised phase I/II
trial of dose escalation from 60 Gy to 79.2 Gy with hyperfractionation showed no
increase in acute or late morbidity, possibly because the overall treatment time was
sufficiently long to allow for full compensatory proliferation in the mucosa. There was
an improvement in 2 year survival with hyperfractionated radiotherapy (treating twice
daily at 1.2 Gy per fraction, ten fractions per week) at a total dose of 69.6 Gy compared
to standard radiotherapy giving a 2 year survival of 29% and 13% respectively
(p=0.02). There was no survival advantage at doses higher than 69.6 Gy [30].
Chemotherapy
Chemotherapy may be combined with radiotherapy, as with surgery, in an attempt to
improve local tumour control, eradicate latent metastatic disease and improve survival.
The chemotherapy may be neo-adjuvant, concomitant, adjuvant, or a combination.
(i) Neo-adjuvant chemotherapy
Several randomised trials, initiated in the mid 1980s, have tested the use of induction
chemotherapy followed by definitive radiation compared with radiation alone as a
curative approach in patients with previously untreated stage III NSCLC [31-36]. All
chemoradiation. These were the French CEBI trial [32,35,36], the Cancer and
Leukaemia Group B (CALGB) 8433 trial [31, 33] and the intergroup trial within the
RTOG 8808/Eastern Cooperative Oncology Group (ECOG) 4588/Southwest Oncology
Group (SWOG) trial [34]; survival was poor, as shown in Table 1.5.
Table 1.5: Neo-adjuvant chemotherapy and radiotherapy
Trial No.
Patients
RT Chemo. Survival
CEBI Le
177 65Gy N one 14% (2yr)
Chevalier 1994 [36] (RCT)
176 65Gy Induction
V indesine,cyclophospham ide,cisplatin,CCN U x3,+ x3 post RT
21% (2yr) p =0.02
CALGB 8433 Dillman
1996 [33]
77 60Gy
in 30Fo.d.
N one 7% (5yr)/6% (7yr)
78 60Gy
in 30Fo.d.
W eekly vinblastine for 5 wks and cisplatin wk 1 and 5
19%(5yr)/13%(7yr) p = 0.007
RTOG 8808/ ECOG 4 5 8 8 / SWOG
458 60Gy
in 30F o.d.
None 5% (5yr)
Sause 2000 [34] Ph III
60Gy in 30F o.d. 69.6G y at
1.2Gy b.i.d
W eekly vinblastine for 5 wks and cisplatin wk 1 and 5
W eekly vinblastine for 5 wks and cisplatin wk 1 and 5
8% (5yr)
6% (5yr)
p = 0 .0 4
Three meta-analyses of phase III randomised trials evaluating chemotherapy and
radiation versus radiation alone were performed in the mid 1990s [21,37,38]. These
analyses provided substantial additional statistical evidence in support of the utilisation
of induction cisplatin-containing chemotherapy followed by radiation compared to
radiation alone. It was also observed in these studies that the incidence of distant
métastasés was significantly lower in the chemoradiation-treated group, suggesting that
overall survival. Local control, however, remained a major problem requiring better
systemic therapy or more effective radiotherapy.
(ii) Concurrent chemotherapy and radiotherapy
Three trials, reported in the 1990s, showed improvement in survival in patients treated
with concurrent chemo-radiotherapy detailed in the Table 1.6 [39, 40, 41].
Table 1.6: Concurrent chemotherapy and radiotherapy
Trial N o. Patients RT Chemo. Survival
(3 year) Schaake-Koning
1992 [39]
114 55Gy split course N one 2%
110 55Gy split course W eekly cisplatin 13%
p= N S
107 55Gy split course D aily cisplatin 16%
p = 0 .0 0 9
Jeremic 1995 [40] 61 64.8G y,1.2G y bid None 6.6%
52 64.8G y,1.2G y bid Carboplatin d l+ 2 and etoposide d 1-3 o f each week
23%
p = 0.0021
56 64.8G y,1.2G y bid Carboplatin d l+ 2 and etoposide dl -5 o f w eeks 1, 3 and 5
16%
p= N S
Jeremic 1996 [41] 66 69.6G y,1.2G y bid None 9% (4y)
65 69.6G y,1.2G y bid Daily carboplatin and etoposide
23% (4y) p=0.021
Concurrent use of chemotherapy and radiotherapy was feasible. These randomised trials
and a myriad of phase II studies have supported, but have not proven, the principle of
concurrent chemo-radiotherapy and trials continue.
(iii) Sequential versus concurrent chemo-radiotherapy
In 1999, Furuse et al [42] reported the Japanese experience with a phase III trial
evaluating sequential chemotherapy followed by radiation versus immediate concurrent
Table 1.7: Sequential versus concurrent chemo-radiotherapy
Trial N o. Patients RT Chemo. Survival
% 5 y r
Furuse 156 56G y split course Concurrent M VP x 2 15.8
1999 [42] Phase III
158 56G y standard Induction M VP x 2 8.9
/7=0.04
RTOG 92-04 Komaki 2002 [43]
81 63 Gy standard Induction VP
Concurrent P
13
Randomised Phase II
82 69.6G y bid Concurrent PE 16
p = 0 3 9
These, and other, phase II and III trials, some reported in abstract form only, continued
to give conflicting results. Concurrent chemo-radiotherapy may be superior to
sequential treatment, but in those trials with positive findings, the results were specific
to the chemotherapy and radiotherapy regimes used and did not necessarily prove the
principle. Toxicity was markedly increased with concurrent treatment, with about 30%
of patients suffering grade 3 or 4 toxicity, and long term survival was only similar to or
less than that for accelerated radiotherapy alone. Acute toxicity was already increased
with accelerated radiotherapy. If concurrent chemotherapy was to be given with
CHARTWEL there was the possibility of additive or synergistic effects on normal
tissues precipitating more severe early and/or late morbidity [44]. Reduction of dose or
interruption of radiotherapy, the definitive treatment, due to such toxicity could
endanger potential cure.
Accelerated radiotherapy is completed quickly, within 2 weeks for CHART and 3
weeks for CHARTWEL to 60 Gy. Should concurrent chemotherapy be given at the
and although there might be enhancement of the radiotherapy with improved local
control, systemic effects would not be expected.
Administration of the chemotherapy in the neo-adjuvant setting would allow full doses
of chemotherapy and radiotherapy to be given.
Following the successful CHART trial described above, the CHARTWEL regime was
developed and in a Phase I trial the total dose of radiotherapy was increased from 54 Gy
in 16 days to 60 Gy in 18 days without undue increase in toxicity. It was then
postulated that the addition of chemotherapy might improve results and another Phase
I/II study was started where 3 courses of neo-adjuvant chemotherapy using the MIC
regime containing Mitomycin C, Ifosphamide and Cisplatinum, were administered at 21
day intervals followed by CHARTWEL to 60 Gy. Later, the chemotherapy was
changed to a regime using the newer agents; Paclitaxel and Carboplatin (PC). Again, 3
courses were given at 21 day intervals followed by CHARTWEL. Patients who were
referred from distant centres received neo-adjuvant chemotherapy at their local centres
using regimes with which their physicians were familiar, usually MVP -Mitomycin C,
Vinblastine and Cisplatinum or NP -Navelbine and Cisplatinum. If it was thought that
the patient would not tolerate chemotherapy (or he or she declined chemotherapy) they
were treated with CHARTWEL to 60 Gy to accrue Phase II data for accelerated
radiotherapy without chemotherapy.
Overall survival at three years was 47% for the 33 patients who had been treated with
neo-adjuvant chemotherapy and CHARTWEL compared with 30% for the 55 patients
treated with CHARTWEL alone as shown in Table 1.8 and Figure 1.2. There was no
Table 1.8: Overall survival for patients with N S C LC treated with C H A R T W E L ± neo
adjuvant chemotherapy.
Treatment given N um ber at 1-year 2-year 3-year 5-year
risk survival survival survival survival
(%) (%) (%) (%)
< 6 0 G y 21 75 40 30 24
60Gy 55 78 47 30 18
60Gy-i-chemotherapy 33 59 47 47 awaited
Figure 1.2: Overall survival for patients with N S C LC treated with C H A R T W E L ± neo-
adjuvant chemotherapy.
CD
Ü
c CD
■g
Ü
c
.0
0.8
0.6
4
Patients at risk
■ < 60Gy 1 60Gy alone 42 60Gy chemo 17
0.2
0.0
0
12 24 36 48(iv)
Neo-adjuvant chemotherapy followed by concurrent chemo-radiotherapy
There are hypothetical reasons to combine neo-adjuvant chemotherapy with concurrent
chemo-radiotherapy. By using 2 cycles of induction chemotherapy and then 2
additional cycles concurrent with conventional daily radiotherapy, the total exposure to
chemotherapy is essentially doubled without prolonging the overall duration of
treatment beyond that for sequential chemotherapy followed by radiotherapy. The
additional chemotherapy may enhance the systemic effect.
Table 1.9: Neo-adjuvant chemotherapy followed by concurrent chemo-radiotherapy
Trial No. Patients RT Chemo.
CALGB 9431 60 66Gy standard Paclitaxel/Cisplatin
Randomised phase II 58 66G y standard Vinorelbine/Cisplatin
63 66Gy standard Gemcitabine/Cisplatin
Induction (x2), full dose + concurrent, reduced dose for all above
CALGB 39801 Phase III
Accruing 66Gy standard
66Gy standard
Paclitaxel 50mg/m2/Carboplatin AUC2-w eekly x7 during RT
Induction full dose PC x2 follow ed by concurrent PC as above
The trials shown in Table 1.9 and other Phase III studies are in progress trying to
determine whether the use of induction chemotherapy followed by concurrent chemo-
radiotherapy will result in improved survival compared with immediate chemo-
radiotherapy alone. Results are awaited.
(v) Adjuvant chemotherapy
The “bulk” of latent metastatic disease, locally or systemically, is likely to be least for
post-operative patients where disease has been completely resected. That post-operative
curative in NSCLC. Any viable disease remaining after radical radiotherapy is unlikely
to be eradicated by chemotherapy. In addition, the tumour blood flow may be impaired
by the radiotherapy, reducing drug access to the primary tumour. Perturbation of the
tumour cell population by the radiotherapy may also lead to resistance to the
chemotherapy. For these reasons adjuvant chemotherapy after CHARTWEL was not
planned.
The optimal chemotherapy or radiotherapy regime has not yet been found. It is hoped
that definitive information on optimal scheduling of chemotherapy and radiation and the
integration of newer agents into non-surgical treatment of patients with locally
advanced NSCLC will become available soon.
1.4 Three-Dimensional Conformai Radiotherapv to Treat Non-Small Cell Lung Cancer
There is scope for improvement in the results of radical radiotherapy to treat NSCLC.
Arriagada et al found that local control at follow up bronchoscopy was less than 20%
one year after radical radiotherapy [46]. Three-dimensional conformai radiotherapy
(3D CRT) allows shaping of treatment fields and dose distribution to the target volume
with the aim of delivering a high dose to disease and minimal dose to adjacent normal
tissues: lung, spinal cord, heart and oesophagus.
Saunders et al have shown that the use of the novel fractionation method, CHART, has
led to improved local tumour control and survival for inoperable NSCLC [26]. The
CHARTWEL dose esca]ation study demonstrated that escalating the dose from 54 to 60
Gy did not cause significant increase in acute or late morbidity and suggested that
omission of the weekend treatment did not compromise results [29]. Two-dimensional
(2D) radiotherapy treatment planning was used in those studies. In 2D planning a
composite volume, allowing a margin for microscopic extension, organ motion and set
scan. The 2D volumes were usually only drawn on a few slices and there was no
interaction between the information on the different slices to account for electron scatter
making the dosimetric information less complete in 2D compared with 3D planning.
It has been suggested that improving local control by optimisation of the radiotherapy,
with better localisation and delivery of dose to tumour and further sparing of normal
tissues, could have a greater effect on survival than trying to improve the treatment of
microscopic métastasés with chemotherapy [47].
In 3D CRT regions of interest are marked on every slice of the planning CT scan. The
planning system then creates a complete picture of the disease that may be viewed in
three dimensions.
Conformai shielding may be provided by divergent customised blocks or multi-leaf
collimators (MLCs). The treatment planning to ensure optimum positioning of
shielding is performed using beam’s eye view (BEV) apertures and suitable field
positioning to provide adequate dosimetric coverage of the PTV and optimal sparing of
normal tissues. 3D CRT planning systems make it possible to view the relationship
between normal structures and target volumes throughout the entire region being treated
by using the CT-based anatomical data to reconstruct organs within the computer
system. The BEV is able to rotate the reconstructed patient within the computer and
enable the planner to view the patient in the same orientation as a radiation beam
pointed in that direction [48]. Thus, by rotating the patient and examining the
corresponding graphic displays, beam orientations and shapes can be selected to ensure
that the target volume is covered by the beams and the normal tissues excluded as much
as possible. It can be shown that maximally separated beams give the best conformai
distributions but only if the directions of the beams are chosen to account for the shape
The potential advantages of 3D technology, in addition to more accurate assessment of
the tumour volume, include better coverage by external beams, improved assessment of
doses to critical normal structures and disease from dose-volume histograms (DVHs)
and tools to compare and assess rival plans [49, 50]. It is hoped that the use of 3D CRT
with accelerated radiotherapy may further improve cure rate and reduce normal tissue
morbidity by more accurate dose delivery to disease which may then facilitate dose
escalation.
The process of 3D CRT for NSCLC includes data acquisition, delineation of regions of
interest (macroscopic disease, tissues thought to contain microscopic disease and
critical normal tissues), techniques to minimise errors due to set-up and organ motion,
treatment planning, verification and implementation.
1.5 3D CRT Procedures
Data acquisition: Tumour and patient data for planning
Patients with inoperable NSCLC considered suitable for treatment with radical
radiotherapy will usually have been diagnosed by bronchoscopy or guided needle
biopsy and other investigations such as pulmonary function tests, CT scan of the chest
and abdomen, and sometimes mediastinoscopy and/or positron emission tomography
(PET) scans will have been performed. Information from all of these investigations is
incorporated into the gross tumour volume (GTV) definition and the treatment planning.
Imaging
All forms of radiotherapy suffer from inherent inaccuracy of the diagnostic images.
The resolution of the CT scans is a source of inaccuracy in the process of defining the
GTV and normal structures. The transverse resolution (typically 1 mm) and slice
through the thorax is therefore important. However, the thinness of the slices used is
limited by artefact caused by breathing and there is no advantage to use slices thinner
than 5mm in a breathing patient. Respiratory movement during scanning leads to “step”
irregularities and inaccuracy in the positions of the tumour and normal tissues. Blurring
which occurs on slower sequential scans may cause the tumour to appear bigger but the
blurring itself provides a margin of safety [51]. M odem spiral and multi-slice CT
scanners are so fast that when a planning scan is done on a breathing patient the whole
chest may be scanned in a limited part of the respiratory excursion. There may again be
“step” irregularities. The rapidity of the scan may also be such that the cancer was not
imaged near its mean position. Delivery of treatment planned on that position could
then result in geometric miss. CT window display settings may be varied to improve
delineation of the GTV [52]. Optimal settings have not been defined: central structures
in the mediastinum are usually seen better by using soft tissue window settings, whereas
peripheral tumours may be seen better using lung density settings. Whilst intravenous
contrast injections may be helpful to define abnormal lymph nodes in the diagnostic CT
scan, the use of contrast is not possible with some planning systems as it can alter the
tissue density and interfere with dose calculation algorithms.
Direct use of magnetic resonance imaging (MRI) for radiotherapy planning purposes
suffers from the following disadvantages:
• Geometric distortion of the image
• Absence of tissue density information
• Poor definition of bone
• Digitally reconstructed radiographs (DRRs) cannot be created
• Disease imaging is strongly dependent upon the scan settings
In the diagnostic setting MRI has the advantage of increased accuracy over CT in
![Table 1.4. International staging system, groupings of TNM subsets and survival (1997 version) [6].](https://thumb-us.123doks.com/thumbv2/123dok_us/8341402.1381606/30.595.48.483.87.419/table-international-staging-groupings-tnm-subsets-survival-version.webp)