University of South Carolina University of South Carolina
Scholar Commons
Scholar Commons
Theses and Dissertations
Summer 2019
Mechanical Characterization and Non-Destructive Evaluation of
Mechanical Characterization and Non-Destructive Evaluation of
SiC
SiC
ff/SiC
/SiC
mmComposites for Nuclear Applications
Composites for Nuclear Applications
Donald J. McCleeary
Follow this and additional works at: https://scholarcommons.sc.edu/etd
Part of the Mechanical Engineering Commons
Recommended Citation Recommended Citation
McCleeary, D. J.(2019). Mechanical Characterization and Non-Destructive Evaluation of SiCf/SiCm
Composites for Nuclear Applications. (Master's thesis). Retrieved from https://scholarcommons.sc.edu/ etd/5469
This Open Access Thesis is brought to you by Scholar Commons. It has been accepted for inclusion in Theses and Dissertations by an authorized administrator of Scholar Commons. For more information, please contact
M
ECHANICALC
HARACTERIZATION ANDN
ON-
DESTRUCTIVE EVALUATION OFS
ICF/S
ICM
COMPOSITES FORN
UCLEARA
PPLICATIONSby
Donald J. McCleeary
Bachelor of Science University of South Carolina, 2015
Submitted in Partial Fulfillment of the Requirements
For the Degree of Master of Science in
Mechanical Engineering
College of Engineering and Computing
University of South Carolina
2019
Accepted by:
Xinyu Huang, Director of Thesis
Jingjing Bao, Reader
ii
iii
DEDICATION
Written words, the most powerful tools of human expression, cannot adequately dedicate
this work to the many family, friends, and teachers that have graciously provided their
support and experience to the completion of this achievement.
iv
ACKNOWLEDGEMENTS
My advisor Dr. Xinyu Huang deserves the utmost credit, for without his extensive
knowledge, support, and ever-enduring patience none of this would be possible. Special
thanks also go to my mentors Dr. Jingjing Bao, Dr. Myoungseok Lee and Dr. Luis Alva
who provided useful assistance and lengthy instruction in matters of which I was ignorant.
Also, to my current and former peers in the lab, best wishes to you and your careers. Thanks
to General Atomics, specifically Dr. Hesham Khalifa and Dr. George Jacobsen who
provided critical materials, resources and collaboration in support of these projects. Finally,
thanks to my family, specifically my loving wife Kristie who has loudly supported my
endeavors, my parents Brad and Donna for pushing me to succeed, and my late grandfather
Don Snider who taught me the joy of hard work and success.
This work was performed at the University of South Carolina, Mechanical
Engineering Department, in collaboration with General Atomics. Funding was provided by
the Department of Energy Office of Nuclear Energy under the Accident Tolerant Fuel
Program, DE-NE0000566 and DE-NE0008222. This report was prepared as an account of
work partially sponsored by an agency of the United States Government. Neither the
United States Government nor any agency thereof nor any of their employees make any
warranty, express or implied, or assumes any legal liability or responsibility for the
accuracy, completeness, or usefulness of any information, apparatus, product, or process
v
Reference herein to any specific commercial product, process, or service by trade
name, trademark, manufacturer, or otherwise does not constitute or imply its endorsement,
recommendation, or favoring by the United States Government or any agency thereof. The
views and opinions of the authors expressed herein do not necessarily state or reflect those
vi
ABSTRACT
The SiCf/SiCm composite material is a promising candidate for accident tolerant
fuel cladding in light water reactors and for structural elements in high temperature
reactors. The material demonstrates exceptional toughness when compared to monolithic
ceramics. It is critical to characterize the mechanical behavior, internal damage and
ultimate strength of these composites under relevant loading conditions. In this thesis, the
author developed and improved several mechanical characterization and non-destructive
evaluation methods and applied them to SiCf/SiCm composites. Impulse excitation (IE)
analysis of damaged SiCf/SiCm composite disks following controlled impact testing shows
a direct relationship between the damage applied to SiCf/SiCm composite disks and changes
in the flexural and torsional resonant frequencies of the disks, as well as a proportional
relationship between the change in frequencies and energy absorbed. An experimental
exploration of the “size effect” of SiCf/SiCm composite tubes shows a relationship between
the length of the material and its burst strength. Samples consistently showed a UTS
increase of as much as 33% between samples of approximately 15cm lengths and those of
28cm lengths following repeated burst testing, though further testing is required to fully
understand the reasons for this reduction. In the context of SiCf/SiCm composites, novel
DIC setups are discussed which are improvements over traditional setups and have a higher
vii
using one camera and mirror splitting is tested and compared with a traditional DIC
two-camera setup, showing comparable results along with a host of extrinsic benefits.
Lastly, the mirror splitting concept is taken a step further in an exploration that uses a
six-mirror setup and telecentric lens to realize 360˚ surround views for the purpose of capturing
viii
TABLE OF CONTENTS
DEDICATION ... iii
ACKNOWLEDGEMENTS ... iv
ABSTRACT ... vi
LIST OF TABLES ...x
LIST OF FIGURES ... xi
LIST OF ABBREVIATIONS ...xv
CHAPTER 1: INTRODUCTION AND LITERATURE REVIEW ...1
1.1BACKGROUND ...1
1.2THE PROBLEM ...3
1.3SICF/SICM COMPOSITE CLADDING AS A SOLUTION ...5
1.4MECHANICAL CHARACTERIZATION ...8
1.5DIGITAL IMAGE CORRELATION ...9
CHAPTER 2:IMPACT TESTING AND IMPULSE EXCITATION RESPONSE OF SICF/SICMCOMPOSITE DISKS ...12
2.1INTRODUCTION ...12
ix
2.3IMPULSE EXCITATION ...16
2.4THE DROP WEIGHT IMPACT TEST ...19
2.5TEST SEQUENCE, ANALYSIS AND RESULTS ...23
2.6CONCLUSIONS ...34
CHAPTER 3:SIZE EFFECT AND FAILURE ANALYSIS OF SICF/SICM TUBES UNDER INTERNAL PRESSURE LOADING ...37
3.1INTRODUCTION...37
3.2THE SICF/SICM TUBES ...38
3.3DAMAGE BEHAVIOR AND THEORY OF SIZE EFFECT ...39
3.4TEST PROCEDURE ...43
3.5EXPERIMENTAL RESULTS AND ANALYSIS ...46
3.6CONCLUSIONS ...53
CHAPTER 4:NOVEL OPTICAL SETUPS FOR 2D/3D DIGITAL IMAGE CORRELATION SETUPS ...56
4.1 DIGITAL IMAGE CORRELATION ...56
4.2 THE TRADITIONAL 2D AND 3D APPARATUS ...58
4.3SINGLE CAMERA 3DDIC USING MIRROR SPLITTING TECHNIQUE ...60
4.4SINGLE CAMERA 2DDIC USING A 360° CIRCUMFERENTIAL VIEW ...68
x
LIST OF TABLES
Table 2.1:Summary of Impact and IE Data. *Estimated Value ...34
Table 3.1:Summary of Burst Test Results ...53
xi
LIST OF FIGURES
Figure 1.1:Fukushima Daiichi reactors 1-4 (right to left) following the March 11
Tsunami [3] ...2
Figure 1.2:LWR Heat/Time after Shutdown [2] ...4
Figure 1.3:SiCf/SiCm composite turbine blade [15] ...6
Figure 1.4: General Atomics SiCf/SiCm composite cladding winding process and material [17] ...7
Figure 2.1:Pristine SiCf/SiCm Disk (Disk 1), mark on bottom added to indicate orientation and impact side ...16
Figure 2.2:IE System Diagram [35] ...16
Figure 2.3:IE setup ...17
Figure 2.4:Display of antiflexural nodal and antinodal lines on flat disks [35] ...18
Figure 2.5:Sample graph showing locations of microphone and impulse point ...19
Figure 2.6:Instron Dynatup 8200HE ...21
Figure 2.7:Figure 2.7: (A) Clamping system with 1: Impact tup, 2: Cover plate, 3: Centering pins, 4: Polyethylene gaskets, 5: Impact foundation, and 6: Test sample. (B) Instruments near impact zone ...21
Figure 2.8:Disk 1 Back face. (A): After 2CM Impact, (B): After 4CM Impact ...24
xii
Figure 2.10:Disk 3 Back face. (A)-(E) follow tests (1)-(5) ...25
Figure 2.11: (A) Disk 1 Test 1 Load/Time, (B) Disk 2 Test 1 Load/Time, (C) Disk 1 Test 2 Load/Time, (D) Figure 2.14: Disk 2 Test 2 Load/Time ...27
Figure 2.12:Load/Time Graph including all load data from Disk 3 testing. Test 2 terminates early due to DAQ issue...29
Figure 2.13:Energy/Time Graph including all energy data from Disk 3 testing. Test 2 terminates early due to DAQ issue...29
Figure 2.14:(A) Disk 1 IE Frequency, (B) Disk 2 IE Frequency, (C) Disk 1 IE Damping, (D) Disk 2 IE Damping ...31
Figure 2.15:Disk 3 IE Frequency as recovered following the end of each test ...31
Figure 2.16:Disk 3 Damping as recovered following the end of each test ...32
Figure 2.17:Flexural and Torsional frequency change over cumulative absorbed energy. Torsional frequencies shaded with lighter color to distinguish from flexural. *Disk 3, Test 2 value is hollowed to indicate assumed energy absorption ...32
Figure 2.18: Figure 24: Flexural and Torsional damping change over cumulative absorbed energy. Torsional dampings shaded with lighter color to distinguish from flexural. *Disk 3, Test 2 value is hollowed to indicate assumed energy absorption ...33
Figure 3.1:Tube 3a Stress/Strain curve with AE as example of internally loaded SiCf/SiCm composite. Dashed indicators added to show the three regions of failure behavior...40
Figure 3.2:Burst rig oil flow diagram ...44
Figure 3.3:Internal pressure boundary experienced by the samples [14] ...45
Figure 3.4:Tube 2c attached to fixture following failure ...45
Figure 3.5:Various types of SiCf/SiCm tube failure with some examples. 1: Fully-arrested, 2: Semi-Fully-arrested, 3: Unimpeded, 4: Arrested edge, 5: Curved edge, 6: Unimpeded edge...47
xiii
Figure 3.7:Tube 1a Stress/Strain with cumulative AE energy ...49
Figure 3.8:Tube 1b Stress/Strain with cumulative AE energy ...50
Figure 3.9:Tube 2 burst sequence ...50
Figure 3.10:Tube 3 burst sequence ...51
Figure 3.11:Summary of UTS by sample length for all tests ...52
Figure 4.1:2D DIC Setup diagram [59] ...58
Figure 4.2:3D DIC Setup diagram [69] ...59
Figure 4.3:3D DIC Target ...60
Figure 4.4:Various mirror splitting setups discussed by Bing et. al [71] ...61
Figure 4.5:One camera 3D DIC rig using mirror splitting technique ...64
Figure 4.6:Visual test comparison of (A) two-camera 3D DIC system and (B) one-camera 3D DIC system with mirror splitting ...64
Figure 4.7:Computed E1 zero strain results of (left) two camera system and (right) One camera system with mirror splitting ...66
Figure 4.8:Loading test results of (left) two camera system and (right) one camera system with mirror splitting ...67
Figure 4.9:(Color) DIC of SiCf/SiCm composite tube under internal pressure loading. Green area shows locations of high hoop strain ...68
Figure 4.10:Diagram of mirror layout for “hall of mirrors” ...69
Figure 4.11:CAD design of hall of mirrors ...71
Figure 4.12:Assembled hall of mirrors fixture ...71
Figure 4.13:Hall of mirrors view including four views of tubular sample and sleeve ....72
xiv
Figure 4.15:Circumferential distribution of strain Exx on the midsection of the trial
xv
LIST OF ABBREVIATIONS
AE ... Acoustic Emission
ASTM ... American Society for Testing and Materials
ATF ... Accident Tolerant Fuel(s)
BCC... Body Centered Cubic
CVI ... Chemical Vapor Infiltration
DAQ ... Data Acquisition
DIC ... Digital Image Correlation
DOE ... Department of Energy
DWIT ... Drop Weight Impact Tower
ECCS ... Emergency Core Cooling System
FCC ... Face Centered Cubic
FFT ... Fast Fourier Transform
IE ... Impulse Excitation
LOCA ... Loss-Of-Coolant Accident
LWR ... Light Water Reactor
NDE ...Non-Destructive Evaluation
NITE ... Nano-Infiltration Transient Eutectic
ORNL ... Oak Ridge National Laboratory
xvi
RFDA ... Resonant Frequency and Damping Analyzer
SiC ...Silicon Carbide
SiCf/SiCm ... Silicon Carbide Fiber/ Silicon Carbide Matrix Composite
TEP ... Transient Eutectic Phase
1
CHAPTER 1
INTRODUCTION AND LITERATURE REVIEW
1.1 BACKGROUND
On March 11, 2011 a tsunami hit the coast of eastern Japan, causing a disruption in
coolant flow to the reactors located at the Fukushima Daiichi power plant. The accident
itself as well as the resulting release of radiation to the environment raised serious safety
concerns regarding the use of Zr fuel claddings. Shortly after the disaster occurred, the
United States Congress directed the Department of Energy (DOE) to focus efforts on the
research and implementation of fuels which could prevent core meltdown in the event of a
loss of coolant accident (LOCA). In response, the DOE started the Accident Tolerant Fuel
(ATF) program and began to gather talent and research attention to the issue by organizing
and channeling financial resources into industrial partners and universities [1]. The effect
of this action has produced an intense focus on ATF and since 2011 an expansive amount
of research has been completed on the subject.
In an exhaustive summary of the progress made in ATF since Congressional action,
Terrani [2] provides an extensive overview the three most actively pursued claddings, their
development, and the critical challenges that still must be overcome in each respective
field. His summary also includes the design philosophy of ATF cladding as well as
2
the information that was used in that review, including citations, are referenced in this
introduction.
Figure 1.1: Fukushima Daiichi reactors 1-4 (right to left) following the March 11 Tsunami [3]
Still, a great deal of work remains to be completed for the short-term and long-term
plans for the implementation of ATF. In the nuclear industry a culture of safety, careful
examination and detailed analysis leads to slow change and implementation of new ideas.
Despite this, the DOE has demanded results by 2022, when they expect commercialization
of ATF into existing light water reactor (LWR) systems to begin. Since 2012, the DOE has
primarily sponsored several leading nuclear developers, including Framatome, General
Electric, and Westinghouse Electric, each charged with developing a different set of ATF
3 1.2 THE PROBLEM
The primary goal of ATF is the reduction of cladding oxidation in the event of an
accident. When Zr cladding comes into contact with hot steam in a LOCA scenario, it
reacts exothermally to produce zirconia and hydrogen, which in the case of Fukushima
resulted in the explosions of reactor units 1, 2 and 3. This exothermic reaction is provided
in Equation 1 with the thermal energy product Q boldened for clarity. Needless to say, the
presence of hydrogen gas in an accident greatly compounds the severity and was a large
part of the terrible nature of the Fukushima Daiichi event. This reaction has a substantial
effect on the forecasted temperature of the system as well, as is shown in Figure 1.2,
driving the temperatures of the system to climb very high after initiation of the accident
and remain so for many days. If this reaction can be minimized or eliminated from the
system, the effect would be a substantial reduction in the temperature increase rate and
maximum temperature. This reduces, to a certain extent, the severity of a crisis while also
relieving a great deal of the burden placed on the emergency core cooling system (ECCS).
Figure 1.2 displays a graph of the heat added to the reactor system following a shutdown.
The main forms of cladding under consideration are coated Zr claddings,
iron-chrome-aluminum (FeCrAl) claddings, and silicon carbide fiber/ silicon carbide matrix
composite claddings (SiCf/SiCm). Westinghouse and Framatome are the industrial
developers responsible for the most part in research dealing with chrome coated zirconium.
As a cladding, it represents perhaps the easiest and most well understood cladding material
currently under research, due to the fact that the addition of a chromium layer to traditional
Zr claddings does not change the core mechanical behavior of the fuel. However, there are
4
with chrome coated Zr is that for a coolant-limited accident the rods can balloon and burst
at as low as 700˚C [5], effectively circumventing the chrome coating and exposing the
interior of the rod to oxidation. Also, Zr as a material is approaching its performance limit
within LWRs and is currently being phased out or eliminated entirely in future designs.
Figure 1.2: LWR Heat/Time after Shutdown [2]
𝑍𝑟 + 2𝐻2𝑂 → 𝑍𝑟𝑂2+ 2𝐻2+ 𝑄 (140𝑚𝑜𝑙𝑒𝑘𝑐𝑎𝑙[6]) (Eqn 1)
FeCrAl cladding is being developed by Oak Ridge National Laboratory (ORNL)
and General Electric and shows promising steam oxidation resistance up to its melting
point at approximately 1500˚C[7,8,9]. Austenitic Fe based claddings were the original
5
with Zr claddings because they were prone to react with the oxygen-rich coolants that were
used prior to the 1990’s, producing extreme cases of stress corrosion cracking. However,
changes to the crystal structure of Fe from face centered cubic (FCC) to body centered
cubic (BCC) have since shown to improve this performance problem [10], and the addition
of at least 22 wt% Cr content promotes the formation of protective chromia films [11,12].
However, the natural neutron absorption of Cr and Fe within these claddings is much higher
than that of Zr[13]. Also, BCC Fe alloys tend to allow tritium to escape from the fuel and
pass through the cladding walls. Its tritium permeability is two orders of magnitude higher
than Zr claddings [14].
1.3 SICF/SICM COMPOSITE CLADDING AS A SOLUTION
Silicon carbide (SiC) is one of the hardest materials known to man but is also very
brittle, which can create catastrophic failures under accidental conditions. It was found that
SiC fibers embedded in a matrix of monolithic SiC (SiCf/SiCm) could overcome this
problem by allowing the material to fail “gracefully” [15]. Judging by stress/strain curves,
this very effectively increases the strain-to-failure and adds a great deal of energy
dissipation during the failure process. Today, the use of SiC composites are rapidly
growing in aerospace industry because of their ability to maintain high strength, toughness,
rigidity, and creep resistance at high temperature.
All of the aforementioned qualities that make SiCf/SiCm composites ideal for work
in the aerospace industry would also make them suitable for use as cladding materials in
nuclear reactors. Therefore Westinghouse, in collaboration with General Atomics, was
charged by the DOE with developing SiC composite cladding for implementation.
6
oxidation resistance in steam, and for this reason SiCf/SiCm composite claddings made
from Generation III SiC fibers with chemical vapor infiltration (CVI) or nano-infiltration
transient eutectic phase (NITE) have been referred to as the ideal ATF cladding material
[2]. Add to this acceptable performance under neutron irradiation[16] and one would seem
to have a perfect solution to ATF.
Figure 1.3: SiCf/SiCm composite turbine
7
Figure 1.4: General Atomics SiCf/SiCm composite cladding winding process
and material [18]
However, SiCf/SiCm composites are not without challenges. The primary concern
with this material lies with the brittle nature of the matrix material. While the fiber
reinforcement does an excellent job of preventing catastrophic failure, damage to the
matrix itself in the form of cracks or even microcracks open pathways for radionuclide
release and develop a failure mode that is unique to SiC fuel cladding. Matrix cracking can
occur in SiC cladding due to mechanical stress applied to the cladding itself or as a result
of the temperature gradient and neutron irradiation that the cladding experiences [2].
Furthermore, SiC cladding encounters a particular manufacturing issue when it comes to
fabricating end plugs for the clad. Katoh et. al. [19] cite these two mechanical issues as
some of the key problems facing SiC cladding, though since then General Atomics has
developed a method to seal the ends of SiC cladding with a “high-purity SiC joint that
8
Terrani [2] focuses on reiterating the potential for radionuclide release as a cause
for major concern. He suggests that this may be overcome by adding a protective metal
layer of some kind which would prevent radionuclide release in the likely event of matrix
cracking. The protective barrier would also protect the cladding from another weakness of
SiC: corrosion in the presence of high temperature, high pressure water, which he calls
hydrothermal corrosion, that occurs as SiC reacts with O in the coolant water to produce
soluble silica, as well as CO, CO2, and CH4.
1.4 MECHANICAL CHARACTERIZATION
As can be guessed from the aforementioned details regarding ATF claddings,
before commercial production and implementation of the material begins every detail of
these fuels must be studied, characterized, modelled and optimized for use in real reactor
systems. A significant piece of the puzzle is mechanical characterization and behavior
analysis of the cladding material. By simulating stress states and environmental conditions,
experimentation on the cladding is the only way to grasp how the material will actually
perform under relevant loading conditions. Furthermore, models used to predict this
behavior rely on experimental data for validation, leading to verified models that can be
confidently relied on to provide useful projections. Many experiments have been devised
to qualify the behavior of cladding materials under expected and accidental LWR
conditions, including tensile, torsion, internal pressure, external pressure, drop weight
impact, Charpy impact, creep, quench, and extended vibration tests. Furthermore, many
combinations of these loading conditions have been implemented to characterize the
9
In this work, two important material behaviors are discussed and experiments
carried out in the context of SiCf/SiCm composites. The first is referenced in Chapter 2 and
discusses impulse excitation (IE) analysis of damaged SiCf/SiCm composite disks. Three
as-fabricated SiCf/SiCm composite disks of similar geometry were impacted in order to
induce a controlled amount of damage to each specimen. After each test IE results were
collected and tabulated in order to gauge whether there is a change in the flexural and
torsional frequencies and damping. The results of impact testing are displayed as well as
IE change across each test.
The second facet tested in this work is that of mechanical behavior of SiC tubes
under internal loading conditions and of a size effect that may be present within the
material. This is thought of to be due to the probability of manufacturing defects residing
within the material and is manifested by an increase in material strength as the sample
becomes shorter. Burst tests were conducted to find evidence of a size effect and to attempt
to quantify it, the results of which can be found in Chapter 3. Three tubular samples of
geometries resembling cladding material were burst using a hydraulic internal
pressurization method. Typically, when SiCf/SiCm composite tubes are burst in this
manner, a short hinging crack develops across a small portion of the tube. In this study,
these portions were then removed from the sample by cutting with a diamond blade and
were then used as more test specimens. Testing samples in this manner can provide clues
as to whether a size effect exists.
1.5 DIGITAL IMAGE CORRELATION
SiC composites are inherently anisotropic and do not exhibit uniform strain within
10
the material behavior and can lead to an incorrect analysis if the cladding strain is not
properly mapped. Digital image correlation (DIC) is an excellent tool with which a portion
of the strain field on the outer surface of a test specimen can be viewed and quantified. DIC
was originally proposed for this purpose by Sutton et. al. [20] in 1985 and since that time
has become a widely used and trusted technique in industry and academia to observe strain
patterns in materials. Using this technology for the research of SiCf/SiCm composites is a
logical step in understanding the matrix-fiber interaction during failure.
Even so, work still needs to be done to improve this measurement tool. One primary
problem with DIC is that it only views a small area of the surface of a specimen, when in
the context of SiC composites this may be a deficient practice as it can be difficult to predict
where failure may occur. This problem can be mitigated with the use of multiple cameras
and DIC setups, but this becomes further complicated with time consuming setup, the
multiplied cost of having multiple cameras, data buffers that are too small, synchronization
errors, and error in DIC results caused by differences in sensitivity between cameras.
In Chapter 4 of this work, two novel setups are described which can alleviate these
problems using optics designed for single optics. The first setup is for a 3D DIC system
using a single camera which was first suggested by Inaba et. al. [21]. This setup cuts the
necessary number of cameras in half while reducing sensitivity error and eliminating
entirely problems with camera orientation, data buffering, and synchronization problems
when only one view of the specimen is required. The second setup is similar to the first but
takes the design a step further by introducing a large telecentric lens and two rear-view
11
sample (such as nuclear fuel cladding) in order to capture imagery of the site of failure and
12
C
HAPTER2
I
MPACTT
ESTING ANDI
MPULSEE
XCITATIONR
ESPONSE OFS
ICF/S
ICFM
C
OMPOSITED
ISKS2.1: INTRODUCTION
Since SiCf/SiCm composites are quite new to researchers, there exists a need to
discover simple nondestructive evaluation (NDE) methods by which SiC composites can
be tested to gauge damage within the material [22]. Unnthorsson et. al. [23] describe the
three stages of life of composite materials, and damage effects that can be encountered
within those stages. The first stage begins with the manufacturing of each component and
reveals the very real possibility that composites can begin to accrue damage even before
assembly. This work is discussed more later in this thesis in the context of size effect, but
here it shows the sensitivity in quality of composite materials.
For brittle isotropic specimens, impact damage is typically associated with failure
and is usually simple to determine by visual inspection. This is because most of the energy
that would occur during an impact is deflected back to the impactor or otherwise removed
from the sample via other forms of energy such as vibration or sound. It is only when the
amount of impact energy passes a certain threshold (e.g. stress leading to response in excess
of proportional limit strain) that the sample begins to absorb more energy and the material
structure is changed as a result. In this case, structures will deform, crack, or rip, essentially
13
In contrast, SiC composites can accrue damage without failing catastrophically.
Once past the loading threshold for damage to occur, the SiC composite specimen can fail
locally in a variety of ways, namely matrix cracking, interfacial debonding, delamination,
and tow breakage [24,25]. However, the local occurrence of damage may not necessarily
lead to failure of the entire specimen. If catastrophic failure occurs, it is largely related to
the performance of the fiber-matrix interface. What complicates this is that the acquisition
of damage by the sample may not be simple to determine. Much of the energy absorbed as
damage in a SiCf/SiCm composite occurs within the body of the structure as opposed to
being visible on the surface [26]. Also, the full nature of the damage may not be readily
visible or appreciable under X-ray tomography [27]or ultrasonic analysis [28]. Truesdale
[29] lists nine NDE techniques and cites many disadvantages to NDE methods, which
include limits in material use, limitations in sample geometries, complex or expensive
setups and extensive calibration requirements. Furthermore, none of these methods provide
a swift and easy means by which damage in the specimen may be quantified. Acoustic
Emission (AE) as an NDE method can provide a better description of damage, but a
disadvantage of AE is that it cannot be collected after a sample has accrued damage and
must be active during the entirety of the damage event. Also, AE NDE is further limited to
analysis of the energy due to acoustic release of damage and may not be indicative of all
energy absorbed as damage by the specimen.
IE is a nondestructive technique through which delicate changes in a material can
be discovered by impulsing or applying a small impact to the specimen [30]. When
supported freely and suspended along nodal lines, every specimen will react to excitation
14
frequencies which are dependent on the material properties and geometry of the specimen
and can be analyzed by passing the signal through a fast Fourier transform (FFT) to deduce
the major frequencies. Because of this, important material properties can be deduced from
the associated frequencies, such as elastic modulus, shear modulus, and Poisson’s ratio
[30,31], though this is always discussed in traditionally accepted literature from the context
of isotropic materials. However, it is worth noting that research performed at ORNL shows
promising results in using IE to accurately measure the material properties of SiCf/SiCm
composite bars [32], and that Truesdale further explores this idea in the context of cladding
geometries and finds Young’s modulus and shear modulus within acceptable error [29].
Truesdale also points out that IE provides limited damage categorization. While this is true
in that specific types of damage (pre-existing or otherwise) are difficult to determine using
IE alone, it is important to note that the shift of IE response indicates a change of the status
of the material, even though the specific location and form of the material change (damage)
may be difficult to interpret in detail using IE alone. This technology is also intuitive and
has been implemented in damage detection for over 100 years, dating at least as far back
as the early implementation of trains and railroads when service personnel called modal
specialists would test each train wheel with a hammer and listen for variations in the
response [33].
In the case of fiber/matrix composites the material property data becomes unclear,
but the resonant frequencies produced are still dependent on material geometry. As such,
it stands to reason that as a fiber/matrix composite absorbs energy in the form of damage,
those frequencies should change as well [34]. Truesdale discovered a direct correlation
15
damage it had accrued in the process of various loading programs. As damage was induced
on the composite claddings, the frequencies became lower and the dampings of each mode
became higher. If IE is to be used for damage detection, it would be useful to find ways to
connect change in frequency and damping to quantitative measures of damage. One
quantitative measure of damage may be total energy absorbed over the course of damage,
but assuming that the change in frequency of a sample is somehow correlated to energy
absorbed, it would require controlled examination to establish a trend. To gather results
from such an experiment, a drop weight impact tower (DWIT) was used to impact
multilayered SiCf/SiCm composite disks under controlled conditions and record the energy
absorbed, and IE instrumentation was used in accordance with American Society for
Testing and Materials (ASTM) standards to measure the frequency response prior to the
controlled impact.
2.2 THE SiCf/SiCm FLAT DISKS
Three samples, here labelled disks 1, 2 and 3, were provided by General Atomics
for testing. Each were of similar flat disk design, measuring approximately 50mm in
diameter by 3mm in thickness. These disks were made up of a β-phase monolithic SiC
matrix sandwiched around multiple laminae of woven SiC fibers and were manufactured
using transient eutectic phase (TEP) processing via hot pressing. It is important to note that
the TEP process is noticeably different than the CVI process in that a hot press is used for
powder compaction. Each sample was lightly polished by the manufacturer to remove
16
Figure 2.1: Pristine SiCf/SiCm Disk (Disk 1),
mark on bottom added to indicate orientation and impact side.
2.3 IMPULSE EXCITATION
The system used to measure the impulse excitation response of the SiCf/SiCm disks
was an IMCE resonant frequency and damping analyzer (RFDA) IE suite designed for
measuring material properties according to ASTM standards E1875 [35] and E1876 [36].
The system consists of a sample scaffold, a microphone, and computational tools used in
the collection, measurement, and recording of high frequency material responses.
17
The material in question was suspended on a set of wires along the nodal lines of
the material to prevent the wires from interfering with the response of the material. Then,
the material was quickly struck by an impulsor with low force in order to excite a harmonic
response from the material. This response, subdivided into torsional and flexural vibration
modes, was picked up and recorded by the sensitive microphone. Two properties of the
resonant vibration modes were recorded: The resonant frequency and the damping of the
signal. The specific frequencies produced are inherent to the geometry and consistency of
the matter making up the specimen, and so are the damping ratios which represent the
vibrational losses of the material [37].
Figure 2.3: IE setup
Flat disks can vibrate in various flexural and torsional modes. Torsional vibration
can be thought of as a wave emanating from the center of the disk and stretching out to the
edges of the disk, always remaining concentric with the center. Flexural vibration occurs
in four quadrants of the disk and its motion behavior is represented by nodal and antinodal
18
whereas the antinodal lines represent the maxima. Samples are aligned on two
perpendicular suspension cables of small thickness so as to match the nodal lines as closely
as possible and prevent the line from interfering with signals generated by the impulse.
Figure 2.4 displays the concept of the anti-flexural nodal and antinodal lines on disks.
Figure 2.4: Display of antiflexural nodal and antinodal lines on flat disks [36]
This measurement followed ASTM E1876 [36]. The samples were positioned on
the setup as previously discussed and a microphone was positioned at the antinodal
intersection opposite of the point of the impulse. Each impulse was performed manually
using an impulsor, a steel ball attached to a flexible polymer rod, at the position indicated
by the diamond shape in Figure 2.5. Care was taken to use approximately the same amount
of force with each impact, but this has little effect on the frequencies and damping signal
produced as it is material dependent, and independent of the amplification of the impulse
itself. The impact force of the impulsor was enough to provoke a material response while
not saturating the microphone or causing damage to the sample. Validation of this table
mounted IE test method was performed by Truesdale [29], using a similar setup. Using this
19
using the Timoshenko formulations for elastic moduli based on vibration response [38] and
results compared with published values to with 4% error.
Figure 2.5: Sample graph showing locations of microphone and impulse point
Every impulse response was recorded by the microphone and checked for
anomalies. Responses from poorly applied impulses that did not match the characteristic
shape of a harmonic response were discarded. Impulses which did match were saved and a
total set of 20 measurements were recorded for each sample measurement.
2.4 THE DROP WEIGHT IMPACT TEST
The test setup used for impacting the flat SiCf/SiCm TEP composite disks was a
modified Instron Dynatup 8200-HE impact tower. The system consists of a striking piece
(called a tup) that is fastened to a cart of adjustable weight which fits along two low-friction
guide rails. The cart is hoisted to a specified height by a pulley system connected to a
carriage. A simple push on the latch system that holds the cart and carriage together releases
20
lower base and a rigid cover plate, the purpose of which was to keep the sample centered
and fixed into position. Just before the impact tup strikes the sample, a pronged flag passes
through an optical laser sensor that outputs binary wave data to the data acquisition (DAQ)
unit. This provided the velocity of the cart just before impact. Upon impact, a load cell
fastened at the base of the tup sent the DAQ load data throughout the entirety of the impact,
which usually lasted on the order of 5~10ms. Two DAQ systems were used during these
tests. The first DAQ system had a sample rate on the order of 10,000 samples per second
and was used for the testing of Disk 1, Disk 2, and the first drop test of Disk 3. The second
DAQ system used from Disk 3, Test 2 through the rest of the testing had a capture rate on
the order of one million samples per second.
The standard used for the assembly of this test was ASTM D7136 [39] which covers
drop weight impact tests of fiber reinforced polymer composites. The differences here are
that ceramic composites are being investigated and that the impact tup used for this test is
spherically capped as opposed to the hemispherical tup recommended in the standard. Also,
the directive of the standard is the measurement of damage resistance, whereas the
objective of this investigation is to apply and quantify a certain amount of load or damage
and then monitor the change in IE results.
The sample holding fixture was designed such that the sample could be securely
held in all directions and lightly supported around the circumference of the sample to
prevent motion during and after impact. This differs from the ASTM standard in that
clamps are not applied directly to the surface of the specimen. It was decided that the
sample geometry and small size would not support this. Therefore, a cover plate was
21
perfectly around the sample, keeping it in place. A polyethylene sheet was also used to
soften the contact between the cover plate and the sample, ensuring equal pressure around
the circumference. Figure 2.7(A) depicts this clamping configuration.
Figure 2.6: Instron Dynatup 8200HE
Figure 2.7: (A) Clamping system with 1: Impact tup, 2: Cover plate, 3: Centering pins, 4: Polyethylene gaskets, 5: Impact foundation, and 6: Test sample. (B)
Instruments near impact zone
The impact tup used was a spherically capped tool steel tup from PCB with
22
by which controlled damage could be applied to the specimen and a high surface area
impactor seemed a logical choice to perform controlled experimentation on brittle ceramics
such as SiC without destroying the sample. Therefore, a spherically capped tup was used
that in terms of function falls between the hemispherical and flat tup geometries. In a paper
that discusses this subject in the context of low velocity impacts, Cheon et al. [40] compare
several impactor geometries and conclude that both the hemispherical and flat tup
configurations “displayed similar energy dissipation and failure mechanisms.” The
difference found between the two was that the flat impactor induced comparatively less
internal damage at the expense of more damage accumulation at the zone of impact. In this
study no discernable damage was detected at the zone of impact.
The process of the drop tests proceeded as follows. First, the sample was loaded
onto the sample holding fixture shown in Figure 2.7(A) and covered with the cover plate.
The cover plate was then clamped down using the support clamps to lock the sample in
place An overview of the instrumentation and fixtures near the clamping configuration is
given in Figure 2.7(B). A plastic cover was placed over the cover plate temporarily to
prevent the event of accidental drops hitting the sample. At that point the impactor was
lowered to lightly touch the sample in order to gauge the zero position and adjust the flag
prong to trip the velocity sensor within 6mm above the zero position as is standard. Next,
the impactor system was slowly raised using an electric pulley system until the desired
height was reached. This was measured by the measuring tape attached to the back of the
device and a fixed position laser on the back of the carriage was used to indicate the
distance. Knowing the position at which the tup contacts the sample, the total drop height
23
working order before the DAQ was activated and the test was run by pulling the mechanical
trigger bar which connects the cart to the carriage. After the test, the cart was carefully
pulled back up and locked into the carriage and the sample was removed for inspection and
IE.
2.5 TEST SEQUENCE, ANALYSIS AND RESULTS
Two disks (1 and 2) were put under the same loading circumstances: two tests at
drop heights of 2cm and 4cm respectively under similar loading conditions. Disk 3 was
impacted repeatedly at a drop height of 2cm five times. IE measurements were taken prior
to each impact and once after the last test, as well as images of the sample. During IE, each
sample was centered on the suspension lines by measurement with the impact side facing
up and oriented in the same direction. While the determination of the nodal lines of an
isotropic flat disk are arbitrary, it was considered best to align these composite disks along
the crossed suspension wires in line with the visible portions of the woven fibers near the
surface of the sample. Also, each sample was tested in sequence and with similar loading
orientations.
The back face of the composite specimens is the best visible indicator of damage
on the sample. Four radial cracks appeared on the surface of the back face after a sufficient
amount of damage was applied to the disk. Testing continued after the appearance of the
radial cracks due to the fact that the structural integrity of the sample was maintained. Only
after complete fragmentation of the disk did testing end. Figures 2.8-2.10 showcase the
24 Figure 2.8: Disk 1 Back face. (A): After 2CM Impact, (B): After 4CM
Impact
Figure 2.9: Disk 2 Back face. (A): Pristine, (B): After 2CM Impact, (C):
25
Figure 2.10: Disk 3 Back face. (A)-(E) follow tests (1)-(5).
Data analysis on the load and velocity data was performed in order to reveal the
load, velocity and displacement information and calculate estimated absorbed energy in
accordance with ASTM D7136. First, load data was converted from a voltage to force in
Newtons according to the manufacturer specifications of the load cell. This was divided by
the mass of the cart, which was constant throughout all tests at 2.76kg, and then integrated
26
velocity sensor data was then used to supply the calculation with an initial velocity.
Knowing the distance between the two prongs of the flag, a simple calculation was
employed using the timestamps of the velocity sensor data to find the velocity of the cart
just before impact. A modifier including the acceleration of gravity and the known time
before impact was added to this number to estimate initial velocity at impact, and Equation
2 was used for this calculation. Next, the measured impact energy of the event was
calculated. Using the impact location as the reference position δi, Equation 3 was used to
calculate the displacement versus time, and these values were finally used in conjunction
with the velocity analysis according to Equation 4 to find the absorbed energy versus time.
Total absorbed energy was collected by subtracting the absorbed energy at the end of the
test from the value at the beginning of the test (usually zero) [41]. Graphs showing load
and energy versus time data for each specimen are provided in Figures 11-14. A chart
showing drop height, maximum load and absorbed energy is also provided with IE data in
Table 2.1.
𝑣(𝑡) = 𝑣𝑖 + 𝑔𝑡 − ∫0𝑡𝐹(𝑡)𝑚 𝑑𝑡 (Eqn 2)
𝛿(𝑡) = 𝛿𝑖+ 𝑣𝑖𝑡 +𝑔𝑡
2
2 − ∫ (∫
𝐹(𝑡) 𝑚 𝑑𝑡 𝑡
0 ) 𝑑𝑡
𝑡
0 (Eqn 3)
𝐸𝑎(𝑡) =𝑚(𝑣𝑖
2−𝑣(𝑡)2)
27
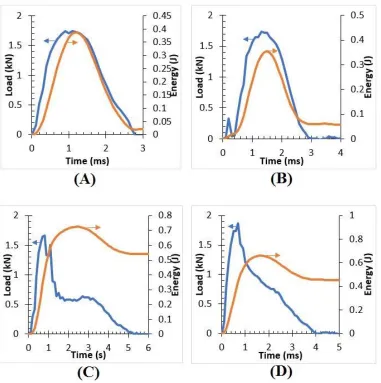
Figure 2.11: (A) Disk 1 Test 1 Load/Time, (B) Disk 2 Test 1 Load/Time, (C) Disk 1 Test 2 Load/Time, (D) Figure 2.14: Disk 2 Test 2 Load/Time
From Figure 2.11, it is shown that higher drop heights provide more brittle impact
regimes. This can be seen by the differences between the 2cm drop tests and the 4cm drop
tests. After each 2cm impact, the load diagrams yield nearly symmetric bell-shaped curves,
which represent high energy deflection and low energy absorption [42]. Compare this with
the energy curves and energy absorbed of those tests. Tests 2 for both disks show a much
different outcome following the 4cm drops. These load curves are very asymmetrical and
28
Figures 2.12 and 2.13 provide an overview of the load and energy results of Disk
3. A few anomalies in this test sequence are important to point out: First, Tests 2 and on
were conducted with a DAQ which had a higher sample rate on the order of one million
samples per second compared to the previous DAQ which captured samples at a rate on
the order of 10,000 samples per second. Also, during Test 2 a collection error occurred
which prevented the recording of the last portion of the load curve. Because of this, the
energy curve is similarly affected. It is likely that the load curve for Test 2 should terminate
somewhere between Tests 1 and 3, and that the energy curve should behave similarly.
It is convenient in Figure 2.12 to watch how the load curves change with
progressive testing. As the disk is impacted, the load curves reach lower maximum loads,
while stretching out the impact over a longer period of time and becoming more
asymmetric. This may indicative of the sample moving from a matrix dominated cracking
regime to a fiber dominated deformation regime as the damage progression moved from a
phase of breakage initiation to breakage spreading [43]. The fracture toughness itself is
highly dependent on the interphase, the quality of which is a difficulty of the TEP process.
As the sample absorbs energy, it becomes less brittle and more tough which makes the disk
more effective at absorbing energy. A review of Figure 2.13 verifies this analysis. As the
sample is progressively damaged, the energy absorbed appears to move from a consistent
0.065J to higher values. The curves also appear to begin stretching out to longer periods
29
Figure 2.12: Load/Time Graph including all load data from Disk 3 testing. Test 2 terminates early due to DAQ issue.
Figure 2.13: Energy/Time Graph including all energy data from Disk 3 testing. Test 2 terminates early due to DAQ issue.
0 200 400 600 800 1000 1200 1400 1600 1800
0 1 2 3 4 5
Load (N) Time (ms) Test 1 Test 2 Test 3 Test 4 Test 5 5 4 2 1 3 0 0.05 0.1 0.15 0.2 0.25 0.3 0.35 0.4
0 1 2 3 4 5
30
IE data was collected following each test and is provided in the scatterplots in
Figures 2.14, 2.15 and 2.16. The IE measurements were very repeatable and errors in
measurement in every case were on the order of 2-3 Hz or within 0.03% of the lowest
recorded values. Therefore, measurement error is omitted here as negligible. Figure 2.14
shows IE frequencies and associated dampings for testing of Disks 1 and 2. It is clear that
the frequencies for both samples decrease at an almost identical pace. Also, change
between IE measurements become much different after the 4cm drops, in which the
samples absorbed more energy as previously discussed. This is also seen in Figure 2.14
(C) and (D)wherein damping rises at a much larger pace than in the 2cm drops.
IE results from the testing of Disk 3 are shown in Figures 2.15 and 2.16. Frequency
and damping results show consistent and progressive changes throughout the course of
testing. As damage is produced in the sample, frequency falls and damping rises. This
agrees with the IE data from Disks 1 and 2. In fact, frequencies for all three samples begin
in a similar vicinity and then appear to fall in similar proportion to damage absorbed. The
same could be said for damping. Figure 2.17 shows a plot of change in frequency over
total energy absorbed by each sample. The energy absorbed value for Disk 3, test 2 had to
be estimated based on results from tests 1 and 3. Because there are clear trends shown
between damage absorbed and IE results, it was decided that test 2 must have energy
absorption results similar to tests 1 and 3, and Table 2.1 and Figure 2.17 reflects this
31
Figure 2.14: (A) Disk 1 IE Frequency, (B) Disk 2 IE Frequency, (C) Disk 1 IE Damping, (D) Disk 2 IE Damping
Figure 2.15: Disk 3 IE Frequency as recovered following the end of each test.
0 5000 10000 15000 20000 25000
Fresh Test 1 Test 2 Test 3 Test 4 Test 5
Fr
eq
u
en
cy
[Hz
]
32
Figure 2.16: Disk 3 Damping as recovered following the end of each test.
Figure 2.17: Flexural and Torsional frequency change over cumulative absorbed energy. Torsional frequencies shaded with lighter color to distinguish from flexural. *Disk 3, Test 2 value is hollowed to indicate
assumed energy absorption. 0
0.002 0.004 0.006 0.008
Fresh Test 1 Test 2 Test 3 Test 4 Test 5
D amp in g [Hz ] Flexural Torsional
y = -10738x + 19915 R² = 0.9511
y = -5726.5x + 12854 R² = 0.9221
0 5000 10000 15000 20000 25000
0 0.1 0.2 0.3 0.4 0.5 0.6
Fr e q u e n cy [Hz]
Cumulative Energy Aborbed [J]
Disk 1
Disk 2
Disk 3 Flexural
33
Figure 18: Flexural and Torsional damping change over cumulative absorbed energy. Torsional dampings shaded with lighter color to distinguish from flexural. *Disk 3, Test 2 value is hollowed to indicate
assumed energy absorption.
Figure 2.17 shows a linear trend between the frequency change experienced by
the composite disks and the cumulative energy absorbed. This trend was calculated using
Microsoft Excel via the least-squares method and appears to be very stable to within a
coefficient of determination of 0.95 for flexural and 0.92 for torsional frequencies. This
shows that the energy absorbed by SiCf/SiCm composite disks are directly related to the
change in frequency observed by IE. Figure 2.18 shows a less predictable trend between
the damping and energy absorbed. 0 0.001 0.002 0.003 0.004 0.005 0.006 0.007 0.008 0.009 0.01
0 0.1 0.2 0.3 0.4 0.5 0.6
Da
m
p
in
g
Cumulative Absorbed Energy [J] Disk 1
Disk 2
Disk 3
Flexural
34
Table 2.1: Summary of Impact and IE Data. *Estimated Value
Sample/Test Number Drop Height [cm] Maximum Load [kN] Energy Absorbed [J] Flexural Frequency [kHz] Torsional Frequency [kHz]
Disk 1 / Pristine N/A N/A N/A 19.7 12.7
Disk 1 / Test 1 2 1.74 0.018 19.0 12.3
Disk 1 / Test 2 4 1.67 0.541 13.1 9.1
Disk 2 / Pristine N/A N/A N/A 20.1 13.0
Disk 2 / Test 1 2 1.74 0.058 19.3 12.6
Disk 2 / Test 2 4 1.87 0.453 15.0 10.5
Disk 3 / Pristine N/A N/A N/A 20.9 13.5
Disk 3 / Test 1 2 1.57 0.066 19.2 12.5
Disk 3 / Test 2 2 1.41 0.066* 18.0 11.8
Disk 3 / Test 3 2 1.31 0.066 17.5 11.4
Disk 3 / Test 4 2 1.22 0.152 16.3 10.9
Disk 3 / Test 5 2 0.91 0.181 14.8 10.0
2.6 CONCLUSIONS
It is clear that as the disks absorb more energy, frequency and damping of the IE
results show predictable change. As damage occurs in the SiCf/SiCm composite, cracking
within the volume of the material lead to a change in structural integrity which can be
tracked using impulse excitation. It is shown that after each impact, flexural and torsional
frequencies fall and damping rises in each case, and that this change is directly proportional
35
composites can be quantified via frequency change. This research suggests the possibility
that a specimen in a state of unknown induced damage can be measured in this manner and
that the damage, quantified in terms of frequency change and energy absorbed, can be
estimated and evaluated. However, damping does not show a stable trend with energy
absorption. There does appear to be a relationship in that damping in the sample rises with
accumulation of damage, but it does not fit as well in a direct relationship. It is likely that
other factors, such as type, distribution and location of damage affects the damping signal.
If this is the case, then it may mean that recorded damping represents a more promising
method by which damage can be evaluated in detail. Future research may uncover critical
correlations between damping behavior and specific types and severity of damage.
It is probable that material properties and the geometry of the composite control the
change in frequencies and damping, and that a holistic evaluation of a SiCf/SiCm
composites may yield methods by which pieces can be tested for manufacturing defects
and prior damage before use in application. For example, it is shown here that the flexural
frequencies of these composites were measured in a similar range on the order of 20kHz.
If a similar sample is measured and found to have a flexural frequency much lower than
this value, then it is justified to conclude that there is some difference in the material, and
the correlating estimation of energy absorbed may be useful in determining whether the
material is still fit for service. The challenge with such an analysis is that a great deal of
testing would be required to properly differentiate between allowable and non-allowable
frequencies. It may also be possible to use IE analysis to predict failure behavior under
specified loading conditions, or to analyze the crack healing behavior of some related SiC
36
The fact that change in frequency can be used to estimate energy absorbed as
damage by a specimen has large implications in the field of damage monitoring. Not only
can frequency analysis of SiCf/SiCm composites suggest that damage has occurred, it can
also suggest the severity of damage. If future research can reproduce these results in other
sample geometries and qualify failure criteria under specific loading conditions in terms of
total absorbed energy, then it becomes possible that IE can be used to estimate crucial
aspects of material performance. The severity of accidental damage, structural stability and
37 CHAPTER 3
SIZE EFFECT AND FAILURE ANALYSIS OF SICF/SICM TUBES UNDER
INTERNAL PRESSURE LOADING
3.1 INTRODUCTION
As previously discussed, SiCf/SiCm composites are being researched as candidates
for nuclear fuel cladding in the creation of ATF. Therefore, it is necessary to qualify these
composites using the proper geometry and conditions necessary to meet that goal. One
important stress state that fuel cladding must endure during accidents is internal pressure
loading. In accident situation, pressures on the inside of the cladding can exceed the outside
pressure and cause the cladding to burst. Work has been focused on researching the elastic
moduli, leak rate and burst pressures of SiCf/SiCm claddings under load [45,46,47].
In the event of any accident within a nuclear reactor, the cladding must be able to
contain the fuel and prevent it from contaminating its surroundings [48]. SiCf/SiCm is a
good candidate for this role due to several reasons. First, upon passing the proportional
limit strain (PLS), the composite begins to break down gracefully as the woven fibers begin
to take load. This exchange allows the composite structure to last much longer under
increasing load than a monolithic structure. Also, when ruptures in fiber tows begin to
occur and propagate, the composite is capable of arresting the spread of failure and can
38
In this study, the size effect of SiCf/SiCm tube geometries were investigated by
repeatedly measuring burst ultimate tensile stress (UTS) from internal pressure loading as
an indicator of strength. These were loaded using a hydraulic internal pressurization
method in order to determine ultimate strengths under hoop loading. Once burst, the
destroyed portion of the tubes were cut off producing one or more additional samples. Burst
testing continued in this manner until the remaining pieces were too short to test.
3.2 THE SICF/SICM TUBES
Three samples listed here as Tubes 1, 2 and 3 were provided by General Atomics.
The SiCf/SiCm composite tubing used was manufactured via CVI and were composed of
woven layers of stoichiometric grade Hi-Nicolan Type S fibers woven in a tubular
geometry using a mandrel to define the inner and outer diameters of the fiber preform. This
was followed by chemical vapor deposition of pyrolytic carbon to a thickness of less than
500nm. Finally, the CVI process was used to deposit a stoichiometric β-SiC matrix using
decomposition of methyltrichlorosilane. Each of the three samples tested were
manufactured within the same batch under one gas flow, pressure and temperature regime
which was expected to make each sample uniform with respect to material quality [50].
However, it is important to note that these specimens are non-standard, early generation
material from General Atomics and are not representative of current fuel cladding
engineered design. In particular, fiber architecture and defect distribution appears to have
led to a material showing roughly 2x reduced UTS and an expectedly greater defect
39
Each tube originally measured approximately 28cm in length, with an outer
diameter of 11mm and wall thickness of 1.5mm as measured by calipers. Measurements of
the samples were taken with a special micrometer designed for measuring inner diameters
and with calipers to get the dimension of the outer diameter. These measurements were
taken using an average of multiple measurements collected across the length and around
the circumference of the specimens. In this case, the inner and outer diameters of the SiC
tubes in question are fixed due to geometric constraints for the cladding, but the length of
these claddings can be adjusted in the lab for testing. In reality, the length of the cladding
is also fixed by the length required by the reactor, but to test claddings at that scale (on the
order of 4 meters) would require extensive manufacturing and expenditure. Instead, shorter
samples can be tested in order to predict the overall strength of a material in the absence of
defects, and to view the change in strength as defects are removed from the specimen.
3.3 DAMAGE BEHAVIOR AND THEORY OF SIZE EFFECT
When pressurized, a SiCf/SiCm composite tube follows a predictable pattern of
damage and failure. In his work on the subject, Alva [52] details this pattern of behavior
by reviewing the AE data collected from internal pressure tests and concludes that there
are three primary regions of damage accumulation leading to failure of the specimen. First,
as the sample begins to be loaded the matrix material takes the brunt of the pressure in the
elastic region, providing little acoustic emission events and exhibiting a linear stress/strain
relationship. Once the load reaches the PLS, the matrix begins to break up and shifts load
to the fibers. This is known as the matrix-driven region because of the prevalence of matrix
cracking which yields a large amount of AE events. Finally, once the matrix has completely
40
fiber-driven region begins. Finally, the sample is burst at its ultimate tensile stress (UTS).
Figure 3.1 displays a stress/strain and cumulative AE energy curve that depicts the
boundaries of these three regions.
Figure 3.1: Tube 3a Stress/Strain curve with AE as example of internally loaded
SiCf/SiCm composite. Dashed indicators added to show the three regions of failure
behavior.
The mechanics used to analyze these composite tubes were taken from the field of
thick-walled pressure vessels, due to the thickness ratio of these samples. As such, Lame’s
equation was used to calculate hoop stress inside the tubes and is shown in Equation 5.
This is a general equation to calculate hoop or tangential stress within an open-ended tube
with an applied external and/or internal pressure, though it assumes that the material is an
isotropic, homogeneous material. Assuming no applied external pressure and the outer
radius as the radius being measured, Equation 5 simplifies to Equation 6, where Pi is
41
𝜎
𝜃= 𝑃𝑜𝑟𝑜2−𝑃𝑖𝑟𝑖2𝑟𝑜2−𝑟𝑖2
+
(𝑃𝑜−𝑃𝑖)𝑟𝑖2𝑟𝑜2 𝑟𝑜2−𝑟𝑖2
1
𝑟2
(
Eqn 5)𝜎
𝜃= −2𝑃𝑖𝑟𝑖2𝑟𝑜2−𝑟𝑖2
(
Eqn 6)In the context of this study, a discussion of the Kaiser effect is in order. Originally
developed in in the context of rocks and mining [53], the Kaiser effect describes a behavior
of ceramic materials in which specimens that are loaded multiple times do not produce
additional AE events unless the maximum threshold of the last loading program is
surpassed. The Kaiser effect has been related to the behavior of composite materials [54,55]
and has been observed in SiCf/SiCm composite materials [56]. As such, iterative testing on
cuts made from an original composite specimen may not be compared to the original during
pre-PLS or matrix-driven regime and can only be best compared in terms of UTS.
However, the presence of the Kaiser effect up until the previous UTS of the last sample
would verify that the sample has been uniformly loaded.
Size effects are material dependent qualities that change based on the size of the
material in question. The size effect is due to the prevalence of defects within the material
[57]. The longer a specimen is, the more likely a serious defect will be present somewhere
along the length, presenting a statistical likelihood of lower ultimate strength in larger
samples. Unnthorsson et al. [23] describe the three stages of life of composite structures as
production of structural fibers, assembly of the full composite structure, and service life
after manufacturing. What is exceptional about this life cycle compared with most isotropic
materials is that service life represents the last stage of life, meaning that defects have
![Figure 1.1: Fukushima Daiichi reactors 1-4 (right to left) following the March 11 Tsunami [3]](https://thumb-us.123doks.com/thumbv2/123dok_us/8343922.1381840/19.612.131.516.170.425/figure-fukushima-daiichi-reactors-right-following-march-tsunami.webp)
![Figure 1.2: LWR Heat/Time after Shutdown [2]](https://thumb-us.123doks.com/thumbv2/123dok_us/8343922.1381840/21.612.174.470.227.466/figure-lwr-heat-time-after-shutdown.webp)
![Figure 1.3: SiCf/SiCm composite turbine blade [17]](https://thumb-us.123doks.com/thumbv2/123dok_us/8343922.1381840/23.612.185.444.269.640/figure-sicf-sicm-composite-turbine-blade.webp)
![Figure 1.4: General Atomics SiCf/SiCm composite cladding winding process and material [18]](https://thumb-us.123doks.com/thumbv2/123dok_us/8343922.1381840/24.612.137.513.72.285/figure-general-atomics-composite-cladding-winding-process-material.webp)
![Figure 2.2: IE System Diagram [36]](https://thumb-us.123doks.com/thumbv2/123dok_us/8343922.1381840/33.612.208.441.70.304/figure-ie-system-diagram.webp)