Energy-Efficient Communication in Large Scale Antenna Systems:
Impact of Variable User Capacity and Number
of Transmission Antennas
Joseph Isabona* and Viranjay M. Srivastava
Abstract—Energy-efficient transmission is fast becoming a critical factor in designing future mobile broadband cellular communication systems. This research work examines the constraints with regard to the achievable throughput and energy efficiency that can be attained on the use of precoding-based massive MIMO systems, bearing in mind the effect of some key performance impacting parameters. We first introduced an absolute energy efficiency-based model to evaluate the deep-down relationship among the packet length, the Bit error rate (BER) and throughput. Then, by means of simulation with cyclic coordinated search algorithm, optimal achievable throughput and energy efficiency performance have been shown and demonstrated for variable capacity of users and number of transmission antennas. This work is expected to be of enormous importance to practical system design on the use of massive MIMO antenna technology for data throughput and energy efficiency maximization in future 5G systems.
1. INTRODUCTION
The past few decades have been marked by a rapidly growing mobile cellular communication industry, globally. Presently, according to reports, the number of mobile telephony and wireless network service subscriptions are estimated to be more than four billion people worldwide. This in turn has led to the deployment and proliferation of Base Stations (BSs) transceivers everywhere, to serve mobile network subscribers. These BSs consume a lot of power due to large traffic volume of calls and data packets transmission in the cellular networks. According to a report in [1], it is predicted that by year 2020, telecommunication infrastructure and mobile networks alone would account for approximately 25% of CO2 gas emissions from the ICT sector. Evidently, high power consumption and operational energy efficiency cost problems in the mobile networks and their BS infrastructure are becoming major problems for the governments, telecom industries, and scientific research communities at large. This situation explains, in a way, why ideas like “green radio communications concept” have arisen in recent time, as clearly seen in [2–5]. The use of massive multiple input multiple output (Ma-MIMO) systems, virtual MIMO systems, white spaces and adaptive resource management techniques are some of the envisioned ways to significantly reduce energy consumption in mobile cellular networks in literature.
In [6], an iterative algorithm, which provides a means of determining the optimal packet size in wireless sensor networks (WSN), is presented, utilizing accurate link and lightweight estimation method. The authors in [7] adapt the packet size to enhance efficient code dissemination in WSN, using 1-hop link quality approach. Also, the authors in [8] and [9] present a packet size adaptation for performance enhancement of WSNs method, but exploiting source authentication and error estimation scheme for code dissemination, respectively. A transmit power optimization algorithm is proposed in [10], for
Received 23 May 2017, Accepted 14 July 2017, Scheduled 28 July 2017
* Corresponding author: Joseph Isabona ([email protected]).
206 Isabona and Srivastava
WSNs which utilizes space diversity. The authors aim to ascertain the smallest amount of power that is required to attain the desired BER target. This is to save energy and at the same time reduce interference in WSNs. By means of maximal ratio combining (MRC) with space diversity, the authors discover that the required transmit power can be reduced. Evidently, these previous works were all directed toward enhancing energy efficiency in low-power WSNs where energy or power consumption was of less concern than cellular networks with high percentage of energy consumption.
In [11], a fast link adaptation based method which uses both bit error rate (BER) and packet error rate (PER) quality of service constraints was investigated to enhance the throughput performance of MIMO-OFDM systems. In [12], the authors studied the impact of transmission power, channel width, modulation and coding scheme on the total energy consumption in 802.11n. However, these works were solely within the structure of WLANs.
In [13], radio resource management algorithm is proposed to conserve energy efficiency in heterogeneous networks. The algorithms provided means of determining optimal traffic allocation for 2G/3G networks considering low or high traffic scenarios. Heterogeneous networks settings are also presented in [14], wherein the authors presented a different power consumption model which takes account the back haul power for energy efficiency analysis of different cellular base stations scenarios. The authors in [15] presented a power consumption model to study and compare SISO and MIMO systems for different wireless access networks, as a function of their range,power consumption, and energy efficiency, using suburban area setting. The authors also presented some substantial analysis to ascertain the best technology among WiMAX, HSPA and LTE, in terms power consumption compared to wired access networks. In our previous work [16], the influence of nonlinear and linear precoding schemes on the achievable data throughput and energy efficiency was investigated and quantified in a single-cell downlink M-MIMO systems.
This work proposes a methodology to typify the limitations regarding the achievable throughput and energy efficiency in Ma-MIMO systems, as a function of (a) the number of users, (b) the number transmission antennas, (c) different bit error rates, and (d) different packet lengths. To do so, an absolute energy efficiency-based model has been introduced and studied through simulation using the cyclic coordinated search algorithm. This has enabled us to determine the optimal achievable throughput and energy efficiency can be achieved for variable capacity of users and number of transmission antennas.
2. METHODOLOGY
2.1. System Model
Notation: We employ bold letters to indicate matrices (vectors). The superscripts H represent conjugate-transpose; the mathematical operators,tr(.) andE[.], denote trace and statistical expectation of a matrix, respectively.
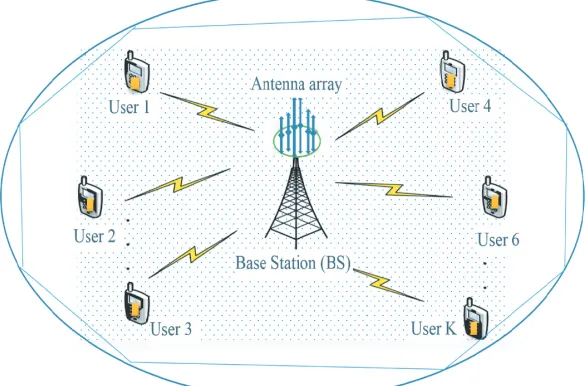
As illustrated in Figure 1, we consider a Ma-MIMO transmission system model which has a single-cell Base Station (BS) to serve K-user equipment (EU) terminals via a flat fading channel. Let
H∈CNt x Nr designate Hermitian channel matrix, with Nt and Nr being the BS transmission antennas and EU reception antennas, respectively. The received complex signal vector at the EU can be defined by:
y= HHx+n (1)
where, y ∈ CN r×,1, x ∈ CN t×1 denotes the transmitted signal vector, and n ∼ CN(0, σ2I) is the Gaussian noise vector, with CN(0, σ2) and I representing complex Gaussian noise and the identity matrix, respectively.
The transmitted signal vectorx, can be defined as:
x= K
k
gksk=Gs (2)
with symbol vectors∼CN(0,Ik) and precoding matrixG= [g1, . . . , gk]∈CN t×k. Now, assuming that the BS transmitter is power constrained,PT X >0, then the constraint:
Figure 1. Downlink M-MIMO system model.
Also, E[(nnH)] = σ2I, with σ2 being the noise variance. Thus, the mean equivalent signal-to-noise (SNR) available at the receiver can be written as SNR= PσT X2 =ρ.
Now, let yk and sk denote the kth elements ofNr×1 vectorsy and s, respectively. Accordingly,
yk of user kcan be written as:
yk= √pkhkgksk+√pj k
j=1,j=k
hjgjxj +n (4)
K
k=1
pk=PT X
where√pkhkgksk and √pj k
j=1,j=k
hjgjxj are the desired signal and interference signal, respectively.
The signal-to-interference-plus-noise ratio (SINR) of userkcan be expressed as:
SINRk = pk|hkgk| 2
1 +pk K
j=1,j=k
|hkgj|2
(5)
One key technique to cancel or reduce inter-users interference and maximize desired signal of user k over the communication channel is by means of precoding. In this work, we employ the Zero forcing (ZF) precoding; it is expressed as [17]:
GZF = 1
β
HHH−1HH (6)
whereβ =
tr(BBH)
PT X and B =H
H(HHH)−1.
Thus, with ZF precoding, SINR of userkin Equation (5) can be rewritten as:
SINRk=
1
β2 hkHHgk
2
1 +β12
K
j=1,j=k
|hkHHgj|2
208 Isabona and Srivastava
Now, from the general Shannon theorem, the throughput capacity via the Gaussian noise communication channel is defined by:
Tc = log2(1 +SNR) (8)
Accordingly, the achievable throughput ofKth user can be modeled as:
Tk = K
k=1E[log2(1 +SINRk)]
Tk = K k=1E
⎡ ⎢ ⎢ ⎣log2
⎛ ⎜ ⎜ ⎝1 +
1
β2 hkH
Hg
k
2
1 + 1
β2
K
j=1,j=khkH
Hg
j
2 ⎞ ⎟ ⎟ ⎠ ⎤ ⎥ ⎥
⎦ (9)
2.2. Power Model
There are several power consumption models in literature for appraising energy efficiency of cellular BSs. A key and most detailed one among them is that which was developed for ‘Energy Aware Radio and Network Technologies’, and it is commonly referred to as the EARTH project model [15, 18] and expressed in Equation (10) by:
PBS =NT RX P
T X/ηP A(1−σf eed) +PRF +PBB
(1−σDC) (1−σM S) (1−σcool)
(10)
where σM S, σDC, σM S, σcool, and σf eed represent the losses incurred by main supply, DC-DC power supply, cooling and the feeder, respectively. PT X, PBB and PRF denote the antenna transmission power, baseband power and the radio frequency power, respectively. NT RX andηP A denote the number of transceiver and power efficiency of the amplifier, respectively.
It was further shown in some previous works (e.g., State-Of-The-Art (SotA) [17], Market 2014 [19], Improved DTX [20] and Future Model [21]) that the BS power consumption or supply can be approximated by linear function of the transmission power. In this work, we concentrate on the Future Model, and it is summarised in Equation (11) by:
Psupply=
P o+mPT X if 0< PT X ≤Pmax
Ps <if PT X = 0
(11)
wherem indicates load of trajectory, and it measures the load dependence of the BS transmitter. PT X andPmax denote the transmit power and the maximum transmit power of the BS.Ps accounts for when the BS is not transmitting or in stand-by mode.
2.3. Energy Efficiency Model
Based on [22, 23], we consider an Absolute Energy Efficiency (AEE) model:
AEE = 10 log10
Power/Bit Rate (KcTaln 2)
(12)
where Kc and Ta denote the Boltzmann constant in J/K and absolute temperature in kelvin, respectively. The smaller the value of AEE is, the better of the achieved energy efficiency is.
Achievable throughput is related to Bit Rate by:
Throughput = (1−BER)LBit Rate (13)
Equation (13) also implies that:
Bit Rate = (1−BER) L
Throughput (14)
Thus, with Equation (13), the AEE expression in Eq. (12) can be rewritten as:
AEE = 10 log10
Power(1−BER)L Throughput (KTln 2)
where BER is the bit error rate, and it can be linked to packet error rate (PER) by P ER = 1−(1−BER)L, such that 1−P ER = (1−BER)L = success probability. L is the packet length in bits.
By considering the achievable throughput of Equation (9) and the power consumption model of Equation (11) into Equation (15), respectively, the AEE can be reformulated as:
AEE = log10
(P o+mPT X)(1−BER)L
Tk(KcTaln 2)
(16)
Our next focus is to determine the maximal achievable throughput and minimized energy consumption that obtained by adapting the antenna transmission number for variable capacity of users, different packet lengths and the bit error rates. This is the same as minimizing the total energy consumption for every successfully transmitted data stream. Thus, our problem can be conveyed as:
Minimise:AEE(BER, Pk, Tk)
Subject to: (1−P ER) = (1−BER)L
Tk ≥Tmax
Pk ≥PT X,max
where Tk and T,max denote the achievable throughput and maximum achievable sum throughput, and
PT X,max is the maximum transmit power of the BS.
Notice that the optimisation problem above is related to convex optimisation problem in [24], which can be solved iteratively by using our optimal coordinated search algorithm as described in 1.
Algorithm 1: Optimal Coordinated Search Algorithm
1) Inputs: T,P o,m,PT X,max,T c,Ka,L,Nt;
2) choose Tk≥Tk,target, set AEEe= 0;
3) While AEEe≥0 do
4) Iterationsi≥1,i∈k={1, . . . , K} ; 5) Calcualte Pk(i+1)=Pk(∗)(Tk(i));
6) Calcualte Tk(i+1)=Tk(∗)Pk(i);
7) Calculate AEE =AEE (Tk, P∗) using Equation (13); 8) end while
9) Outputs: AEE∗
3. RESULTS AND DISCUSSION
This section presents the simulation results related to achievable throughput and energy efficiency as a function of number of users, number transmission antennas, bit error rates, and packet lengths. All our simulation results are average over 1000 interactions and the values of the simulation parameters trails of the frameworks in [25–28]. A lower AEE implies a more energy efficient system. In Figures 2 and 3, the plots of throughput and AEE versus SNR are displayed at different antenna numbers, Nt. It is obvious from the plotted figures that better throughput and AEE can be achieved if the transmission SNRs are boosted. The plotted figures also reveal that the better system performance can be attained in terms of data transmission quality and energy efficiency if the base stations transceivers are equipped with more transmission antennas.
210 Isabona and Srivastava
0 10 20 30 40
0 50 100 150 200 SNR (dB) Throughput (Mbits/s) Nt =10 Nt =50 Nt =100
Figure 2. Achieved throughput versus SNR at different antenna transmission number.
0 10 20 30 40
198 200 202 204 206 208 210 212 214 SNR (dB) A b s o lute E n er g y E ffi c ien c y (AEE
) Nt =10
Nt =50 Nt =100
Figure 3. Achieved AEE versus SNR at different antenna transmission number.
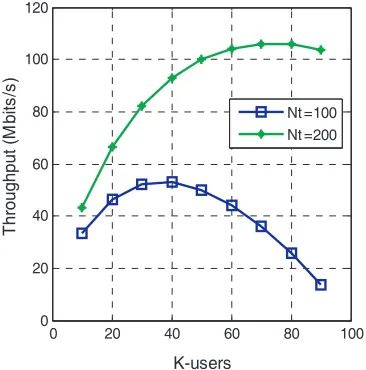
0 20 40 60 80 100 0 20 40 60 80 100 120 K-users T h roughput (M bits /s ) Nt =100 Nt =200
Figure 4. Optimal throughput as a function of varied k-users forNt= 100 and 200.
0 20 40 60 80 100 206 208 210 212 214 216 218 K-users A b s o lu te E n e rgy E ffi c ien c y ( A E E
) Nt =100 Nt =200
Figure 5. Optimal AEE as a function of varied
k-users for Nt= 100 and 200.
raised from 100 to 200, the optimal throughput and AEE improves by about 30% and 35%, respectively. Again, this shows that better optimal performance achievement can be attained if more antennas are deployed at the base station transceiver. Nevertheless, there should be a harmonization between the number of users that the system network can accommodate and the base station antenna resources.
Figures 6 and 7 also display plots of AEE performance versus increasing number of users, but at different bit error rates. Figure 6 shows that at 0.003 BER channel quality, the optimal AEE attains 207, but at 0.002 and 0.001 BER values, the optimal AEE improves to 203 and 197, respectively. In another effort, Figure 7 shows AEE performance for different BER values using probability function plot. From this figure, it is clear that AEE performance degrades with increasing BER, thus confirming that environmental channel condition greatly impacts data transmission throughput and energy efficiency negatively. This is because an increase in bit error during poor channel condition stimulates increase in packet losses and consequently, leading to high consumption of energy. Thus, a tradeoff exists between BER channel quality and transmitting energy.
0 20 40 60 80 100 200 205 210 215 220 225 230 K-users A b s o lu te E n ergy E ff ic ienc y ( A E E
) Nt =100, BER=0.003
Nt =100, BER=0.002 Nt =100, BER=0.001
Figure 6. Optimal AEE as a function of varied
k-users for BER= 0.003, 0.002 and 0.001.
200 202 204 206 208 210 212 214 216
0.05 0.1 0.25 0.5 0.75 0.9 0.95
Absolute Energy Efficiency (AEE)
P robab ilit y BER=0.003 BER=0.002 BER=0.001
Figure 7. Probability plot of optimal AEE as a function of variedk-users forBER= 0.003, 0.002 and 0.001.
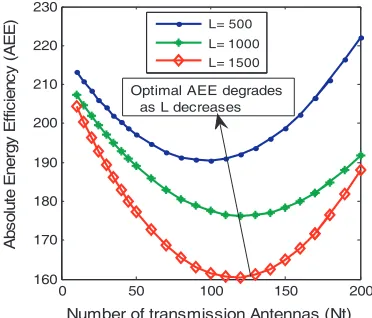
0 50 100 150 200
160 170 180 190 200 210 220 230
Number of transmission Antennas (Nt)
Ab s o lu te Ener g y Ef fi c ie n c y ( AEE) L= 500 L= 1000 L= 1500
Optimal AEE degrades as L decreases
Figure 8. Optimal AEE versus varied antenna transmission number for L= 500, 1000 and 1500.
160 170 180 190 200 210 220
0 0.2 0.4 0.6 0.8 1
Absolute Energy Efficiency (AEE)
Cumulative probability L=500 L=1000 L=1500 Optimal AEE degrades as L decreases
Figure 9. CDF plot of optimal AEE versus
varied antenna transmission number for L= 500, 1000 and 1500.
lengths. For L = 500, the optimal AEE achieves 190. But, for higher packet lengths of L = 1000 and 1500, the optimal AEE values improve to 178 and 160 respectively. This performance is a clear indication that larger packet lengths are more energy efficient than lower ones. This can be ascribed to lesser payload data overheads with longer packet lengths.
4. CONCLUSION
Energy efficiency is increasingly becoming an essential indicator for evaluating the performance of wireless broadband communication systems, owing to high power consumption at the mobile user equipment (UE) terminals and their supporting backbone base station transceivers.
212 Isabona and Srivastava
REFERENCES
1. SMART 2020, “Enabling the low carbon economy in the information age,” 2010, Available at: www.smart2020.org/ assets/files/02 Smart2020Report.pdf.
2. Han, C., T. J. Harrold, S. M. D. Armour, I. Krikidis, S. Videv, P. Grant, H. Haas, J. Thompson, I. Ku, C.-X. Wang, T. Le, M. Nakhai, J. Zhang, and L. Hanzo, “Green radio: Radio techniques to enable energy-efficient wireless networks,”IEEE Communication Magazine, Vol. 49, No. 6, 46–54, June 2011.
3. Han, T. and N. Ansari, “On optimizing green energy utilization for cellular networks with hybrid energy supplies,” IEEE Transactions on Wireless Communications, Vol. 12, No. 8, 3872–3882, 2013.
4. “Community power using mobile to extend the grid,” Available online at: http://www.gsmworld.com/documents/gpfm communitypower11whitepaperlores.pdf.
5. 3gpp r3-100162, “Overview to LTE energy saving solutions to cell switch off/on,” 3GPP RAN3 Meeting, Valencia, Spain, Jan. 2010.
6. Dong, W., C. Chen, X. Liu, Y. He, Y. Liu, J. Bu, and X. Xu, “Dynamic packet length control in wireless sensor networks,” IEEE Transaction on Wireless Communication, Vol. 13, 1172–1181, 2014.
7. Wei, D., L. Yunhao, Z. Zhiwei, L. Xue, C. Chun, and B. Jiajun, “Link quality aware code dissemination in wireless sensor networks,” IEEE Transaction on Parallel Distribution Systems, Vol. 25, 1776–1786, 2014.
8. Kim, D., D. Kim, and S. An, “Source authentication for code dissemination supporting dynamic packet size in wireless sensor networks, sensors,” Sensors, Vol. 16, No. 7, 1–22, 2016,
9. Wei, D., Y. Jie, and Z. Pingxin, “Exploiting error estimating codes for packet length adaptation in low-power wireless networks,” IEEE Transaction Mobile in Computing, Vol. 14, 1601–1614, 2015. 10. Nandi, A. and S. Kundu, “Optimal transmit power in wireless sensor networks using MRC space
diversity in rayleigh fading channel,”Proc. International Conference on Industrial and Information Systems (ICIIS), 19–24, 2010.
11. Martorell, G., F. Riera-Palou, and G. Femenias, “Cross-layer fast link adaptation for MIMO-OFDM based WLANs,” Wireless Personal Communication, Vol. 56, 599–609, 2011.
12. Halperin, D., B. Greenstein, A. Sheth, and D. Wetherall, “Demystifying 802.11n power consumption,” Proceeding of the 2010 International Conference on Power Aware Computing and Systems, HotPower’10, 1–5, Berkeley, CA, USA, 2010.
13. Saker, L., S. E. Elayoubi, and H. O. Scheck, “System selection and sleep mode for energy saving in cooperative 2G/3G networks,”Vehicular Technology Conference Fall, 1–5, Sep. 2009.
14. Tombaz, S., P. Monti, K. Wang, A. Vastberg, M. Forzati, and J. Zander, “Impact of backhauling power consumption on the deployment of heterogeneous mobile networks,” IEEE Global Telecommunications Conference (GLOBECOM), 1–5, 2011.
15. Behjati, M., M. H. Alsharif, R. Nordin, and M. Ismail, “Energy efficient and high capacity tradeoff in distributed antenna system for a green cellular networks,” Journal of Computer Networks and Communications, Vol. 2015, 1–9, 2015.
16. Isabona, J. and V. M. Srivastava, “Downlink massive MIMO systems: Achievable sum rates and energy efficiency perspective for future 5G systems,”Wireless Personal Communication, Vol. 2017, 1–18, May 2017.
17. Buzzi, S., I. Chih-Lin, T. E. Klein, H. Vincent Poor, C. Yang, and A. Zappone, “A survey of energy-efficient techniques for 5G networks and challenges ahead,”IEEE Journal on Selected Areas in Communications, Vol. 34, No. 4, 697–709, Apr. 2016.
18. Auer, G., O. Blume, V. Giannini, et al., “D2.3: Energy efficiency analysis of the reference systems, areas of improvements and target breakdown,” EARTH, 2010.
20. Frenger, P., P. Moberg, J. Malmodin, Y. Jading, and I. Godor, “Reducing energy consumption in LTE with Cell DTX,” Vehicular TechnologyConference Proceedings, 2011. VTC 2011-Spring Budapest. 2011 IEEE73rd, 1–5, 2011.
21. Holtkamp, H., G. Auer, and H. Haas, “On minimizing base station power consumption,” 2011 IEEE Vehicular Technology Conference (VTC Fall), 2011.
22. Parker, M. C. and S. D. Walker, “Differential temperature Carnot heat analysis shows that computing machines are thermodynamically irreversible,”Optical Communication, Vol. 281, 3440– 3446, 2008.
23. Parker, M. C. and S. D. Walker, “Road mapping ICT: An absolute energy efficiency metric, optical communication networks,” Vol. 3, No. 8, 2011.
24. Heliot, F., M. A. Imran, and R. Tafazolli, “Energy-efficiency based resource allocation for the orthogonal multiuser channel,”Proc. IEEE Vehicular Technology Conference (VTC Fall), Quebec City, Canada, Sep. 2012.
25. Zhang, X., S. Zhou, Z. Niu, and X. Lin, “An energy-efficient user scheduling scheme for multiuser MIMO systems with RF chain sleeping,” IEEE WCNC, 169–174, 2013.
26. Hoydis, J., S. Ten Brink, and M. Debbah, “Comparison of linear precoding schemes for downlink massive MIMO,”Proc. of the 2012 IEEE International Conference on Communications (ICC 2012), Ottawa, Canada, Jun. 2012.
27. Xu, J. and L. Qiu, “Energy efficient optimization for MIMO broadcast channels,” IEEE Transactions on Wireless Communications, Vol. 12, No. 2, 690–701, Feb. 2013.