BOARD CHARACTERISTICS AND FINANCIAL PERFORMANCE OF MANUFACTURINGFIRMS LISTED AT THE NAIROBI SECURITIES
EXCHANGE IN KENYA
BY
FRIDAH KANARIO MEME D58/CTY/PT/25598/2013
A RESEARCH THESIS SUBMITTED TO THE SCHOOL OF BUSINESS IN PARTIAL FULFILLMENT OF THE REQUIREMENTS FOR THE AWARD
OF DEGREE OF MASTER OF SCIENCE (FINANCE)OF KENYATTA UNIVERSITY.
DEDICATION
ACKNOWLEDGEMENT
TABLE OF CONTENTS
DECLARATION ... ii
DEDICATION ... iii
ACKNOWLEDGEMENT ... iv
TABLE OF CONTENTS ... v
LIST OF TABLES ... viii
LIST OF FIGURES ... ix
OPERATIONAL DEFINITION OF TERMS ... x
ABBREVIATION AND ACRONYMS ... xii
ABSTRACT ... xiii
CHAPTER ONE: INTRODUCTION ... 1
1.1Background of the Study ... 1
1.1.1 Financial Performance in the Manufacturing Sector ... 3
1.1.2 Corporate Governance and Financial Performance ... 5
1.2 Statement of the Problem ... 7
1.3 Objectives of the Study ... 9
1.3.1 Hypotheses of the Study ... 9
1.4 Significance of the Study ... 10
1.5 Scope of the Study ... 11
1.6 Organization of the Study ... 11
CHAPTER TWO: LITERATURE REVIEW ... 13
2.1 Introduction ... 13
2.2 Theoretical Literature ... 13
2.2.1 Agency Theory ... 13
2.2.2 Stakeholder Theory ... 15
2.2.3 Resource Dependence Theory ... 16
2.3 Empirical Literature ... 17
2.3.1 Corporate Governance and Financial Performance ... 17
2.3.2 Board Size ... 19
2.3.3 Board Diversity ... 20
2.3.5 Moderating Effect of Firm Attributes ... 25
2.4 Summary of Literature Reviewed and Research Gaps ... 26
2.5 Conceptual Framework ... 29
CHAPTER THREE: RESEARCH METHODOLOGY ... 31
3.1 Introduction ... 31
3.2 Research Philosophy ... 31
3.3 Research Design ... 31
3.4 Model Specification ... 32
3.5 Target Population ... 34
3.6 Sampling Design and Sample Size Determination ... 35
3.7 Data Collection Instruments ... 35
3.8 Data Collection Procedure ... 36
3.9 Operationalization and Measurement of Variables ... 36
3.10 Diagnostic Tests ... 37
3.10.1 Testing for Normality ... 38
3.10.2 Testing for Heteroskedasticity ... 38
3.10.3 Testing for autocorrelation ... 39
3.10.4 Testing for Multicollinearity ... 39
3.11 Data Analysis and Presentation ... 40
3.12 Ethical Consideration ... 41
CHAPTER FOUR: RESEARCH FINDINGS AND DISCUSSION ... 42
4.1 Introduction ... 42
4.2 Descriptive Statistics ... 42
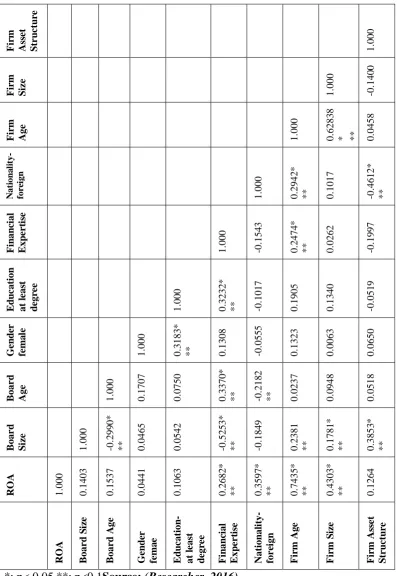
4.3 Correlation Analysis ... 47
4.4 Regression Analysis Results ... 54
4.4.1 Testing for Homoscedasticity ... 55
4.4.2 Testing for Multicollinearity ... 55
4.4.3 Testing for Normality ... 56
4.5 Regression Models Estimation ... 57
4.6 Regression Analysis Results for Moderation Effect ... 59
4.6.2 Testing for Multicollinearity ... 61
4.6.3 Testing for Normality ... 61
4.7 Estimation of Moderation Effect Regression Models ... 62
4.8 Testing Research Hypotheses... 64
CHAPTER FIVE: SUMMARY, CONCLUSIONS AND RECOMMENDATIONS ... 75
5.1 Introduction ... 75
5.2 Summary ... 75
5.3 Conclusion ... 77
5.4 Contribution to Knowledge ... 78
5.5 Recommendations for Practice ... 79
5.6 Limitations and Recommendations for Further Research ... 80
REFERENCES ... 81
APPENDIX 1: SECONDARY DATA COLLECTION TEMPLATE... 91
LIST OF TABLES
Table 2. 1: Summary of Literature Reviewed and Research Gaps ... 28
Table 3. 1: Target Population ... 34
Table 3.2: Operationalization and Measurement of Variables ... 37
Table 4.1: Descriptive Statstics for Board Characteristics ... 43
Table 4.2: Descriptive Statistics for Financial Performance ... 45
Table 4.3: Summary of Descriptive Statistics for Firm Attributes ... 46
Table 4.4: Correlations of the Variables: Tobin’s Q as Dependent Variable ... 48
Table 4.5: Correlations of the Variables: ROE as Dependent Variable ... 50
Table 4.6: Correlations of the Variables: ROA as Dependent Variable... 52
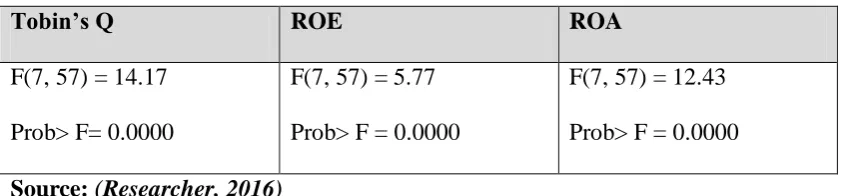
Table 4.7: Test of Fitness of the OLS Regression Models ... 54
Table 4.8: Breusch - Pagan Test for Heteroskedasticity ... 55
Table 4.9: Variance Inflation Factor Test for Multicollinearity ... 56
Table 4.10: Shapiro - Wilk Test for Normality ... 56
Table 4.11: Durbin-Watson Test for Autocorrelation ... 57
Table 4.12: Estimation of OLS Regression Models ... 58
Table 4.13: Breusch - Pagan Test for Heteroskedasticity ... 60
Table 4.14: Variance Inflation Factor Test for Multicollinearity ... 61
Table 4.15: Shapiro - Wilk Test for Normality ... 61
Table 4.16: Durbin-Watson Test for Autocorrelation ... 62
Table 4.17: Estimation of OLS Regression Models with Moderation ... 63
Table 4.18: Board Size and Financial Performance ... 64
Table 4.19: Board Diversity and Financial Performance ... 66
Table 4.20: Board Independence and Financial Performance ... 70
LIST OF FIGURES
OPERATIONAL DEFINITION OF TERMS
Board of directors: Is a body of elected or appointed member who jointly oversee the activities of a corporation.
Board Member: A director of a governing board that has overall responsibility for the management of a corporation andadvices management on issues facing the corporation.
Board Characteristics: Features in the Board such as board size, board independence and board diversity which actually determine the effectiveness of the board members in achieving the corporation’s goal of profit
maximization.
Corporate Governance: The process and structure of managing business affairs of an institution to achieve financial prosperity, accountability and improveshareholders’ long-term value. This involves a set of relationships between a company’s management, its board, its shareholders
and its stakeholders.
Executive director: An inside member of the board who is also an executive with the corporation.
Firm Attributes: The characteristics inherent in a firm that falls outside the direct control of a firm and they includeorganizational size, age and structure.
Governance: The manner in which power is exercised in the management of economic and social resources for
sustainable human development.
Inside Director: A member of the board who is also an employee, officer, major shareholder, or someone similarly connected to the corporation.
Independence: The degree to which board members are not biased or elsecontrolled by company management or other groups who exert control over management.
Manufacturing Firms: Establishments engagedin mechanical, physical or chemicaltransformation of raw materials, substances or components into new products.
Non-executive director: A member of the board who is not involved in the company’s administrative or managerial operations.
Outside Director: A member of the board who is not otherwise employed by or engaged with the corporation, and does
ABBREVIATION AND ACRONYMS AfDB: African Development Bank
CBK: Central Bank of Kenya CEO: Chief Executive Officer CFA: Chartered Financial Analysts CMA: Capital Market Authority
CMSC: Capital Market Steering Committee GDP: Gross Domestic Product
KAM: KenyaAssociation of Manufacturers
KIPPRA: KenyaInstitute for Public Policy Research andAnalysis KIRDI: Kenya Industrial Research and Development Institute KNBS: Kenya National Bureau of Statistics
MAPI:Manufacturers Alliance for Productivity and Innovation MDG’S: Millennium Development Goals
MGI: McKinsey Global Institute MVA: Manufacturing Value Added NSE: Nairobi Securities Exchange PM: Profit Margin
ROA: Return on Asset ROE: Return on Equity
UNIDO: United Nations Industrial Organisation USA: United States of America
ABSTRACT
CHAPTER ONE INTRODUCTION 1.1Background of the Study
Manufacturing sector is one of the key pillars to economic development. The sector remains a critical force in both advanced and developing economies. Globally, the manufacturing output as measured by gross value added continues to grow by about 2.7 percent annually in advanced economies and 7.4 percent in large developing economies. The sector contributes from 10 percent to 33 percent of value added (United Nations Industrial Development Organisation [UNIDO], 2013). Economies such as China, India and Indonesia have risen into the top ranks of global manufacturing and in the world’s fifteen largest manufacturing economies
(Mckinsey Global Institute [MGI], 2012). In fact, China is the largest manufacturing economy in the world, with a 22 percent share of manufacturing activity. The USA is in second place with a 17.4 percent share of manufacturing activity(Manufacturers Alliance for Productivity and Innovation [MAPI], 2014).
In Africa, the manufacturing sector is widely considered to be the ideal industry to drive Africa’s development. The Africa Progress Panel (2014) also identifies some degree of manufacturing development as a prerequisite for sustained high economic growth on the continent. The continent produces only 1.5 percent of the world’s manufacturing output (World Bank, 2012). Also, manufacturing only accounts for around 25% of exports in Sub-Saharan Africa, lower than any other region except the Mediterranean Africa (World Economic Forums [WEF], 2013a).
manufacturing value added (MVA) per capital still is lower than the African average. The sector also contributes a relatively small share of GDP ranging from 3.8 percent to 11 percent, in the region (African Development Bank [AfDB], 2014).
The manufacturing sector in Kenya is relatively strong when compared to countries that are in a similar phase of economic development. The country is one of the top exporters of manufactured goods in the Sub-Saharan Africa region(KPMG, 2014).This is as a result of the ambitious development targets set up by theKenyan government so as to enhance economic growth in the manufacturing sector.The Kenyan government first developed the vision 2030 on October 2007, which required a 10 percent increase in economic growth rate per annum from the manufacturing sector (Republic of Kenya, 2007). Then the government formed the Second Medium-Term framework, which was concerned with making Kenya a newly industrialized middle-income country by the year 2030 (Kenya Industrial Research and Development Institute [KIRDI], 2011). Later on, the Kenyan government came up with the Millennium Development Goals (MDGs) that sought to enhance the transformation of Kenya into a rapidly industrializing, middle income nation by the year 2030 (Purhonen&Mburu, 2010).
Despite the efforts of the Kenyan government to set up policies that seek to improve the manufacturing sector, the sector which is the backbone of vision 2030 has stagnated (World Bank, 2014). Further, the sector’s contribution to GDP declined
with the CMA guidelines on board composition (Capital Market Steering Committee [CMSC], 2014).
1.1.1 Financial Performance in the Manufacturing Sector
Manufacturing sector remains a significant contributor to financial performance of both advanced and developing economies. Manufacturing represents 16 percent of global GDP and manufacturing value added grew from 5.7 trillion dollars to 7.5 trillion dollars between 2000 and 2010 (MGI, 2012).Generally, manufacturing accounts for only 13 percent of GDP in Africa. This is a smaller share compared to other regions except the Middle East and North Africa (World Bank, 2012). However, the continent has also experienced a significant increase in manufactured exports and import-substituting production over the past decade and is poised to continue this strong performance (KPMG, 2014).
Manufacturing in Eastern Africa is limited. The contribution of manufacturing to GDP and employment is small in the region. The sector contributes a relatively small share of GDP ranging from 3.8 percent to 11 percent (AfDB, 2014).In Eastern Africa, Kenya is relatively strong when compared to other countries. The Kenyan manufacturing value added per capita in constant 2005 US dollars, was 61.8 US dollars in 2012, up 2.6 percent in real terms from 2005 (United Nations Industrial Development Organisation [UNIDO], 2013). This is merely a fraction of South Africa’s 2012 level of 910.9 dollars, but is much higher than that of regional peers Tanzania, Uganda and Rwanda which have 41.4, 30.5 and 25.1 US dollars respectively (UNIDO, 2013).
small and trends are not promising. It contributed just 11 percent of Kenya’s GDP in
2013 and employed only 280,000 people which are equivalent to12 percent of the 2.3 million people in Kenya’s labor force (KNBS, 2013b). Besides, the sectors’ contribution to wage employment is on a declining trend. The total wage employment gradually worsened from 13.9 percent in 2008 to 12.9 percent in 2012 (World Bank, 2014).
According to the World Development Indicators (2013), the production of Kenya’s manufacturing exports has been slowly declining. Kenya’s manufacturing exports
represented about 0.02 percent of global manufacturing exports in 2013, down from 0.06 percent in 1994 and 0.18 percent in 1980s. In 2013, South Africa which is the regional champion in manufacturing exports produced 0.03 percent of global manufacturing exports, fifteen times more than Kenya. On the other hand, the share of manufactured goods imported by the East African Community from Kenya declined from 9 percent to 7 percent in 2013 (World Bank, 2014).
Nevertheless, there is still a lot of room for expansion in Kenya’s manufacturing
1.1.2 Corporate Governance and Financial Performance
Well structured corporate governance is the key to success of a company. Corporate governance is important because the quality of corporate boards impacts the efficiency with which a corporation employs assets and is able to attract low-cost capital thus improving its overall financial performance (Holly & Marsha, 1999). Effective corporate governance promotes the efficient use of resources both within the firm and the large economy. When corporate governance systems are effective, debt and equity capital should flow to those corporations capable of investing it in the most efficient manner for the production of goods and services most in demand and with the highest rate of return. In this regard, effective governance helps protect and grow scarce resources which in turn increase financial performance of a corporation(Holly & Marsha, 1999).
For corporations to succeed in competitive markets, firm’s management should be separate and distinct from the providers of the firm’s capital.Therefore, the firm
should have a strong board which acts as a bridge between the managers and the shareholders (Cadbury Commission, 1992).Ensuring that corporations do so, promotes effective corporate governance which assists firms in attracting lower-cost investment capital by improving both domestic and international investor confidence that assets will be used as agreed, whether that investment is in the form of debt or equity (Mckinsey, 1996).Also, strong corporate governance is important to a firm’s successful economic performance as well as its ability to attract long-term, stable, low-cost investment capital (Holly & Marsha, 1999).
affects both its economic performance and its ability to access patient, low-cost capital (Holly & Marsha, 1999). After all, the board of directors is the corporate organ designed to hold managers accountable to capital providers for the use of firm assets (Holly & Marsha, 1999).The concept of corporate governance of very large firms has been a priority on the policy agenda in developed market economies for over a decade. The concept is gradually warming itself as a priority in the African continent. Indeed, it is believed that the poor performance of the corporate sector in Africa has made the issue of corporate governance a catchphrase in the development debate (Berglof& Von, 1999).
There are several events that are responsible for the heightened interest in corporate governance especially in both developed and developing countries (Ranti, 2011). In developed countries for instance, a string of collapses from high profile corporations such as Lehman Brothers, J.P Morgan, Morgan Stanely and others, fraudulent activities, several major corporate scandals and long lasting economic depression raised the questions on the suitability of the existing corporate governance practices of business firms in the economy (Mazudmer, 2013).
In developing countries such as Kenya, corporate governance framework has also continued to weaken (Mang’unyi, 2011). In fact, according to the World Economic
1.2 Statement of the Problem
The manufacturing sector in Kenya plays a significant role in the economic development. The sector is key to the achievement of the Kenya vision 2030. Over the years the manufacturing sector has declined. Manufacturing sector activity, as measured by the Federal Board’s industrial production index, grew by just 2.3
percent in 2013, down from 3.9 percent in 2012 (MAPI, 2014). In Kenya, Real growth in the manufacturing sector averaged 4.1 percent per annum during 2006 to 2013, lower than the average annual growth in overall real GDP of 4.6 percent (KNBS, 2013a). As a result, the manufacturing sector’s share in output,declined in recent years. The financial performance of manufacturing firms in Kenya over the past seven years depreciated, with manufacturing growth of 4.1 percent significantly lagging overall economic growth of 5.0 percent (World Bank, 2014).Thesector’s contribution to GDP declined from 9.9 percent in 2009 to 9.8 percent in 2010. Subsequently, the GDP worsened from 9.6 percent in 2011 to 9.2 percent in 2012, while the growth rate deteriorated from 4.5 percent in 2010 to 3.4 percent in 2011and thereafter to 3.2 percent in 2012 (KNBS, 2014).
Despite the Kenya’s vision 2030 industrial strategy to double the share of
decline in their prices leading to a decrease in the firms’ market capitalization (NSE,
2013). Further, according to financial performance analysis by NSE (2013), most firms such as East African Portland Cement, Eveready East Africa and Mumias Sugar show very strong negative percentages for their R.O.A and R.O.E. The weak financial performance is attributed tolow investments (Bigstenet al., 2010) caused byweak corporate governance practices in Kenya (CMSC, 2014).The weak corporate governance practice is as a result ofcompanies’ failure to comply with current rules on the issue of board composition requirements (CMSC, 2014).
1.3 Objectives of the Study
The general objective istoascertain the effect of board characteristicson financial performance of manufacturing firms listed atthe Nairobi Securities Exchange in Kenya.
The Specific objectives include;
1. To establishthe effect of board sizeon financial performance of manufacturing firms listed at the Nairobi Securities Exchange in Kenya. 2. To examine the effect of board diversity on financial performance of
manufacturing firms listed at the Nairobi Securities Exchange in Kenya. 3. To ascertain the effect ofboard independenceonfinancial performance of
manufacturing firms listed at the Nairobi Securities Exchange in Kenya. 4. To determine the moderating effect of firm attributes on the relationship
between board characteristics and financial performance of manufacturing firms listed at the Nairobi Securities Exchange in Kenya.
1.3.1 Hypotheses of the Study
HO1:Board size has no effect on financial performance of manufacturing firms listed
at the Nairobi Securities Exchange in Kenya.
HO2: Board diversity has no effect on financial performance of manufacturing firms
listed at the Nairobi Securities Exchange in Kenya.
HO3: Board independence has no effect on financial performance of manufacturing
firms listed at the Nairobi Securities Exchange in Kenya.
HO4:Firm attributes has no moderatingeffect on the relationship between board
1.4 Significance of the Study
The findings of this study could be useful in many fields. One potential beneficiary of the findings is the Capital MarketsAuthority of Kenya. The policy makers in the Kenyan government could use the findings of the study in developing additional corporate governance policies, guidelines and regulations to govern manufacturing firms. The economic policy changes made could play a vital role in underpinning the integrity and efficiency of financial markets through increasing investors’
confidence and thereby securing access to capital through the stock market. This could provide avenues for opening investment opportunities in the capital market for both local and foreign investors resulting to significant improvements in economic growth.
Another potential beneficiary of the findings is the manufacturing sector. The finding of the study couldpromote good corporate governance practices in manufacturing firms which couldin turn increasetheir access to external financingleading to larger investment, higher growth and greater employment creation. In addition, adoption of an effective corporate board could lead to better operational performance through better allocation of resources, hence creating more wealth. Promotion of good corporate governance in manufacturing firms could also lower the cost of capital and the associated higher firm valuation thus creating more investments attractive to investors which could lead to more growth and employment, therebypromoting economic stability and the achievement of the Kenyan vision 2030 industrial strategy to double the share of manufacturing output to 20 percent.
monitoring and control mechanism to management. They could gain insight on the various structures of governance relating to the corporate board of directors and hence make practical interpretation in relation to the nature of operations in their organizations.
Finally, the findings of this study are of possible beneficiary to the academicians. The academicians could use the study as a reference material and further apply the knowledge gained from the study for further research in developing appropriate theories and principles in the corporate governance aspect of board characteristic and financial performance.
1.5 Scope of the Study
The scope of the study was limited to only the manufacturing firms which are listed at the Nairobi Securities Exchange. The period concerned for the study was 2009 to 2013. This period was considered important because it was the period reflecting the declining trend in the financial performance of manufacturing firms in Kenya (World Bank, 2014).The financial performance aspect only covered one market based measure namely the Tobin’s Q and two accounting-based measures namely
the Return on Equity and Return on Asset.
1.6 Organization of the Study
The second chapter of the study isthe Literature Review.It presents the theoretical review which discusses the financetheories relating to corporate governance and financial performance. The chapter also contains the empirical review, the summary of literature review, the knowledge gap and the conceptual framework.
The third chapter of the study is the Methodology. It contains the introduction, the research philosophy, the research design, the target population, the sampling design and sample size determination. The chapter also presents the data collection instruments, the data collection procedure, the empirical model and the ethical considerations observed by the researcher.
The fourth chapter is the Empirical Results, Interpretation and Discussion. The chapter presents and explains both the descriptive statistics and inferential statistics for the findings of the study. It also analysesand presents the study findings on the basis of the research objectives and hypotheses. The chapter uses tables and figures to present quantitative data so as to enable effective and efficient interpretation of the research findings.
CHAPTER TWO LITERATURE REVIEW 2.1 Introduction
This chapter presents reviewed literature relating to corporate governance and financial performance. Also,presented are theoretical literature, empirical literature and the knowledge gap.
2.2 Theoretical Literature
The study wasguided by theories relating to corporate governance and financial performance including Agency Theory, Stakeholders Theory and Resource Dependency Theory. The main theory on which the study is anchored wasAgency Theory.
2.2.1 Agency Theory
governance studies,the composition of the board is considered an important element in resolving agency problems(Johnson, 2008; Aguilera et al., 2008).
Agency theory advocated for a clear separation between decision management and control (Fama& Jensen, 1983). Therefore, boards which have separated the positions of the Chair and CEO are considered independent as such an arrangement dilutes the power of the CEO and increases the board’s ability to effectively perform its
oversight role (Fama& Jensen, 1983; Boyd, 1995). However, mere separation may not be clear indication of independence of the board. Hermalin and Weisbach (1998) suggest that board independence depends on the CEO’s bargaining position, which
is effectively derived from their perceived ability. Some of the internal mechanisms recommended to address the presumed conflict of interest in agency theory, is the need for a greater representation of outside independent non-executive directors and larger board sizes (Hesterly& Coles, 2000; Bhagat& Black, 2002;Petrovic, 2008).
Large boards are viewed to negatively impact performance since theyare less effective and less easy for a CEO to control and they interfere with group dynamics and decisions (Jensen, 1983). Nonetheless agency theory advocated for larger boards as it viewed the presence of non-executive directors on the board as a crucial element in ensuring that the managers will act in the best interests of shareholders. The general expectation is that non-executive directors, being independent and having the expertise to carry out their function, will be able to monitor executive directors (Fama& Jensen, 1983). Larger boards also allow for effective monitoring by reducing the domination of the CEO within the board and protect shareholders’
non-executive directors as they can best represent the shareholder interests (Carter, Simkins& Simpson, 2003).
2.2.2 Stakeholder Theory
The stakeholder approach was originally proposed in the mid-1980 by Richard Edward Freeman. The theory recognized the fact that firms do not operate in isolation but within an environment made of different interest groups aside the immediate owners. It therefore, expanded the interested parties’ spectrum as it argued the need to take into consideration the interests of other constituents in corporate decision making since they are likely to affect or be affected by firms’
strategic choices (Freeman, 1984). Therefore, maintaining harmonious corporate relationship with each group is of high strategic importance to the firm and its ability to add value as well as the marketplace (Kreitner, 2002).
Firms through its administrators (board and management) have the sole responsibility of aligning diverse interest groups by effectively analysing the nature of their perceivedinterest disparities and the adoption of appropriate corporate strategies that help balance the act and improve financial performance (Freeman, 1984).The interests of these stakeholders according to Donaldson and Preston (1995) are intrinsically bond. Therefore, maintaining harmonious corporate relationship with each group is of high strategic importance to the firm and its ability to add value as well as the delivery of success in the marketplace (Kreitner, 2002). Under this theory, the purpose of firm shifts from pursuing shareholder value maximisation to that which encompasses other stakeholders’ expectations (Kirkbrideet al., 2004).
facilitate the alignment of the interest of each constituent especially those that create value to the firm (Evan & Freeman, 1993; Clarkson, 1995; John &Senbet, 1998; Zingales&Rajan, 1998).On the contrary, Donaldson and Muth, (1998) emphasize the
need for smaller board sizes. This is in line with
organisationalbehaviourists’argument that small teams promote group cohesiveness
and bonding that propel high performance.
2.2.3 Resource Dependence Theory
The Resource Dependence Theory developed in the 1970’s by Pfeffer and Salancik
(1978) emphasizes that resources required by organizations need to be acquired through a network of contacts and that efficiency in bridging network gaps will determine the quality of corporate performance. The theory provides a theoretical foundation for the role of the board of directors as a resource to the firm (Johnson et al., 1996; Hillman et al., 2000). The perspective of Resource Dependence Theory is that, outside directors bring a stream of resources such as information and skills to the firm (Hillman et al., 2000). Corporate boards are part of the resource stream since they bring bundles of knowledge, experience, ideas and professional contacts (Carpenter, Gelektkancyz& Sanders, 2004).
and cognitive elements such as the professional and educational qualifications (Erhardtet al., 2003;Kang et al., 2007).
In response to resource dependencies and regulatory pressures, organisations create large boards to encompass directors from different backgrounds (Pfeffer, 1972; Pearce & Zahra, 1992).Klein (1998) for instance suggests that advisory needs of the CEO increases with the extent to which the firm depends on the environment for resources. So, increasing board size links the organisation to its external environment and secures critical resources. The resource dependency perspective therefore, is that large boards are chosen to maximise the provision of important resources to the firm (Klein, 1998; Hillman &Dalziel, 2003).
2.3 Empirical Literature
This study reviewed empirical literature relating to the corporate governance aspect of board characteristics and financial performance. For this study, the variables on board characteristics were reviewed in relation to board size, board diversity and board independence.
2.3.1 Corporate Governanceand Financial Performance
moderating variable. Unlike Bathulah (2008) thisstudy employed a moderator variable which is unrelated to board characteristics variable.
On the contrary, studies have also produced conflicting results. For instance, a study by Raymond et al., (2010) was inconclusive as the researcher only found limited support that board composition significantly influenced financial performance. This was probably because the data used was based on cross-sectional data. However, this study used panel data so as to ensure more generalized results. Similarly, the study by Horvath and Spirollari (2012) in the US, certainly conflict most researches on corporate governance and financial performance. The study found board size, board independence and gender diversity to have no significant effect on financial performance. However, different from Horvath and Spirollari (2012) this study adopted both cross-sectional and time series data so as to avoid results based on relying solely on cross sectional data.
performance not only from use of Tobin’s Q measure, but also by use of two
accounting-based measures of financial performance namely R.O.A and R.O.E.
2.3.2Board Size
Board size refers to the number of directors in the board. It is an important factor to determine the effectiveness of the board. The code of corporate governance in Kenya requires Boards’ of public listed companies to have sufficient sizes. The
Boards should be of such a number that enables the requirements of the company’s business to be met (CMA, 2002).Also, the size of the Board should not be too large to undermine an interactive discussion during board meetings or too small such that the inclusion of wider expertise and skills to improve the effectiveness of the Boards is compromised (CMA, 2002).
Although many studies have examined the relationship between board size and firm performance, the findings are inconclusive.For instance, Raymondet al., (2010) asserts that board size is positively related to revenue growth but is negatively related to financial leverage. Also, a study in Kenya by Muigai (2012) found a negative relationship between board size and financial performance which supported the conclusion of Jensen (1983) that for a firm to be effective in monitoring, it should have a relatively small board. In relation to that, Mehranet al., (2011) argued that a large board reduced the value of a firm because of free rider problems. The same conclusion was drawn by Kaid and Mohammed (2012) based on their study carried out on listed companies in Kuwaiti Stock Exchange. The study concluded that board size had a negative relationship with performance measured by ROA.
positive relationship between board size and performance in firms listed at the NSE in Kenya. These results also supported the findings made by Mahrous (2014) regarding the association between board size and firm performance.The study byMahrous (2014) found board size to have a significant effect on a firm’s financial performance. However, different from previous studies, this study incorporated both the direct relationship and the moderation approach to validate results on the relationship between board size and financial performance. Therefore, the study conceptualized firm attributes as the moderating variable.
2.3.3Board Diversity
Board diversity is one of the mostsignificant elements of board characteristics in modern corporations. The code of corporate governance in Kenya provides that Boards’ of public listed companies should have a policy to ensure the achievement
of diversity in their composition (CMA, 2002). Further, the law requires that every Board should consider whether its size and diversity makes it effective. Diversity applies to academic qualifications, technical expertise, relevant industry knowledge, experience, nationality, age, race and gender (CMA, 2002). A diverse Board therefore, is capable of excercing objective and independent judgement (CMSC, 2014). The reason being, most individual board members often have the knowledge and experience that is required to advice management in the light of the particularities of the company, its business and the competitive environment (Chartered Financial Analyst Institute [CFA], 2005).
were used as performance measures, found a negative relationship between gender diversity and financial performance. Similarly, Mizraet al., (2012) yields the same results. The study examined the relationship between gender diversity and firm performance variables of ROA and EPS and found a negative relationship between women in top positions of the firm and financial performance. However, Horvath and Spirollari (2012) reports contradicting results. The study found gender diversity to have no significant effect on financial performance. On the other hand, a study in Kenya by Wetukha (2013)finds a negative relationship between gender diversity and ROE. The contradicting results are as a result of reliance on solely cross-sectional data. Unlike the previous studies, this study employed panel data for a time frame of five years so as to validate the results.
into account both the direct relationship approach and moderation approach for more generalized results.
Empirical research linking board diversity variable of directors’ educational qualifications to financialperformance is mixed and mostly uses cross-sectional data. For instance, a study by Bathulah (2008) finds a negative relationship between board members with PhD level of education and performance. This is inconsistent with the findings of Cheng et al., (2010).The study found that university degrees held by the board chairman are positively associated with EPS, ROA, cumulative returns, cumulative abnormal returns and market-to-book ratio. Raymond et al., (2010) reports contradicting results. The study shows a negative relationship between proportion of board members with education expertise and revenue growth. However, Darmadi (2011) shows that board members’ educational qualifications are significantly related to ROA and Tobin’s Q. This study however, looked at the proportion of board members with degree qualification, over an extended timeline, regressed against both the accounting and market based measures of financial performance.
studies, this study focused on the manufacturing sector and employedboth the market-based and accounting-based measures of financial performance to increase on the validity of the data, for more accurate results.
Past studies examining the relationship between diversity variable of directors’ nationality and performance mostly focus on developed countries and do not take into account the unobserved characteristics of the firm. For instance, Shukeri, Shin and Shaari (2012) in Malaysia found a positive relationship between ethnic diversity and ROE. Similarly, the study by Victor et al., (2014)in Europe yields the same results. The study found foreign directors to be positively related to financial performance. However, unlike previous studies, this study focused on a developing country and incorporated the unobserved effect of firm characteristics, whereby firm attributes was used as the moderating variable.
2.3.4 Independenceof the Board
The law requires that Boards’ of public listed companies should comprise of a balance of executive directors and non-executive directors of diverse skills or expertise in order to ensure that no individual or small group of individuals can dominate the Boards’ decision making processes (CMA, 2002). Also, Boards’ are
Previous studies examining the relationship between board independence and firm financial performance have been inconsistent. For instance, Armer, Ragab and Ragheb (2014) in a study of 50 companies reported that there was no significant relationship between board independence and financial performance. Though the importance of independent directors should not be put to doubt, the outcome of this study conflicts with the conventional wisdom which suggests that a Board’s principal task is to monitor management and only independent directors’ can be
effective monitors (Adams &Mehran, 2012). Therefore, the study by Armeret al., (2014)is largely skewed to the position of Agency Theory on the monitoring role of the board which roots for outside director representation.
2.3.5 Moderating Effect of Firm Attributes
There is evidence that firm attributes influence the firm’s choices of internal
governance mechanism especially with respect to financial performance measures (Karuna, 2009). Firm attributes refer to characteristics inherent in a firm that falls outside the direct control of a firm such as organizational size, age and structure.This study usedsize, age and asset structure of the firm, as indicators for the moderating variable of firm attributes.
Firm size has been measured as Natural logarithm of total assets (Shao, 2009). Other studies measure firm size by the number of employees (Raymond et al., 2010) and sales or market capitalization (Baptista, 2010). The resource dependency theory argues that as the size increases, more resources are available to the firm (Waithaka, 2013). Besides, Fama and Jensen (1983) demonstrated that firm size is an indicator of complexity and could make a greater degree of monitoring necessary.Therefore, this study usedfirm size as a one of the moderating variables of firm attributes, so as to determine how it influences the direct link between board characteristics and financial performance.
determine how it influences the direct link between board characteristics and financial performance.
One indicator of firm structure is the assets in a firm. Asset structure has been used in previous studies as a proxy for firm characteristics. For instance, the study by Wu and Li (2015) on board independence and the quality of board monitoring in Chinaused asset structure as a proxy for firm characteristics. According to Wu and Li (2015), the assets of a firm, may capture the difficulty in the directors’ monitoring of the CEO since the higher the proportion of assets in a firm, the more complicated is managing the firm. This study thus usedasset structure as a proxy for firm attributes so as to determine its moderating effect on the relationship between board characteristics and financial performance.
2.4 Summary of Literature Reviewed and Research Gaps
While most international (Raymond et al., 2010; Harvoth&Spirollari, 2012; Azaret al., 2014; Charas, 2014; Victor et al., 2014) and Kenyan (Muigai, 2012;Wetukha, 2013; Waithakaet al., 2013) empirical studies, have examined the direct relationship between board characteristics and financial performance very few studies (Bathulah, 2008; Kholeif, 2008) have considered the effect of moderating variables. Many scholars recently called for investigation of moderating effects in studies linking corporate governance to firm performance (Finkelstein & Mooney, 2003; Letendre, 2004; Carpenter et al., 2004; Pye& Pettigrew, 2005). Besides, Carpenter et al., (2004) concluded that researches done on corporate governance should not ignore the role of intervening variables for them to be acceptable or publishable.
consideration the unobserved firm characteristics variables. This study therefore, incorporated the moderating variable of firm attributes and determinedboth the direct approach and the moderation approach for the relationship between board characteristics and financial performance. This studyfurther employedboth the accounting-based and market-based measures of financial performance and used panel data for a time frame of five years so as to validate the results.
Table 2.1:Summary of Literature Reviewed and Research Gaps F oc u s of C u r re n t S tu d y U se s bot h a cc oun ti n g -ba se d a n d m a rk e t-ba se d m ea sure s of pe rf orm a nc e. H a s M od e ra ti on E ffe c t. F oc us e s on m a nuf a ct uri ng se c to r. M ode ra ti o n e ffe c t. U se of P a n e l D at a. H a s m ode ra ti on E ff e ct . E m p loys P a n e l D a ta and us e s bot h a cc ou nt ing and m a rk e t-ba se d m ea sure s. Foc us on m a nuf a ct uri ng se c to r, us e s p a ne l da ta a nd ha s a m od e ra ti on e ffe c t. Inc orpo ra te s m od e ra ti on e ffe c t of fi rm a tt ri but e s. E m p loys P a n e l D at a, he nc e a l ong it udi n a l st ud y. Boa rd inde p e nd e nc e al so indi c at e d a s spl it c ha ir & CE O r ol e. H a s m ode ra ti on E ff e ct. Inc orpo ra te s a m od e ra ti ng va ri a bl e . E m p loys P a ne l D a ta . H a s a M od e ra ti o n e ffe c t. E m p loys P a ne l D a ta . F oc us e s on de ve lopi ng c ount ry, K enya . R e se ar c h G ap U se of onl y ac c o unt ing -ba se d m e a sur e s of fi na n c ia l p e rfor m a n c e N o m o de ra ti on e ff e ct . Re sul ts a re l im it e d to the F ina n c ia l S e ct or . N o m o de ra ti on E ff e ct . Is a c ros s-se c ti on a l st udy . N o m o de ra ti on e ff e ct . U se d cros s-se ct ion a l d a ta Re lys on ac c o unt ing -ba se d m e a sur e s. F oc us e s on fi na n c ia l ins ti tut ions . Is a c ros s-se c ti on a l st udy . A ss um e s a di re c t re la ti ons hi p . Ba se d on c ros s-se c ti on a l da ta . Boa rd inde pe nd e n c e m ea sure d on ly a s non -e xe c ut ive d ire c tors . N o m o de ra ti on E ff e ct . A ss um pt io n of a di re c t e ffe c t. Is a c ros s-se c ti on a l st udy . N o m o de ra ti on e ff e ct . Is a c ros s-se c ti on a l st udy . F indi ngs m a y no t hol d in a d e ve lop ing c ou nt ry . F in d in gs Boa rd si z e pos it ive ly re la te d to re v e nue grow th a nd ne g a ti ve ly re la te d t o fi na n c ia l le ve ra g e . Boa rd e du c at io n and fi na nc ia l e x pe rt is e ne ga ti v e ly r e la te d to re v e nu e g row th . S igni fi ca nt re la ti ons h ip be tw ee n Boa rd D yna m ic s a n d F ina n c ia l P e rfo rm a nc e . Boa rd Co m pos it ion a nd B oa rd S iz e a re ne ga ti v e ly r e la te d to RO A . Boa rd Inde p e nd e nc e and Bo a rd S iz e a re pos it ive ly re la te d t o fi n a n c ia l pe rf orm a n c e. G e nde r di ve rs it y is n e ga ti v e ly re la te d to RO E a nd RO A . Boa rd S iz e a nd Boa rd Ind e pe n de n c e a re pos it ive ly re la te d t o pe rfor m a n c e. Boa rd si ze a nd n on -e xe c ut ive di re ct ors a re pos it ive ly re la te d t o RO A a nd RO E . F irm s iz e pos it ive ly re la te d t o RO A a n d RO E . F irm a g e ne g a ti ve ly re la te d t o RO A a nd RO E . P os it iv e re la ti ons hi p b e tw ee n propor ti on o f ind e p e nd e nt d ire c tors a n d p e rfor m a nc e ( RO E ) Boa rd ind e pe nde n ce h a s no si gni fi ca n t re la tions hi p w ith T ob in’s Q . Inde p e nd e nt d ire c tors a re n e ga ti v e ly re la te d to pe rfor m anc e (T ob in’s Q ). S igni fi ca nt re la ti ons h ip b e tw ee n b oa rd c ha ra ct e ri st ic s a nd c o m p a ny pe rform a n c e. Boa rd ind epe nde nc e and fore ign di re ct ors ’ proport ion , p os it ive ly re la te d t o p e rfor m anc e . Th e mat ic A re a Infl u e nc e of c orpor a te bo a rds on fi rm fi na n c ia l p e rfor m a n c e i n the n e w e ra of S a rba n e s-O xl e y (S O X ). Re la ti ons hi p b e tw ee n S e le ct ed Corpora te Bo a rd D yn am ic s a n d F ina n c ia l P e rfor m a nc e of th e Com m e rc ia l Ba nks i n K e ny a . T he re la ti ons hi p b e tw e e n B oa rd Com pos it ion a nd F ina nc ia l P e rform a n c e of L is te d F irm s at th e N a irob i S e c ur it ie s E x c h a nge . T he E ffe c t of Bo a rd Ch a ra c te ri st ic s on P e rfor m a nc e of th e M ic rof ina n ce Ins ti tut ions i n K e ny a . T he e ff e c t of Bo a rd Ch a ra c te ri st ic s on the F ina n c ia l P erfor m a n c e o f fi rm s in the E gy pt ia n S toc k E xc h a ng e . Boa rd C ha ra ct e ri st ic s a nd F ir m P e rform a n c e: E vi de n c e fro m E gyp t. Boa rd C ha ra ct e ri st ic s a nd F ir m P e rform a n c e in M al ays ia . Boa rd Ch a ra c te ri st ic s be st pra c ti ce s a nd F in a nc ia l P e rfo rm a nc e in E urop e . A u th or Ra ym ond et a l .,
(2010) Mui
ga i, (201 2) W et ukh a , (201 3) W ai th a ka e t a l. ,
(2014) Ma
hrous
,
(2014) Arm
e r e t al .,
(2014) Az
a
r
et
al
.,
(2014) Vic
2.5 Conceptual Framework
This study used the conceptual framework in figure 2.1 to demonstrate an understanding of which variable in the study influenced which. The conceptual framework comprised of independent variables, dependent variables and moderating variables.
Independent Variables Dependent Variable Board Characteristics
HO1
HO2
HO4
HO3
Moderating Variable
Figure 2.1:A conceptual framework on effect of Board Characteristics on the
Financial Performance of listed manufacturing firms in Kenya.
Source: (Author, 2016)
Board Size
- Number of directors
Firm Attributes - Size
- Age
- Asset Structure
Financial Performance
Tobin’s Q
R.O.E
R.O.A Board Diversity
-Age - Gender
- Educational Qualification - Professional Expertise - Nationality
Board Independence - Non-Executive Directors
The Figure 2.1was the conceptual framework for this study. The conceptual framework showed both a direct and indirect relationship between board characteristics and financial performance. The direct relationship represented the direct link between board characteristics and financial performance. Board Characteristics was the independent variable which comprised three variables namely; board size, board diversity and board independence. The conceptual framework implied that the number of directors in a board, their age, gender, educational level, professional expertise and nationalityhave an effect on the financial performance of a firm. The framework also showed that board independence is portrayed by the presence of non-executive directors on the Board and the separation of roles of the CEO and the Chairperson. According to the framework, these features of board independence affect the financial performance of a firm.
CHAPTER THREE RESEARCH METHODOLOGY 3.1 Introduction
This chapter describes the general approach of the study. It describes the research tools employed and the methods used in the data collection process. The chapter focuses on the research design, population target, sample size, data collection method, empirical model, data analysis and ethical considerations employed by the study.
3.2 Research Philosophy
The study used the PositivismResearch Philosophy.This philosophy is based upon values of reason, truth and validity and there is a focus purely on facts, gathered through direct observation and experience andmeasured empirically using quantitative methods, surveys, experiments and statistical analysis (Hatch &Cunliffe, 2006). The positivism research paradigm is most suitable for a study like this one since the research is a quantitative study and thus involves testing of the hypothesis developed from the existing theories relating to board characteristics and financial performance (Flowers, 2009).
3.3 Research Design
of listed manufacturing firms and thereafter describe their performance with respect to board characteristics variables of size, diversity and independence.
3.4 Model Specification
For the purpose of testing the relationship between board characteristics and financial performance, the study designed a general Panel Data Regression Model similar to the one used by Thaoet al., (2014) so as to combine time series for several cross-sections. The regression equation 3.1 enabled the study analyse repeated observations on fixed units (Pennings, Keman&Kleinnijenhuis, 1999).
Consequently, the regression model aided the study combine cross-sectional data on the 13 listed manufacturing firms in Kenya (N) and the five year time period from 2009 to 2013 (T) so as to produce a dataset of N*T observations. This means that, instead of testing a cross-section model for the 13 listed manufacturing firms at one point in time or testing a time series model for one firm using time series data, the Panel Data Regression Model is tested for all firms through time (Penningset al., 1999). From the general regression model 3.1, the study designed three Panel Data Regressions for Tobin’s Q, ROEand ROA Models.
the regression model 3.1 the regression model 3.2 aidedthis study in combining both cross-section data and time series data.
General Model: Yit =β0 +βiXit+εt...3.1 Tobin’s Qit =β0 +β1X1it+β2X2 it+β3X3 it+β4X4 it+β5X5 it+β6X6 it+β7d1it+εt...3.2
ROE it =β0 +β1X1it+β2X2 it+β3X3 it+β4X4 it+β5X5 it+β6X6 it+β7d1it+εt...3.3 ROA it =β0 +β1X1it+β2X2 it+β3X3 it+β4X4 it+β5X5 it+β6X6 it+β7d1it+εt...3.4 Yit=β0+β1X1it+β2X2it+β3X3it+β4X4it+β5X5it+β6X6it+β7d1it+β8Z1Z2Z3it+εt...3.5
Where:-
Y – Financial Performance measured by Tobin’s Q, ROE and ROA at time period t.
X1 – Board Size measured by number of board members at time period t. X2 – Age measured by average age of board members at time period t.
X3 – Gender diversity measured by proportion of female directors in the Board at time period t.
X4 – Educational qualification measured by proportion of directors with at least degree at time period t.
X5 – Professional expertise measured by proportion of directors with expertise in finance at time period t.
X6 – Nationality measured by proportion of foreign directors’ in the Board at time period t.
d1– Board independence is a dummy coded as 1 if a firms’ Board at the time period t comprises of at least half non-executive directors and the position of the CEO and chairperson are separate, if otherwise, it is coded as 0.
Z2 – Size of the firm at time period t.
Z3 – Asset Structure of the firm at time period t.
Z1Z2Z3it– Composite index for moderator variable firm attributes, given as the product term of firm age (Z1), firm size (Z2) and asset structure (Z3) at time t. β0 and βi – Are the parameters or vectors of parameters.
εt – Is the error term.
t – Is the time period.
3.5 Target Population
Target population is the specific population about which information is desired (McDaniel, 2001). The target population for the study was the 13 manufacturing firms listed at the NSE in Kenya during the years 2009 to 2013. The study used the listed manufacturing firms since information on their company boards’ and financial performance is readily available as the listed firms are governed by the Capital Markets’ Authority code of corporate governance hence requiring them to publish
their annual reports and financial statements.
Table 3.1: Target Population
No. Listed Manufacturing Firms in Kenya during 2009 to 2013
1 B.O.C Kenya Ltd
2 BAT Ltd
3 Carbacid Investments Ltd 4 East African Breweries Ltd 5 Mumias Sugar Ltd
6 Unga Group Ltd
7 Bamburi Cement
8 Athi River Mining Ltd
9 KenGenLd
10 Crown Paints Kenya Ltd 11 East African Cables Ltd 12 East African Portland Cement 13 Eveready East Africa
The table 3.1 shows the thirteen listed manufacturing firms in Kenya used as the target population for the study. The period concerned for the target population was 2009 to 2013. This period was considered important because it was the period reflecting the declining trend in the financial performance of manufacturing firms in Kenya (World Bank, 2014).
3.6 Sampling Designand Sample Size Determination
Sampling is the procedure a researcher uses to gather people, places or things to Study (Kombo& Tromp, 2006). Thus, a sample design is a definite plan for obtaining a sample for a given population (Mugenda&Mugenda, 2003). The study adopted the Survey Sampling Technique. The survey measured the entire target population of the thirteen firms and a census was carried out so as to systematically acquire and record information regarding secondary data on company boards for each of the listed firms from 2009 to 2013.
3.7 Data Collection Instruments
3.8 Data Collection Procedure
A research authorization permit was first obtained from the Ministry of Education, Science and technology prior commencing the data collection process. The researcher also regestered online with the NSE, CMA and the Kenyan Investors websiteso as to download annual reports and financial statements from year 2009-2013, for each of the thirteen listed manufacturing firms in Kenya. Theresearcher obtained data relating to board characteristics from the firms’ published annual reports retrieved from the firms’ websites, NSE, CMA and Kenyan Investors websites’.The annual financial reports downloaded contained directors’ biographical information relating to age, gender, education, expertise and nationality.
Thereafter, the researchersourced secondary data on financial performanceand firm attributes from the listed manufacturing firms’ financial statements available online. The study used the NSE website to source data on share prices and market capitallization for each firm from year 2009 to 2013. The study also used the NSE Handbook (2013) and the annual reports downloads from the firms’ website, CMA website and Kenyan Investors website to obtain data on various measures of financial performance and firm attributes. Each data collected was recorded in the secondary data collection sheet and template. The data was colleceted in a period of two months.
3.9 Operationalization and Measurement of Variables
This section identifies and provides the operationalized independent, dependent and moderator variables in the study. These variables are operationalized based on how they have beenused in this study. The study variables’ operationalized are provided bytable 3.2.
3.10 Diagnostic Tests
Diagnostic tests assist in verifying the nature of the data and aids in specifying the model applicable for the study in order to ensure that the regression results are unbiased, consistent and efficient (Yihua, 2010). This study carried out relevant diagnostic tests before embarking on model estimation. The diagnostic tests were Variable
Type
Variable Name
Indicator Operationalization
Dependent Variable
Financial Performance
Return on Equity
Profit After Tax *100 Shareholder’s Equity Return on
Asset
Profit After Tax *100 Total Assets
Tobin’s Q Market Capitalization Total Assets
Independent Variable
Board Size Number of board members.
Total Number of Board Members at firm i in year t.
Board Diversity
Age Average age of board members at firm i, in year t (%)
Gender Proportion of female board members at firm i, in year t (%)
Educational Qualification
Proportion of board members with degree and above at firm i, in year t (%)
Professional Expertise
Proportion of board members with expertise in finance at firm i, in year t (%) Nationality Proportion of foreign directors in the
board at firm i, in year t (%)
Board
Independence
Non-Executive Directors
Split Chair and CEO role
If at least half are non-executive directors and positions of CEO and Chairperson at firm i, in year t, are separated = 1
Otherwise = 0
Moderating
Variable Firm Attributes
Age Number of years between observation year and year of listing
Size Total Sales Total Assets Asset
Structure
designed to check the assumptions relating to the ordinary least squares (OLS) panel regression model. The diagnostic tests relevant for this study were tests concerned with testing for violation of panel error assumptions relating to normality, heteroskedasticity, autocorrelation and multicollinearity.
3.10.1Testing for Normality
An assumption of the OLS regression model that impacts the validity of all tests is that residuals behave normal(Oscar, 2007). Thisstudy usedthe Shapiro Wilk test, a non-graphical test for normality, so as to determine whether residuals behaved normally. The Shapiro Wilk test was used to test the null hypothesis that the distribution of the residuals was normal (Oscar, 2007). If the p-value was found greater than 0.05 (p>0.05), the study would fail to reject the null (at 95%) and thereafter conclude that the residuals were normally distributed.
3.10.2 Testing for Heteroskedasticity
Heteroskedasticity refers to regression disturbances whose variances are not constant across observations (Greene, 2008). Heteroskedasticity arises in numerous applications, in both cross-section and time-series data thus causing the estimation results to be inefficient (Baltagi, 2005). This study chose the Breusch- Pagan test to test for heteroskedasticity.The null hypothesis is that residuals are homoskedastic. Therefore, if the F statistic strongly rejects the null at least at 90% or 95% level of significance, this implies presence of heteroskedasticity.
study chose the heteroskedasticity-robust standard errors, so as to deal with the problem of heteroskedasticity if found present.
3.10.3Testing for autocorrelation
Time-series data often displays autocorrelation or serial correlation of the disturbances across periods(Green, 2008). Serial correlation is problematic to linear panel datamodels because its presence renders the standard errors biased as well as making theestimated regression coefficients consistent but inefficient (Drukker, 2003; Baltagi, 2005).Therefore,to detect the presence of autocorrelation, the study opted for the Durbin-Watson Test. The Durbin-Watson statistic is a test of First Order Autocorrelation between the error and its immediate previous value (Brookes, 2008). The test aids todetermine whether the errors in different observations are correlated with each other (Brookes, 2008). The null hypothesis in Durbin-Watson test is that there is no serial correlation (Durbin &Watson, 1971). If the d-statistic is more than 0.05, the study fails to reject the null (at both 95% and 90% significance level) and conclude that the errors in different observations are not correlated with each other(Durbin &Watson, 1971).
3.10.4Testing for Multicollinearity
shows how much the variance of the coefficient estimate is being inflated by multicollinearity (Belsley, Edwin & Roy, 1980). Therefore, a Variance Inflation Factor more than 10 (vif> 10) would indicate trouble with multicollinearity (Oscar, 2007).
3.11 Data Analysis and Presentation
Firstly, the data from the data collection instruments were compiled and edited in Excelspreadsheet using an acceptable format to enable data analysis by STATA 12. The data was then transferred from Excel to Stata econometric software for analysis. This study used Stata for data analysis because the software has ability to analyse panel data in a range of time and since the study used panel data for a five year period, the software was most appropriate for the study (Cameron &Triredi, 2009).
The researcher then analysed the descriptive statistics for each of the study variables so as to get their mean, standard deviation, minimum and maximum values. Afterwards, the researcher run the Pearson’s correlation analysis in Stata, so as to get the pairwise correlation matrix which helped determine the direction and strength of the relationship between the study variables. The researcherthereafter, run the OLS regression models with Tobin’s Q, ROE and ROA as the dependent
variables, for both the direct effect and the moderation effect, so as to test the fitness of the models by use of the F-statistics.The results for the F-statistics were used to gauge whether the OLS models were fit for analysis.
found presentin the OLSregression models for the direct effect, was dealt with by use of the Robust Standard ErrorsTechnique. The OLS regression models for both the direct effect and moderation effect where then estimated and their results presented in tables for efficient interpretation.
Finally, the researcherused the results obtained from the estimated OLS regression models to test the research hypothesis of the study.The researcher tested hypothesis for both the direct and moderated OLS regression models so as to determine the strength of the relationship between the study variables. Afterward the study gave a comprehensive summary of the estimated regression results in tables for easy interpretation of the findings.
3.12 Ethical Consideration
The researcher undertook cautious measuresto ensure that the study adhered to ethical research standards. Prior the data collection process, the researcher obtained a research authorization permit from the Ministry of Education,Science and Technology. The researcher then regestered online with the CMA, NSE and Kenyan Investor websites through creating an online member regestration account that allowed access to relevant data via downloads of the firms’ information on board
CHAPTER FOUR
RESEARCH FINDINGS AND DISCUSSION 4.1 Introduction
This chapter presents the empirical results, interpretation and discussions. The study results are presented on the basis of descriptive, correlation and regression based on the objectives and study hypotheses.
4.2 Descriptive Statistics
This section provides the summary of descriptive statistics of the study variables. Descriptive statistics are a collection of measurements which determine the location and variability of the variables used in a study(Torres, 2009).Thestudy results were on the basis of mean, standard deviation, maximum and minimum of the values obtained from analysis of the study data. The mean was used to show the central value of the study variable while the standard deviation provided the variability or spread of the study data from the centre value. The maximum and minimum were used to give the highest and lowest values respectively.