Western University Western University
Scholarship@Western
Scholarship@Western
Electronic Thesis and Dissertation Repository
5-24-2016 12:00 AM
Factors controlling the abundance, distribution, and composition
Factors controlling the abundance, distribution, and composition
of macroplastic and microplastic particles in tributary, beach, and
of macroplastic and microplastic particles in tributary, beach, and
benthic sediments of Lake Erie, Ontario
benthic sediments of Lake Erie, Ontario
Bethany DeanThe University of Western Ontario
Supervisor
Dr. Patricia Corcoran
The University of Western Ontario Graduate Program in Geology
A thesis submitted in partial fulfillment of the requirements for the degree in Master of Science © Bethany Dean 2016
Follow this and additional works at: https://ir.lib.uwo.ca/etd
Recommended Citation Recommended Citation
Dean, Bethany, "Factors controlling the abundance, distribution, and composition of macroplastic and microplastic particles in tributary, beach, and benthic sediments of Lake Erie, Ontario" (2016). Electronic Thesis and Dissertation Repository. 3828.
https://ir.lib.uwo.ca/etd/3828
This Dissertation/Thesis is brought to you for free and open access by Scholarship@Western. It has been accepted for inclusion in Electronic Thesis and Dissertation Repository by an authorized administrator of
ii
ABSTRACT
Plastics pollution in the Laurentian Great Lakes is becoming a significant environmental
concern with the threats of species entanglement, adsorption of toxins such as
endocrine-disrupting chemicals (EDCs) and persistent organic molecules (POPs), and subsequent ingestion.
Lake Erie tributary (by Petite Ponar), beach (by Split Spoon sampler), and benthic sediments (by
Shipek grabs) were collected and evaluated for microplastic particles (<0.5 mm), and Lake Erie
beaches and tributary banks were scavenged for macroplastics (>0.5 mm) (by quadrats and
transects). These results were mapped using ArcGIS software to show distribution and
abundance in regards to quaternary watershed population density and plastics industrial plants,
manufacturers, and distributors. Tributaries in urban areas were more abundant in microplastics
than in more rural tributaries. At beaches, backshores were more abundant in microplastics than
in the foreshore, likely due to natural beach dynamics of sediment accumulation. The greatest
abundance of microplastics was found in the Western Basin of Lake Erie, where the Detroit
River drains into the lake. Quaternary watersheds bordering Lake Erie with higher population
densities were most abundant in microplastics and macroplastics pollution. Macroplastics were
most abundant at beaches in highly populated areas, and macroplastics were least abundant at
beaches that were part of conservation areas. A random selection of microplastic fragments and
microbeads was analysed using Nicolet Almega Dispersive Raman Spectroscopy and NXR
FT-Raman Spectroscopy to determine types of plastics. Polyethylene was the most common
microplastic observed among this sample selection. Overall, high population density around the
sampling locations correlated to a higher abundance in plastic debris. Conservation areas had the
lowest abundance of plastic debris; therefore, employing conservation area environmental
iii
Keywords: Plastics pollution, Plastic pellets, Microplastics, Microbeads, Lake Erie,
iv
ACKNOWLEDGEMENTS
Many people have contributed to collaborating with me and supporting me throughout
this project. I would like to thank my supervisor (Patricia Corcoran) who guided me and
supported me throughout all the stages of completing this thesis. I would like to thank Odile
Madden at the Smithsonian Institute for training me on laboratory equipment and analyses
involving Raman spectroscopy. I would like to thank my colleague, Anika Ballent, for devoting
her time to assisting me in the field and collaborate on project ideas. I would like to thank
Roberta Flemming for her continual support. Last, but not least, I would like to thank my family
v
TABLE OF CONTENTS
ABSTRACT ... II
ACKNOWLEDGEMENTS ... IV
LIST OF APPENDICES ... VIII
LIST OF FIGURES ... IX
LIST OF TABLES ... XIV
CHAPTER 1: INTRODUCTION ... 1
1.1 Ecological threats of plastics pollution ... 3
1.1.1 Species at risk of ingesting microplastic particles in Lake Erie ... 5
1.1.2 Species at risk of entanglement in Lake Erie ... 6
1.2 Microplastics in aquatic environments ... 7
1.3 Impacts of plastics burial in the environment ... 9
CHAPTER 2: REGIONAL SETTING AND METHODOLOGY ... 11
2.1 Regional setting of Lake Erie ... 11
2.2 Lake Erie sampling locations ... 14
2.2.1 Lake Erie beach locations and sampling methods ... 14
2.2.2 Lake Erie tributary locations and sampling methods ... 19
2.2.3 Lake Erie benthic sample locations and sampling methods ... 21
2.3 Separation and analysis of microplastics and sediments... 22
2.4 Micro-Raman analysis of microplastics ... 24
2.4.1 Theory of Raman spectroscopy ... 24
vi
2.4.3 Fourier-transform Raman spectroscopy ... 25
2.4.4 Dispersive Raman spectroscopy ... 32
2.5 Mapping using ArcGIS... 33
CHAPTER 3: RESULTS ... 34
3.1 Microplastics in Lake Erie sediments ... 34
3.1.1 Microplastic in beach sediments ... 34
3.1.2 Microplastic in tributary sediment... 41
3.1.3 Microplastic in benthic sediment ... 45
3.1.4 Regional microplastic abundance... 50
3.1.5. Types of microplastics identified by Raman Spectroscopy ... 51
3.2 Plastic at Lake Erie beaches and tributaries by quadrats and transects ... 59
3.2.1 Daily accumulation of plastics by beach quadrat ... 59
3.2.2 Daily accumulation of plastic along beach transect... 69
3.2.3 Accumulation of macroplastic and microplastics by tributary quadrat ... 76
3.2.4 Types of macroplastics and microplastics recovered ... 78
CHAPTER 4: DISCUSSION ... 80
4.1 Plastics in Lake Erie environments ... 80
4.1.1 Beach plastics ... 80
4.1.2 Tributary plastics ... 81
4.1.3 Nearshore (benthic) plastics ... 82
4.1.4 Overall sampling ... 84
vii
CHAPTER 5: CONCLUSIONS ... 87
5.1 Microplastic abundance and distribution ... 87
5.2 Macroplastic abundance and distribution ... 88
5.3 Raman Analysis ... 88
5.4 Future Work ... 89
REFERENCES ... 90
viii
LIST OF APPENDICES
Appendix A: Dispersive Raman spectra……….…. (ATTACHED)
ix
LIST OF FIGURES
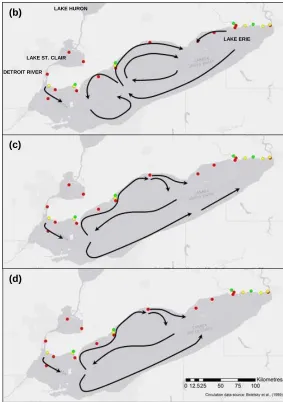
Figure 2.1. Location maps, tributary sampling locations (green circles), beach sampling locations
(yellow circles), near shore sampling locations (red circles), and seasonal circulation
patterns (black arrows) of Lake Erie. (A) Location of Lake Erie in North America, box
indicates study area. Surface water current patterns in Lake Erie from (B) May–October and
(C) November–April, and (D) average annual surface water current patterns; circulation
patterns from Beletsky et al. (1999). 13
Figure 2.2. Sedimentation rates of Lake Erie, Ontario as determined by Kemp et al. (1977). 14
Figure 2.3. Populations of quaternary watersheds associated with Lake Erie, Ontario. 15
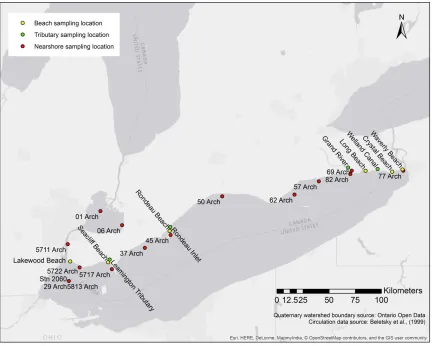
Figure 2.4. Lake Erie sampling locations and sample identification codes. Note that 29 Arch,
5813 Arch, and Stn 2060 share the same location. 16
Figure 2.5. Photos illustrating the nature of the beaches sampled. A) Crystal Beach, field of view
at bottom of photo (FOV) is ~2.5 m; B) Long Beach, FOV ~2.5 m; C) Waverly Beach, FOV
~2.5 m; D) Lakewood Beach, FOV ~2.5 m; E) Rondeau Beach, field of view is ~ 4.0 m at
recycling bin; F) Seacliff Beach, FOV ~2.0 m. 17
Figure 2.6. (A) Two-by-two meter sampling quadrat at Lakewood Beach and (B) 50 m sampling
transect at Crystal Beach. 19
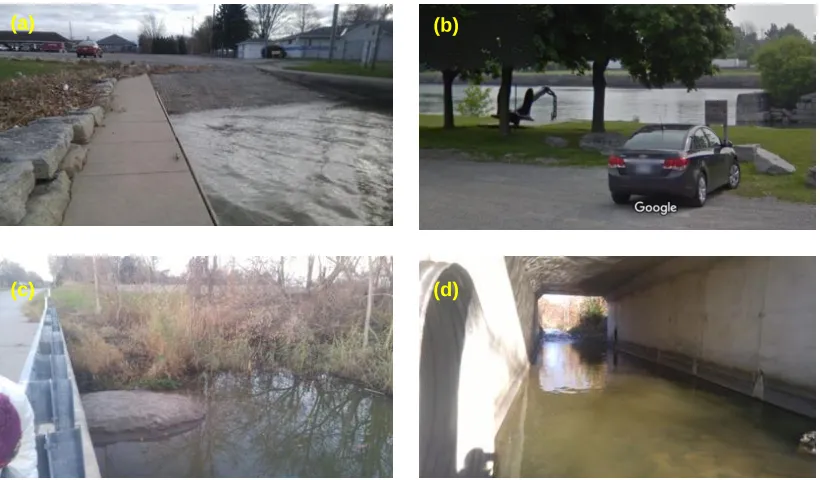
Figure 2.7. Tributary sampling locations. A) Grand River tributary with boat launch, FOV ~2.5
m; B) Welland Canal, field of view is ~4.0 m (Google Maps, 2016); C) Rondeau Inlet, field
of view at sand mound is ~6.0 m; D) Leamington Tributary (Sturgeon Creek), FOV ~2.5 m.
21
x
Figure 2.9. Relevant reference Raman spectra of polymers: (A) polyethylene (Raman spectra
from Lewis (2001)), (B) polypropylene (Raman spectra from Michielsen (2001)), (C)
polystyrene (Raman spectrum from McCreery Research Group (2014)), (D) poly vinyl
chloride (Raman spectrum from Nørbygaard & Berg (2004)), (E) cotton (Raman spectrum
from McCreery Research Group (2014)), (F) cellulose textile (Raman spectra from Cho
(2007)), and (G) poly methyl methacrylate (Raman spectrum from Emmons et al. (2006)).
27
Figure 2.10. NXR FT-Raman Spectrometer at the Museum Conservation Institute - Smithsonian
Institute, Suitland MD. 32
Figure 3.1.Microplastic particles recovered from Lake Erie beach sediments by (A) average
microplastic particles by location, and (B) microplastic particles relative to foreshore and
backshore beach environments. ... 36
Figure 3.2. Types of microplastics recovered in Lake Erie (A) backshore beach sediments and
(B) foreshore beach sediments. ... 38
Figure 3.3. Examples of types of microplastic particles recovered at Lake Erie beaches. (A)
fibres from sample CB Bb, and (B) fragments from sample CB Ba. ... 40
Figure 3.4. (A) Number of microplastic particles recovered from Lake Erie tributary sediments,
and (B) types of microplastic particles recovered from Lake Erie tributary sediments. ... 42
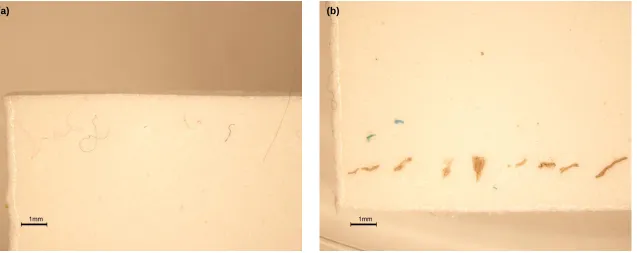
Figure 3.5. Examples of microplastic particles recovered from Lake Erie tributaries. (A)
microplastic fragments and a microbead in sample WC PP1, and (B) fibres from sample
xi
Figure 3.6. Microplastics recovered from Lake Erie tributary sediments relative to (A) water
flow, (B) tributary depth, and (C) depth of tributary in relation to water flow (where red =
high flow, yellow = moderate flow, cyan = low flow, and blue = stagnant). ... 44
Figure 3.7. Abundances of microplastic particles in Lake Erie benthic sediment samples. Stn
2060 was collected passively and the remaining samples were collected by Shipek grab. .. 46
Figure 3.8.Types of microplastics recovered from benthic samples of Lake Erie. ... 48
Figure 3.9. Examples of microplastic particles recovered from Lake Erie tributaries. (A)
microplastic fibres from sample 5711 Arch, and (B) microplastic fragments from sample 82
Arch... 49
Figure 3.10. Microplastics recovered from different sediment depths in Lake Erie and St. Clair.
... 50
Figure 3.11. Population of Lake Erie, Ontario watersheds and associated microplastic pieces
recovered. ... 51
Figure 3.12. Types of microplastics recovered from the Lake Erie watershed using Raman
Spectroscopy. ... 52
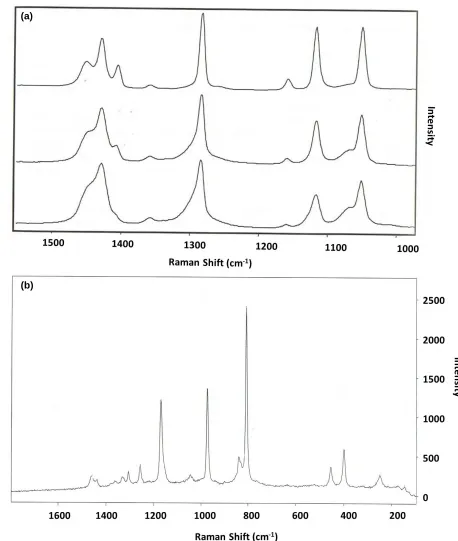
Figure 3.13. Raman spectra of the various plastic types recovered from Lake Erie sediments.
(A) Polyethylene (FT-Raman), (B) polypropylene (Dispersive Raman), (C) polystyrene
(Dispersive Raman), (D) PVC (Dispersive Raman), (E) rayon/cotton (FT-Raman), (F)
cellulose textile (FT-Raman), and (G) PMMA (Dispersive Raman). ... 55
Figure 3.14. Raman spectrum of blue microplastic, identified as polypropylene containing copper
(II) phthalocyanine blue pigment. ... 59
Figure 3.15. Daily accumulation of plastics per m2 by number of plastics and type of plastics. . 61
xii
Figure 3.17. Plastics collected from Lake Erie beaches. (A) Macroplastic fragments from Seacliff
Beach (T3-30 m), (B) polystyrene macroplastics from Lakewood Beach (T0-0 m), (C)
pellets from Seacliff Beach (T2-20 m), and (D) intact macroplastics from Long Beach
(T4-40 m) including bottle caps, cigarette butts, cigarette filters, a straw, a firecracker, a fake
nail, and candy wrappers... 64
Figure 3.18. Daily accumulation of macroplastics per m2 by number of macroplastics and type of
macroplastic. ... 65
Figure 3.19. Daily accumulation of macroplastics per m2 by weight of macroplastic and type of
macroplastic. ... 66
Figure 3.20. Daily accumulation of microplastics per m2 by number of microplastics and type of
microplastic. ... 67
Figure 3.21. Daily accumulation of microplastics per m2 by weight of microplastic and type of
microplastic. ... 68
Figure 3.22. Accumulation of beach plastics along transects (per m2) by number and type. ... 70
Figure 3.23. Daily accumulation of beach plastics along transects (per m2) by weight and type. 71
Figure 3.24. Daily accumulation of beach macroplastics along transects (per m2) by number and
type. ... 72
Figure 3. 25. Daily accumulation of beach macroplastics along transects (per m2) by weight and
type. ... 73
Figure 3.26. Daily accumulation of beach microplastics along transects (per m2) by number and
type. ... 74
Figure 3.27. Daily accumulation of beach microplastics along transects (per m2) by weight and
xiii
Figure 3.28. Macroplastics and microplastics recovered from Lake Erie tributaries. Macroplastics
by number (A) and weight (B), and microplastics by number (C) and weight (D). ... 77
xiv
LIST OF TABLES
Table 2.1. Relevant polymers and their Raman shifts and molecular vibrations. ... 31
Table 3.1. Average number of Lake Erie microplastics recovered from foreshore and backshore
at each beach. ... 37
Table 3.2. Summary of Lake Erie microplastics recovered from foreshore and backshore
environments. ... 39
Table 3.3. Summary of Lake Erie microplastic in tributary sediments. ... 43
Table 3.4. Summary of Lake Erie microplastics recovered from benthic sediment samples. ... 47
Table 3.5. Summary of microplastic fragments analyzed using Raman Spectroscopy, including
colour and identification. ... 53
Table 3.6. Summary of Lake Erie plastics recovered from beach quadrats by daily abundance. 62
Table 3.7. Summary of Lake Erie plastics recovered from beach quadrats by daily weight. ... 63
Table 3.8. Summary of Lake Erie macroplastics recovered from beach quadrats by daily
abundance. ... 65
Table 3.9. Summary of Lake Erie macroplastics recovered from beach quadrats by daily weight.
... 66
Table 3.10. Summary of Lake Erie microplastics recovered from beach quadrats by daily
abundance. ... 67
Table 3.11. Summary of Lake Erie microplastics recovered from beach quadrats by daily weight.
... 68
Table 3.12. Summary of Lake Erie plastics recovered from beach transects by abundance. ... 71
xv
Table 3.14. Summary of Lake Erie macroplastics recovered from beach transects by abundance.
... 73
Table 3.15. Summary of Lake Erie macroplastics recovered from beach transects by weight. ... 74
Table 3.16. Summary of Lake Erie microplastics recovered from beach transects by abundance.
... 74
1
CHAPTER 1
INTRODUCTION
The abundance of plastic debris in the Laurentian Great Lakes is a significant
environmental concern because plastic litter in marine environments has been shown to cause
detrimental effects on various organisms and ecosystems. These effects include entanglement of
organisms in items such as nets, ropes, packing loops and monofilament lines (e.g. Innis, 2010;
NOAA, 2015; Yorio et al., 2014), ingestion of plastic by birds, seals, fish, and many other
organisms (e.g. Possatto et al., 2011; Bravo Rebolledo et al., 2013; Bond et al., 2014), adsorption
of pollutants from the water column onto plastics surfaces (e.g. Endo et al., 2005; Colabuono et
al., 2010; Koelmans et al., 2014), and transport of invasive species through encrustation of
plastic objects (Barnes, 2002; Gregory, 2009). Beach, tributary, and lake bottom sediments in
both marine and freshwater environments are becoming polluted with plastics as waste is
transferred from urban areas toward water bodies (Ross et al., 1991; Galgani et al., 1995;
Corcoran et al., 2015). The majority of research concerning plastics pollution focuses on the
high water marks along beaches, called strandlines. Strandlines are major accumulation zones of
natural and manufactured marine debris, particularly plastics (Gregory, 2009). These areas are
aesthetically displeasing and are targeted for beach clean-ups by local and managing authorities.
Beach clean-ups, however, may disrupt the ecological habitat of marine-to-terrestrial
invertebrate biota, which could in turn affect vertebrates, such as birds, rats, and other
scavenging mammals who feed along strandline environments (Llewellyn and Shackley, 1996).
2
of plastic, and secondary prevention through proper disposal of debris, rather than tertiary
prevention through beach clean-ups.
Research regarding plastic debris in land-based, shoreline and surface water
environments is extensive and has contributed substantially to raising awareness of plastics
pollution. Investigations concerning benthic plastic debris, however, are lacking for both marine
and fresh water ecosystems. Recent investigations of plastic debris in benthic zones show that
the density of normally buoyant polymers is increased with: i) addition of fillers during
manufacturing, ii) adsorption of clay particles in the water column, iii) colonization of encrusting
organisms, and iv) fecal expression following ingestion by organisms (Boerger et al., 2010; Cole
et al., 2013; Lobelle and Cunliffe, 2011; Setälä et al., 2014; Corcoran, 2015; Corcoran et al.,
2015). If enough plastics accumulate, a layer of plastic debris could line the bottom of various
bodies of water, which could induce anoxia or hypoxia by preventing gas exchange between pore
water and seawater (Goldberg, 1997).
The only known published studies regarding benthic plastic debris in the Great Lakes
system were conducted in the St. Lawrence River (Castañeda et al., 2014) and Lake Ontario
(Corcoran et al., 2015; Ballent et al., in press). The primary objective of this thesis is to present
the distribution, abundance and composition of plastic particles in beach, tributary and lake
bottom sediments of Lake Erie, Ontario. The work focuses on microplastics, which are defined
as plastic particles <5 mm in size. Microplastics are derived from degradation of larger plastic
products, or are manufactured to be relatively small. The latter type includes pellets, which are
raw materials prepared for melting and moulding into larger plastic products; and microbeads,
3
captured by sewage treatment and are therefore the most abundant size class in aquatic
environments, as well as in layers of sediment (Browne et al., 2010; Woodall et al., 2014).
The secondary objective of this thesis is to use GIS mapping software to display
population density, and plastic manufacturers, users and distributors, in order to determine their
influence on microplastics abundance along the Canadian nearshore and shoreline deposits of
Lake Erie.
1.1 Ecological threats of plastics pollution
The major dangers posed to organisms by the presence of plastic debris are well
established. Entanglement is the most noticeable environmental threat of discarded plastics, as it
affects a wide range of marine animals, including turtles, penguins, birds, whales, dolphins,
seals, sea lions, manatees, sea otters, fish, and crustaceans (Laist, 1997; NOAA, 2015).
Discarded nylon and synthetic netting, rope, and monofilament lines from commercial fishing
are particularly harmful, as they can easily entangle organisms that often cannot escape
(Gregory, 2009). Entanglement can cause complications such as drowning, injury, and starvation
(Gregory, 2009), which may cause premature and unnatural death. For example, sea lions and fur
seals are attracted to packing loops (Page et al., 2004), which tighten and cut as the animal
grows. Entanglement also poses a threat to benthic organisms, as netting can get caught on coral
reefs, thereby having the potential to severely impact marine species populations by methods
akin to “forest clear-cutting” (Watling and Norse, 1998).
Ingestion is the second major threat of plastics pollution, as it may cause internal wounds,
blockages in the digestive system, satiation, starvation, decreased reproductive capacity, and
4
chemicals (EDCs) (Laist, 1997; Mato et al., 2001; Gregory, 2009; Teutenet al., 2009). Azzarello
and Van Vleet (1987) found that planktivorous seabirds had a higher incidence of plastic
ingestion than piscevorous seabirds, because planktivorous species are more likely to confuse
plastic pellets with plankton. Another case of confusion involves seabirds mistaking styrofoam
and spongy plastic for cuttlebone (Cadee, 2002). Ward and Shumway (2004) found that bivalve
molluscs can filter and take up polystyrene spherules and Browne et al. (2008) found similar
results with mussels. Other animals affected by plastic ingestion include sea turtles, manatees,
pelagic fish, and seals. It has been suggested that fish and molluscs ingest plastic particles, and as
they are prey to larger species, the plastic particles may move up the food chain (Eriksson &
Burton, 2003).
Plastics are biochemically inert and will not interact with cell membranes, however, they
do have the capacity to adsorb pollutants which can interact with cell membranes. Hydrophobic
chemicals are adsorbed onto the surfaces of plastic from seawater, or may be added to the
plastics during production (Mato et al., 2001; Rios et al., 2007; Teuten et al., 2009). Plastics
contain additives that can be EDCs, such as bisphenol A (BPA), phthalates, polybrominated
diphenyl ethers (PBDEs), and tetrabromobisphenol A (TBBPA), that have been found to cause
developmental, reproductive, neural, and immune issues in different species, such as humans,
rodents, seabirds, and sea turtles (Howdeshell et al., 1999; Meeker et al., 2009, Talsness et al.,
2009; Teuten et al., 2009; Davison and Asch, 2011). Persistent organic pollutants, such as
dichlorodiphenyl-dichloroethylene (DDE), PCBs and polycyclic aromatic hydrocarbons (PAHs),
can be adsorbed onto plastics, and have been shown to disrupt developmental, reproductive,
neural, and immune systems in different species (Endo et al., 2005; Jones and de Voogt, 2007;
5
Plastic debris in aquatic systems may serve as transport mechanisms for invasion of
opportunistic alien species. Invasion of alien species may cause a threat to the overall
biodiversity of a specific aquatic system by disrupting its homeostasis, and can have detrimental
consequences to aquatic ecosystems (Grassle et al., 1991; Gregory, 1999). Gregory (2009)
found that pelagic plastic items are often encrusted by a multitude of opportunistic species, such
as hard-shelled organisms, crustose organisms, and bryozoans. Transport of these species into
foreign environments disrupts the biodiversity by attracting new predators that were not
originally part of that ecosystem (Gregory, 2009). For example, Gregory (1978) suggested that a
native Australian species of bryozoan colonized plastic pellets and crossed the Tasman Sea to
inhabit New Zealand’s marine ecosystems. Colonization of alien species, such as the invasion of
the Great Lakes with zebra mussels, has been found to have negative impacts on native species.
Marsden (1992) discovered that invasive zebra mussels deplete native micro-organisms of
nutrients by excessive filter feeding, and cause a high mortality rate of native benthic organisms
through encrustation. Alien organisms causing early mortality of native species will directly
impact the native biodiversity in a specific ecosystem.
1.1.1 Species at risk of ingesting microplastic particles in Lake Erie
Macroinvertebrates of Lake Erie that may be at risk of ingesting microplastic particles
include molluscs, zebra mussels, and quagga mussels (Mason et al., 2002). Ward and Shumway
(2004) and Browne et al. (2008) have already found that some molluscs and mussels are
ingesting microplastic particles, suggesting that molluscs and zebra mussels in Lake Erie may be
ingesting microplastic particles if they are present. Foraging fish of Lake Erie may be at risk of
indirectly ingesting microplastic particles by feeding on molluscs, zebra mussels, and quagga
6
particles by mistaking them for other food (NOAA, 2009). The foraging fish at risk of ingesting
microplastic particles are lake whitefish, round goby, freshwater drum, rainbow smelt, white
perch, yellow perch, common carp and channel catfish (NOAA, 2009). Piscivores in Lake Erie
that may be at risk of ingesting microplastic particles, either directly or indirectly, are rainbow
trout, white bass, smallmouth bass, lake trout, walleye, and burbot (NOAA, 2009). Lake Erie
supports the largest commercial fishery in the Great Lakes, with walleye, yellow perch, rainbow
trout, and bass being the most heavily harvested (Ministry of Natural Resources and Forestry,
2016). If these fish ingest microplastic particles with adsorbed POPs or EDCs, it may pose health
risks to the human population that consumes those fish. A study in progress has already
identified 20 pieces of microplastics in the gastrointestinal tract of medium-sized fish and 44
pieces in cormorants of Lake Erie (Smith, 2014). An aerial survey on November 16, 2010
observed 201,016 waterbirds, including cormorants, ducks, geese, swans, and eagles, within the
offshore western basin of Lake Erie (Lake Erie Improvement Association, 2010). All of these
species of waterbirds may be at risk of ingesting microplastic particles, as well as becoming
entangled in fish netting.
1.1.2 Species at risk of entanglement in Lake Erie
With Lake Erie being the largest commercial fishery in the Great Lakes, most fish and
waterbirds may be at risk of entanglement in nets. Three types of nets are typically used in Lake
Erie for commercial fishing: gillnets, seines, and trap nets. Studies by NOAA (2014a; 2014b;
2014c) determined entanglement risks of these nets in relation to sea turtles and marine
mammals, however, their observations of species at risk of entanglement in lacustrine
environments are lacking. Gillnets are typically made of mono- or multi-filament nylon, and are
7
that it cannot back out (NOAA, 2014a). Gillnets have been found to pose a risk of entangling sea
turtles and large marine mammals, such as whales, porpoises, dolphins, and sea lions (NOAA,
2014a). Gillnets are currently illegal in the US side of Lake Erie, however they are still legal in
Canada (Ohio Department of Natural Resources, 1983). Seines are typically made of nylon or
Kevlar (synthetic fibre) and are a type of net designed to capture schools of fish by enclosing
them (NOAA, 2014b). By targeting schools of fish, seines reduce the risk of entangling
undesired species, such as sea turtles and other marine mammals. Traps and pots are made of
wood or wire and are designed to allow organisms to enter the enclosure, but escaping is difficult
or impossible (NOAA, 2014c). In order to minimize entanglement of undesired creatures,
culling rings (to allow undersized animals to escape), weak links and breakaway lines (to
minimize injury and mortality by allowing animal to break free from trap or pot), and sinking
groundlines (to minimize risk of entanglement) have been added to traps and pots (NOAA,
2014c).
1.2 Microplastics in aquatic environments
Microplastics are a potential significant threat to aquatic ecosystems because of their size,
abundance, and long residence times, which all increase the possibility of ingestion (Andrady
2011; Cole et al, 2011). Microbeads, which are used in personal care products as well as in air
blast media, have recently been banned in the states of California, Illinois, and New York, and
the U.S. Microbead-Free Waters Act of 2015 was signed in 2016. The government of Canada
proposed an amendment of the Canadian Environmental Protection Act 1999, to ban the use and
sale of personal care products that contain microplastics (BILL C-684). In addition to
8
Microplastics travel from land to oceans, lakes and rivers along natural and human-made
watercourses, or are directly spilled into large water bodies via fishing and aquaculture activities
(Andrady 2011; Cole et al, 2011). Microplastic particles are too small to become trapped in
wastewater treatment facilities, and are thus expelled in effluent discharge or within water
overflowing storm sewers during strong rain events (Fendall and Sewell, 2009; Eriksen et al.,
2013; Dris et al., 2015). Microplastics are abundant near urban areas (e.g. Browne et al., 2010;
Yonkos et al., 2014), but have also been identified in remote locations, such as mountain lakes,
deep-sea sediments and even in Arctic ice (Free et al., 2014; Obbard et al., 2014; Fischer et al.,
2015). Two investigations of microplastics in bottom sediment have been conducted in the Great
Lakes system; one from the St. Lawrence River (Castañeda et al. 2014) and another from Lake
Ontario (Ballent et al., in review). Castañeda et al. (2014) determined an average of 52
microbeads/m2 from 10 sites along the St. Lawrence River, although some of these may have
been particles of fly ash. Ballent et al. (in review) discovered 98 pieces of microplastic/100 g of
dry sediment from 25 sample sites in Lake Ontario. Fragments and fibres were the most common
types of microplastics, with a relatively minor amount of microbeads. Microplastics have also
been identified in the surface waters of the Great Lakes. Eriksen et al. (2013) used a manta trawl
to sample for plastics in Lake Superior, Lake Huron, and Lake Erie, and found an extrapolated
average of 43,000 pieces/km2.
The potential danger of microplastics to organisms has been established in laboratory
experiments (Cole et al., 2011). Organisms including lugworms, barnacles, mussels, scallops, sea
cucumbers, amphipods, copepods, and larvae of echinoderms and trochophores have all been
shown to ingest microplastics (Wilson, 1973; Hart, 1991; Bolton and Havenhand, 1998; Brilliant
9
2009). Marine fish species have also been found to ingest microplastics (Boerger et al., 2010;
Davison and Asch, 2011). Closer to home, Sheri Mason from SUNY Fredonia and Lorena
Rios-Mendoza from the University of Wisconsin Superior have identified microplastic fibres in the
gastrointestinal tracts of fish from Lake Michigan and Lake Superior (personal communication).
1.3 Impacts of plastics burial in the environment
Plastics may cause contamination of the surrounding sediment through addition of
leached plasticizers and adsorbed POPs. These pollutants have the ability to be introduced to
subsurface beach organisms (Teuten et al., 2007), which may disrupt their overall fitness (from
factors discussed in 1.1).
Carson et al. (2011) found that plastic in beach sediments may significantly increase the
permeability and insulation properties of subsurface beach environments. Increased permeability
allows fluids to pass more quickly through the sediment, which may cause native subsurface
beach organisms and their eggs, such as crustaceans (Penn and Brockman, 1994), mollusks
(D’avila and Bessa, 2005), polychaetes (Di Domenico et al., 2009), fish, and interstitial
meiofauna (Quinn, 1999), to experience desiccation in areas of high plastic accumulation.
Desiccation of eggs may cause them to be unviable and increase the mortality of these taxa.
Increased permeability may alter the flux of organic matter through the sediment column, which
may support larger populations of interstitial organisms (Carson et al., 2011), causing a
disruption in the local food chain. The increased flux may also impact rate of nutrient cycling
into the adjacent bodies of water, which may impact the metabolic activity of native organisms
10
Plastics causing insulation of beach sediment may disrupt the native subsurface
organisms and their eggs. Sex-determination of sea turtle eggs is temperature-dependent
(Yntema and Mrosovsky, 1982), therefore insulation of subsurface sediment may disrupt the
gender balance in sea turtles. However, Carson et al. (2011) suggests that thermal insulation
could balance out the effects of increased permeability by decreasing evaporation.
Some plastic products are designed to degrade under certain conditions. Andrady (2015)
compared the photodegradation of plastics in air and water, and found that plastics in air become
embrittled more rapidly than those in water. In addition, plastics that are buried in beach
sediment are protected from UVB degradation, as well as mechanical processes that would help
11
CHAPTER 2
REGIONAL SETTING AND METHODOLOGY
2.1 Regional setting of Lake Erie
Lake Erie is approximately 388 km long, has a breadth of 92 km, and has an average
depth of approximately 19 m (EPA, 2015). Water flows into Lake Erie through the Detroit River,
which drains Lake St. Clair. The accumulation and distribution of plastic debris around and in
Lake Erie could be controlled by: 1) its location in the Great Lakes system downstream from
Lakes Superior, Huron, and St. Clair, 2) surface water circulation patterns, 3) sedimentation
rates, 4) proximity of plastics use and manufacturing industries, and 5) population density.
Lake Erie is characterized by a two-gyre water circulation pattern (Figure 2.1). Winter
circulation is strong due to high winds, and is anticyclonic in the northern and cyclonic in the
southern part of the basin. The strongest winter circulation was recorded offshore, near
Cleveland, OH at 3.7 cm/s (Beletsky et al., 1999). During the summer, Lake Erie has a dominant
anticyclonic gyre, with a small cyclonic gyre in the western part of the basin (Beletsky et al.,
1999). The highly variable annual circulation patterns possibly contribute to the different
sedimentation rates in Lake Erie. Kemp et al. (1977) determined that sedimentation rates varied
from 0 to >7.4 mm/yr, with the highest rates in the western and eastern basins (Figure 2.2).
Robbins et al. (1978) also found that sedimentation rates were >10 mm/yr in eastern Lake Erie.
Mass accumulation rates by Seo (2015) were considered and show a similar trend to
sedimentation rates; higher mass accumulation rates were determined in areas with higher
12
In addition to water circulation patterns and sedimentation rates, plastics accumulation
may also be influenced by industry and population distribution around the lake. Four of the top
plastics production companies are located around the basin and contribute to 10% of Canada’s
plastic production industry (City of Erie, 2011; Zybyszewski, 2012). Plastic pellets from these
types of plants are prone to spillage within the factories, and during transportation or off-loading,
which can result in pellets travelling down storm drains into rivers and lakes (Zybyszewski et al.,
2014; Corcoran et al., 2015). The Lake Erie watershed is home to over 11 million people, and
one third of the Great Lakes human population (City of Erie, 2011; Environment Canada,
2013). The quaternary watersheds nearest Lake Erie in Ontario are highly populated within
13 LAKE HURON
LAKE ST. CLAIR DETROIT RIVER LAKE ERIE ( c) ( d) Figure 2.1. Location maps,
tributary sampling locations (green circles), beach sampling locations (yellow circles), near shore sampling locations (red circles), and seasonal circulation patterns (black arrows) of Lake Erie. (A) Location of Lake Erie in North America, box indicates study area. Surface water current patterns in Lake Erie from (B) May–October and (C) November–April, and (D) average annual surface water current patterns; circulation patterns from Beletsky et al. (1999).
14
Figure 2.2. Sedimentation rates of Lake Erie, Ontario as determined by Kemp et al. (1977).
2.2 Lake Erie sampling locations
Sampling areas for plastic included 6 beaches along Lake Erie, 4 tributaries draining into
Lake Erie, 10 nearshore locations in Lake Erie, and 2 nearshore locations in Lake St. Clair
(Figure 2.4).
2.2.1 Lake Erie beach locations and sampling methods
Six beaches along the northern shoreline of Lake Erie were chosen for sampling of
15
Figure 2.3. Populations of quaternary watersheds associated with Lake Erie, Ontario.
along the northwestern shoreline, whereas Crystal Beach, Long Beach, and Waverly Beach are
located along the northeastern shoreline. The beaches were selected based on two factors:
previous plastic debris research and proximity. Zbyszewski et al. (2014) did not collect plastic
abundance and distribution data from these beaches, therefore these beaches will contribute to
the overall Lake Erie plastics abundance and distribution data. Beaches were chosen based on
proximity, as the northwestern beaches were visited daily for one week (June 22 – June 29,
2015), and the northeastern beaches were visited daily for one week (June 30 – July 7, 2015) for
quadrat and transect data. Crystal Beach is part of a small community with a population of
16
Figure 2.4. Lake Erie sampling locations and sample identification codes. Note that 29 Arch, 5813 Arch, and Stn 2060 share the same location.
eastern beach is public. The public part of the beach dips 4-10° towards the lake, and has an
average width of 23 m (Figure 2.5a). The public beach is frequented by thousands of tourists
each summer season (Exploring Niagara, 2014a), serving as a potential area of accumulation of
anthropogenic waste. Historically, the beach was more popular, as it hosted an amusement park
and ferries from 1888-1989 (Exploring Niagara, 2014a).
Long Beach is part of a conservation area with non-serviced campsites nearby (Niagara
Peninsula Conservation Authority, 2015). The beach dips 2-3° towards the lake, and has an
average width of 22 m (Figure 2.5b). It is fairly remote, but is occasionally the site of community
17
Figure 2.5. Photos illustrating the nature of the beaches sampled. A) Crystal Beach, field of view at bottom of photo (FOV) is ~2.5 m; B) Long Beach, FOV ~2.5 m; C) Waverly Beach, FOV ~2.5 m; D) Lakewood Beach, FOV ~2.5 m; E) Rondeau Beach, field of view is ~ 4.0 m at recycling bin; F) Seacliff Beach, FOV ~2.0 m.
with a waterfront trail as its main attraction (Exploring Niagara, 2014b). The beach dips 4-8° and
has a variable width ranging from 9-21 m (Figure 2.5c). Lakewood Beach is located in
Amherstburg, ON, which has a population of over 21,000. The beach dips up to 8 ° towards the
lake, and has a variable width ranging from 1-7.5 m (Figure 2.5d). Rondeau Beach is located in
Rondeau Provincial Park and has over 11 km of sandy shoreline (Ontario Parks, 2016) (Figure
2.5e). The beach dips 3-8° and is 4-9.5 m wide. Rondeau Provincial Park attracts over 150,000
tourists per year and has environmental stewards that run beach clean-up programs (Rondeau (f)
(e)
(d)
(c)
18
Cottagers Association, 2015). Seacliff Beach is a public beach located in Leamington, ON
(Figure 2.5f), which has a population of over 28,000 (The Municipality of Leamington, 2014). It
has a wide variety of amenities, which attracts many tourists annually. The beach dips 2-10° and
has an average width of 12.5 m.
The three northeastern beaches were sampled on November 14, 2015, and the three
northwestern beaches were sampled on November 15, 2015 using a Split Spoon sampler. A Split
Spoon sampler recovers the top 30 cm of sand and one sample was retrieved near the foreshore
(e.g. the part of the shore between high- and low-water marks (Merriam-Webster Dictionary,
2016)) and a second sample was retrieved near the backshore (e.g. the part of the shore that
extends from the high-water mark to dunes and only affected by waves during high wave-action
or storms (Merriam-Webster Dictionary, 2016)). Three 10 cm-size cylindrical plastic casings
were marked 0-10 cm, 10-20 cm, and 20-30 cm loaded vertically into a split steel tube. The other
half of the split steel tube was placed on top of the loaded steel tube to enclose the casings. The
split steel tubes were sealed together by screwing a drive shoe onto the bottom, where the 20-30
cm casing is loaded, and a drive head assembly was screwed onto the top, where the 0-10 cm
casing was loaded. The sampler was placed perpendicular to the beach surface and was
hammered into the sand.When the steel tube was approximately 3 cm below the sand surface,
the drive head assembly was removed. The tube was swiftly twisted out of the hole and placed
horizontally onto a clean surface. The casings were capped with blue to mark the bottom of the
sample and capped with white to mark the top.
At each of the six beaches, two 2 x 2 m quadrats were measured and marked using cotton
rope and stakes (Figure 2.6a). These quadrats were visited each day for one week to collect
19
to each beach (Figure 2.6b). At every 10 m interval, a 1 m wide swath was sampled for visible
plastic up to depths of 3 cm. The slope of each beach and midpoint coordinates were also
recorded.
Plastic particles sampled from the beach quadrats and traverses were brought back to the
lab, emptied onto aluminum pie plates, and placed in a drying oven set to 90°C for 8 hours.
Using Taylor Sieves with openings of 5.6 mm, 1 mm, and two larger sieves on top (to meet the
minimum of four sieves required), the sample was sieved at 50 Hz for 5 minutes. Plastics from
each size category (>5.6 mm, 1 mm to <5.6 mm) were categorized as plastic fragments,
polystyrene, filaments, or intact items. Plastic items in each category were counted and weighed,
and the type of intact item was recorded.
Figure 2.6. (A) Two-by-two meter sampling quadrat at Lakewood Beach and (B) 50 m sampling transect at Crystal Beach.
2.2.2 Lake Erie tributary locations and sampling methods
Sediment samples were collected from four tributaries emptying into Lake Erie: Grand
River Tributary, Welland Canal Tributary, a small sewage outlet near Rondeau Beach, and
Sturgeon Creek tributary in downtown Leamington (Figures 2.1, 2.4, 2.7). Grand River Tributary
sediments were sampled from a boat launch inclined at 20°, 4 m from the water along a storm
20
strandline (Figure 2.7a). The water flow was ~35 m3/s (GRCA, 2015). The Welland Canal
sampling site was located next to the canal wall (Figure 2.7b). The water in the vicinity was at a
depth of approximately 2.4 m and was flowing at a rate of approximately 180 m3/s (Labbaf,
2010). Samples from the Rondeau Beach outlet were collected from off of the northern side of a
bridge on a raised sandy mound 0.15 m high (Figure 2.7c), and from off the south side of the
bridge, where the ground sloped 32° toward the water. The water flow rate was approximately
0.03 m3/s (Hamdy and Kinkead, 1978). Sturgeon Creek tributary sediments in downtown
Leamington were sampled near a storm drain outlet (Figure 2.7d). The water depth in the vicinity
was 0.28 m on the south side of the bridge and 0.4 m directly under the bridge.
Tributary bottoms were sampled using a Petite Ponar grab sampler, provided by the
Ministry of Environment and Climate Change. The northeastern tributaries were sampled on
November 14, 2015 and the northwestern tributaries were sampled on November 15, 2014.
While standing on a bridge or wading in water, the Petite Ponar was lowered by rope until it
reached the tributary bottom. The rope was then jerked in order to allow the line to become
slack, thereby tripping the sampler. The grab sampler was lifted from the tributary bed and was
placed in a metal pan to release the sediment sample. The sample was scooped into a Nalgene®
high density polypropylene jar and placed in a cooler until sample separation. Two tributary
quadrats, measuring 2 m × 2 m, were set up at two suitable tributary locations: the Grand River
boat launch, and the Rondeau inlet. Tributary quadrats were not taken at the Welland Canal and
Sturgeon Creek in Leamington. Both locations had built-up concrete walls and the water does
21
Figure 2.7. Tributary sampling locations. A) Grand River tributary with boat launch, FOV ~2.5 m; B) Welland Canal, field of view is ~4.0 m (Google Maps, 2016); C) Rondeau Inlet, field of view at sand mound is ~6.0 m; D) Leamington Tributary (Sturgeon Creek), FOV ~2.5 m.
2.2.3 Lake Erie benthic sample locations and sampling methods
Lake Erie and Lake St. Clair surface sediment samples were collected in August 2014 by
the Ministry of Environment and Climate Change using a Shipek sampler (Wildco, Yulee, FL,
USA). The Shipek sampler collects the top 3 cm of lake bottom sediment. Thirteen Shipek
samples were collected in various locations along the nearshore northern portion of Lake Erie in
water depths ranging from 5-12 m (Figures 2.1, 2.4), and two Shipek samples were collected in
Lake St. Clair. The top 3 cm of three discrete grabs were homogenized in pre-cleaned stainless
steel pans and transferred to a 500 mL polyethylene terephthalate (PET) jar. The samples were
chilled and transported to the laboratory for analysis.
One passive sediment trap sample was collected from the Western Basin of Lake Erie by
the Ministry of Environment and Climate Change in the summer of 2014. The passive sediment
trap consisted of four acrylic cylinders set in 2 L plastic beakers in a deployment frame. The
(a)
(c)
(b)
22
passive sediment trap was deployed ~2.0 m off the lake bottom to capture material falling
through the water column from May 26, 2014 to October 23, 2014. Upon retrieval of the passive
sediment trap, the water was drained off and the settled material from each tube was transferred
to a 500 mL PET jar.
2.3 Separation and analysis of microplastics and sediments
The sediment samples were thawed at room temperature in Corcoran’s Sample
Separation Laboratory, emptied onto aluminum pie plates, and placed in a drying oven set to
90°C for 8 hours. If the dried samples solidified, they were wet-sieved to remove clay-sized
particles and were re-dried at 90°C for eight hours. Each dried sample was weighed and placed
into a Taylor Sieve apparatus with sieve sizes of 63 µm, 2 mm, 4 mm, and 5 mm. The sample
was sieved at 80 Hz for 5 minutes, and sediment <63 µm was returned to the sample container.
Sediment <63 µm and not inspected for microplastics, because this grain-size is too small to
analyze using the lab equipment provided. Sediment between 63 µm and 2 mm was emptied into
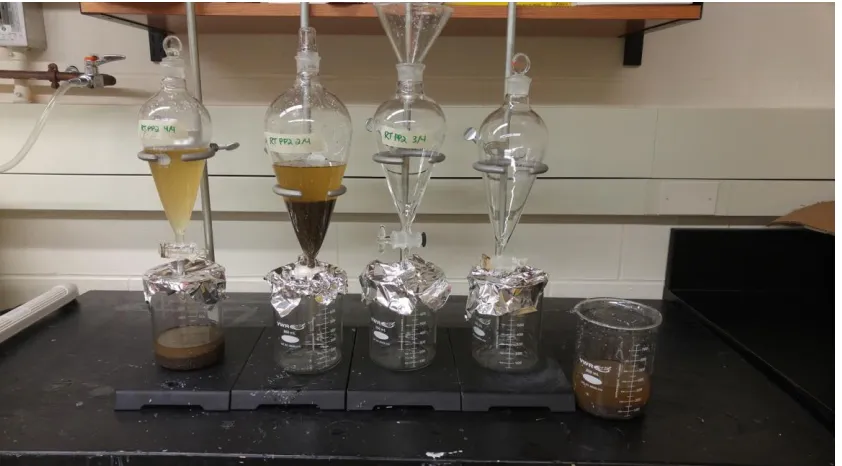
250 ml of sodium polytungstate (SPT) solution with a specific gravity of 1.5 g/cm3. The samples
were magnetically stirred at 8 Hz for 1 minute and were then poured into a 750 mL separatory
funnel with a 2-mm stopcock (Figure 2.8). The sample was allowed to settle for approximately
10 minutes, the stopcock was opened and the heavy grains were drained into a 750 ml beaker,
until only floating particles were left in the separatory funnel. The floating particles were filtered
from the SPT solution by draining the separatory funnel into a beaker fitted with a conical funnel
that was lined with filter paper. If there was a low amount of organic material, the filter paper
was placed into a petri dish and the >1.5 g/cm3 particles were re-dried at 70°C for 18 hours. The
23
Lab, at magnifications of 10× to separate plastics from sediment. The plastics were removed
using tweezers, placed onto double sided tape in a petri dish and were counted according to
plastic type: fragments, fibres and beads.
If there was a great amount of organic material on the filter paper following SPT
separation, the filter paper was rinsed with distilled water and placed in a beaker for later
dissolution of organic material using wet peroxide oxidation. The procedure was performed
according to the methods outlined by NOAA (2015). Under a fumehood, a 0.05 M Fe (II)
solution was prepared by adding 7.5 g of FeSO4·7H2O to 500 mL of distilled water and 3 mL of
concentrated sulphuric acid. Twenty mL of the prepared 0.05 M Fe (II) solution was added to a
750 mL beaker containing the organics. Twenty mL of 30% hydrogen peroxide was added to the
beaker and was allowed to settle for 5 minutes at room temperature under the fumehood. A stir
bar was added to the beaker and covered with a watch glass. The sample was heated to 75°C on a
hotplate and removed as soon as bubbles were observed. If the sample boiled violently, distilled
water was added to control the boiling. Once the bubbling subsided, the sample was heated to
75°C for an additional 30 minutes. If organic matter was still visible, another 20 mL of hydrogen
peroxide was added and the procedure was repeated until no organic material remained. The
sample was then placed into a drying oven at 90°C for 8 hours. The dried sample was emptied
into a petri dish and was microscopically analyzed to separate plastics from sediment. The
plastics were removed using tweezers, placed onto double sided tape in a petri dish, and were
24
Figure 2.8. Separatory funnel set up at various stages of plastic separation process.
2.4 Micro-Raman analysis of microplastics
2.4.1 Theory of Raman spectroscopy
In 1928, the discovery of Raman scattering – inelastic scattering of photons – provided
the basis of Raman spectroscopy (Ball, 2001; Nafie, 2001; McCreery, 2000). Raman
spectroscopy is used to detect molecular vibrations, such as bending, rocking, scissoring,
stretching, twisting, and wagging (Gardiner, 1989), thus, providing a fingerprint for specific
materials. Raman spectrometers are equipped with a monochromatic light source, such as a laser,
which interacts with molecular vibrations (Gardiner, 1989). These molecular vibrations cause the
laser photons to release energy or gain energy, resulting in visualization of distinct molecular
vibration patterns in materials (Gardiner, 1989). In order to activate the Raman modes, the
sample is illuminated with the monochromator and the electromagnetic radiation from the
25
photons – is filtered out, leaving the Raman photons to be dispersed onto a detector by a notch
filter to a band pass filter (McCreery, 2000). Because Rayleigh scattering occurs more often than
Raman scattering (Harris and Bertolucci, 1989), detection of Raman scattering may be amplified
by equipping the Raman spectrometer with other devices, such as the aforementioned filter or a
Fourier-transform spectrometer (McCreery, 2000). The detector will display a Raman spectrum
of Raman shift (wavenumber) (cm-1) vs. arbitrary intensity, which is a unique fingerprint of the
material that was sampled.
2.4.2 Plastic identification using Raman spectroscopy
Intensity bands displayed on Raman spectra are used to identify different types of plastic.
Raman peaks, breadth, and relative intensities centered at specific wavenumbers correspond to
specific molecular vibrations that are unique to different materials (Allen et al., 1999). Vibrations
of specific bonds can be sensitive to crystallinity, which is why the intensity bands are visible.
For example, polyethylene is commonly identified by its intensity bands at 1461 cm-1, 1439 cm-1,
and 1416 cm-1, which correspond to CH2 scissoring, CH2 scissoring, and CH2 wagging
vibrations, respectively (Allen et al., 1999). Plastics pertinent to this study are summarized in
Figure 2.9 Table 2.1. Fourier-transform Raman spectroscopy and dispersive Raman were used to
determine the composition of microplastics collected from Lake Erie, and are described in more
detail below.
2.4.3 Fourier-transform Raman spectroscopy
Raman spectra of 24 microplastic samples were obtained using an NXR FT-Raman
module coupled to a 6700 Fourier transform infrared spectrometer (Thermo Electron
26
Suitland MD (Figure 2.10). The Raman instrument had a continuous wave near infrared
Nd:YVO4 excitation laser (1064 nm), CaF2 beam splitter, and thermoelectrically-cooled InGaAs
detector. Raman spectra were collected using a 50 µm laser spot, and laser power was varied
between 0.02 - 2.00 W (using 1.0 OD neutral density filter as needed to limit laser power).
Starting at the minimum, laser power was increased empirically to maximize the signal-to-noise
ratio without burning or vaporizing the sample. Most spectra required 512 scans across 100 -
3701 cm−1. If peaks were not evident after 512 scans, an additional 2048 scans were performed.
The Raman spectra were compared to commercial spectral libraries and custom libraries
prepared by the Smithsonian’s Museum Conservation Institute to determine the type of plastic
analyzed. The commercial libraries included the HR FT-Raman Polymer Library (copyright
1997-2001, 2004 Thermo Electron Corporation for Nicolet Raman), the HR Pharmaceutical
Excipients FT-Raman Library (copyright 1999, 2004 Thermo Electron Corporation for Marcel
Dekker, Inc.), and the FDM Retail Adhesives & Sealants (Fiveash Data Management, Inc.,
27
Figure 2.9. Relevant reference Raman spectra of polymers: (A) polyethylene (Raman spectra from Lewis (2001)), (B) polypropylene (Raman spectra from Michielsen (2001)), (C) polystyrene (Raman spectrum from McCreery Research Group (2014)), (D) poly vinyl chloride (Raman spectrum from Nørbygaard & Berg (2004)), (E) cotton (Raman spectrum from McCreery Research Group (2014)), (F) cellulose textile (Raman spectra from Cho (2007)), and (G) poly methyl methacrylate (Raman spectrum from Emmons et al. (2006)).
(a)
28
29
30
31
Table 2.1. Relevant polymers and their Raman shifts and molecular vibrations.
Polymer Raman
shifts (cm-1)
Molecular vibration Source
Cellulose textile 1479 1462 565 327
CH2 scissoring (cellulose I) Cellulose II crystal lattice C-O-C bending (cellulose I) C-C-C bending (ring deformation)
(Kavkler and Demsar 2011)
Polyethylene 1461
1439 1416
CH2 scissoring CH2 scissoring CH2 wagging
(Allen et al., 1999)
Poly methyl methacrylate
813 600
C-O-CH3 stretching (symmetrical) C-C-O stretching (symmetrical)
(Flores and Chronister, 1996) Polypropylene 1458
1435 1220 1168 1151 998 972 841 808
CH2 bending CH2 bending
CH2 twisting, CH wagging, C-C stretching C-C stretching, CH3 rocking, C-C wagging C-C stretching, CH bending
CH3 rocking
CH3 rocking, CH bending CH2 rocking
CH2 rocking, C-C stretching
(Nielsen et al., 2002)
Polystyrene 3054
2905 2852 1602 1583 1451 1155 1032 1001 796 621 32* 13* 9* 28* 12* 8* 13* 27* 100* 10* 16* *advanced molecular
vibration data was unretrievable for polystyrene, however McCreery Research Group (2014) provided relative intensity data.
Polyurethane 2275
1732 1612 1530 1445 1303 1251 1185
N=C=O asymmetrical stretching
C=O (ester)stretching, C=O (urethane amide I) stretching
Ar stretching
Ar stretching, C-N stretching + N-H bending (urethane amide II)
N=C=O stretching, CH2 bending CH bending, urethane amide III? Urethane amide III?
Urethane amide?
(Parnell et al., 2003) Poly vinyl chloride 2927 2252 1530 1139
C-C (higher harmonics of 1139 cm-1 C-C stretch) C-C (higher harmonics of 1530 cm-1 C-C stretch) C-C stretching
C-C stretching
32
Figure 2.10. NXR FT-Raman Spectrometer at the Museum Conservation Institute - Smithsonian Institute, Suitland MD.
2.4.4 Dispersive Raman spectroscopy
Dispersive Raman spectra of 45 microplastic samples were collected using the Nicolet
Almega XR spectrometer (Thermo Electron Corporation, Madison, WI, USA) at the Museum
Conservation Services - Smithsonian Institute in Maryland. The dispersive Raman module was
equipped with a 150 mW diode laser and a Peltier-cooled CCD detector. Microplastic samples
were targeted using a 50x or 100x Mplan apochromatic objective lens (Olympus, Melville, NY,
USA) with a 50 μm pinhole aperture in a BX51 confocal microscope (Olympus). The laser
power was varied between 16-100% to optimize the signal-to-noise ratio without burning or
vaporizing the sample. Most spectra were obtained using 64 scans or less across 200-3400 cm−1.
The Raman spectra were compared to commercial spectral libraries and custom libraries
33
analyzed. The commercial libraries included the HR FT-Raman Polymer Library (copyright
1997-2001, 2004 Thermo Electron Corporation for Nicolet Raman), the HR Pharmaceutical
Excipients FT-Raman Library (copyright 1999, 2004 Thermo Electron Corporation for Marcel
Dekker, Inc.), and the FDM Retail Adhesives & Sealants (Fiveash Data Management, Inc.,
Madison, Wisconsin, USA).
2.5 Mapping using ArcGIS
Maps of Lake Erie sampling locations were created using ArcMap 10.1 with the World
Light Gray Canvas Base basemap, provided by Arc Map 10.1. Layers and data were uploaded
using the most common geographic coordinate system for North America, the North American
Datum 1983. Quaternary watershed boundary data was acquired from the Ontario Open Data
Catalogue, published by Natural Resources and Forestry in April 2015. The quaternary
watershed was used, because it is a division of drainage areas that are a suitable size for Lake
Erie. For example, tertiary watershed divisions in Ontario range from 700 – 31,000 km2
(Ministry of Natural Resources and Forestry, 2015), which are too large for evaluating watershed
population density of Lake Erie which has an area of 25,744 km2. Population data was acquired
from the Statistics Canada 2011 Census Boundary Files for Populations Centre. Where
population centres overlapped with multiple watersheds, an algorithm was used to proportionally
divide the population amongst each contributing watershed. Plastic distributors, manufacturers,
and industrial plants in the Lake Erie watershed were found using ThomasNet.com. Although
this may not provide an exhaustive list, it is assumed that enough examples were located to
34
CHAPTER 3
RESULTS
3.1 Microplastics in Lake Erie sediments
3.1.1 Microplastic in beach sediments
All foreshore and backshore samples from the six beaches contained microplastic debris
(Figure 3.1a). The highest average concentration of microplastic was located at Long Beach
with 23 pieces/100 g of sediment (Table 3.1). The lowest concentration of microplastic was
located at Lakewood Beach with 5 pieces/100 g of sediment. The average concentration of
microplastic was 11 pieces/100 g of sediment. Overall, Lake Erie beach sediments had a standard
deviation of ±6.9 pieces/100 g of sediment and a standard error of ±2.8 pieces/100 g of
sediment.
The foreshore samples contained a significantly lower concentration of microplastic than
the backshore samples (Figure 3.1b), except for at Seacliff Beach, which had only 1 piece/100 g
of sediment more at the foreshore. Lake Erie foreshore beach sediments had a standard deviation
of ±3.4 pieces/100 g of sediment and a standard error of ±1.4 pieces/100 g of sediment. The
backshore with the highest concentration of microplastic was at Long Beach with 42 pieces/100
g of sediment, whereas the lowest concentration of microplastic was at Seacliff Beach with 7
pieces/100 g of sediment. Lake Erie backshore beach sediments had a standard deviation of
±13.7 pieces/100 g of sediment and a standard error of ±5.6 pieces/100 g of sediment.
Fibres were the most abundant microplastics found in both backshore and foreshore
35
backshore with 68 fibres/100 g of sediment, and the lowest amount of fibres was located at the
Waverly Beach foreshore with ~ 0 fibres/100 g of sediment. Lake Erie backshore beach
sediments had a standard deviation of ±25.1 fibres/100 g of sediment and a standard error of
±10.2 fibres/100 g of sediment. Lake Erie backshore beach sediments had a standard deviation of
±4.3 fragments/100 g of sediment and a standard error of ±1.8 fragments/100 g of sediment.
Lake Erie foreshore beach sediments had a standard deviation of ±7.3 fibres/100 g of sediment
and a standard error of ±3.0 fibres/100 g of sediment. Lake Erie foreshore beach sediments had a
standard deviation of ±2.2 fragments/100 g of sediment and a standard error of ±0.9
fragments/100 g of sediment. Examples of microplastic fibres and microplastic fragments are
1
Figure 3.1.Microplastic particles recovered from Lake Erie beach sediments by (A) average microplastic particles by location, and (B) microplastic particles relative to foreshore and backshore beach environments.
(b) Location Cry stal Bea ch Lakew ood Bea ch Long Bea ch Ronde au Beac h Sea cliff Bea ch Wav erly Bea ch M icr op last ic (pe r 1 00 g sed im en t) 0 5 10 15 20 25 30 (a) Location Cry stal Bea ch Lakew ood Bea ch Long Bea ch Ronde au Beac h Sea cliff B
1
Table 3.1. Average number of Lake Erie microplastics recovered from foreshore and backshore at each beach.
Location
# Fragment /100 g sediment
# Fibre /100 g sediment
# Microbead /100 g sediment
# Microplastics /100 g sediment
Crystal Beach 2 4 ~0 7
Lakewood Beach 4 1 0 5
Long Beach 1 22 1 23
Rondeau Beach 5 9 0 15
Seacliff Beach 4 4 0 7
38
Figure 3.2. Types of microplastics recovered in Lake Erie (A) backshore beach sediments and (B) foreshore beach sediments. Location
Crysta l Bea
ch
Lakew ood
Bea ch
Long B each Ron deau Bea ch Sea cliff B
each Wav erly Bea ch M icr op last ic p art icles (per 10 0g se dim en t) 0 20 40 60 80 100 Fragments Fibres (a) Location Crysta l Bea
ch
Lakew ood
Bea ch
Long B each Ron deau Bea ch Sea cliff B
39
Table 3.2. Summary of Lake Erie microplastics recovered from foreshore and backshore environments.
Location Environment
Distance to Water (m) # Fragments /100 g sediment # Fibres /100 g sediment # Pellets /100 g sediment # Microplastics /100 g sediment Crystal Beach
Backshore 15.20 2 6 ~0 8
Foreshore 13.20 3 2 0 5
Lakewood Beach
Backshore 13.20 7 ~0 0 7
Foreshore 7.60 1 2 0 3
Long Beach
Backshore 37.30 1 40 1 42
Foreshore 19.80 ~0 3 0 4
Rondeau Beach
Backshore 14.20 8 10 0 18
Foreshore 4.85 3 8 0 12
Seacliff Beach
Backshore 50.00 6 1 0 7
Foreshore 5.30 1 6 0 8
Waverly Beach
Backshore 34.10 1 11 0 12
40
41
3.1.2 Microplastic in tributary sediment
Out of eight tributary locations, one sample contained no microplastic (Figure 3.4a; Table
3.3). This sample was collected from the Grand River tributary; however, the other Grand River
sample contained 10 pieces/100 g of sediment. The highest concentrations of microplastic were
found in the Welland Canal samples with 52 pieces/100 g of sediment and 40 pieces/100 g of
sediment. The other six locations contained < 10 pieces/100 g of sediment. The average
concentration of microplastic was 14 pieces/100 g of sediment. Overall, Lake Erie tributary
sediments had a standard deviation of ±20.3 pieces/100 g of sediment and a standard error of
±7.2 pieces/100 g of sediment.
Fragments and fibres were the most common microplastics recovered, however some
microbeads were recovered as well (Figures 3.4b; 3.5a; 3.5b). Fragments, fibres and microbeads
were most abundant in the Welland Canal tributary samples with 38 fragments/100 g of
sediment, 35 fibres/100 g of sediment, and 1 microbead/ 100 g of sediment. Lake Erie tributary
sediments had a standard deviation of ±13.1 fragments/100 g of sediment and a standard error of
±4.6 fragments/100 g of sediment. Lake Erie tributary sediments had a standard deviation of
±12.1 fibres/100 g of sediment and a standard error of ±4.3 fibres/100 g of sediment. Lake Erie
tributary sediments had a standard deviation of ±0.3 microbeads/100 g of sediment and a
standard error of ±0.1 microbeads/100 g of sediment. Flow in the tributary may have a positive
correlation with microplastics accumulation (Figure 3.6a); however, it could be inferred that
microplastics may accumulate in intermediate flow conditions. Microplastic accumulation may
have a slight positive correlation with water depth (Figure 3.6b). Flow relative to microplastic
accumulation and depth was examined (Figure 3.6c), and there was a slight positive correlation
42
Figure 3.4. (A) Number of microplastic particles recovered from Lake Erie tributary sediments, and (B) types of microplastic particles recovered from Lake Erie tributary sediments.
Sample ID RT PP 1 RT PP 2 SD PP 1 SD PP 2 GR PP 1 GR PP 2 WC PP 1 WC PP 2 M icr opla stic pa
rticles (per 10
0g sed im ent ) 0 10 20 30 40 50 60 70 (a) Sample ID RT P
P1 RT P
P2 SD
PP1 SD
PP2 GR PP 1 GR PP 2 WC PP1
WC PP2
43
Table 3.3. Summary of Lake Erie microplastic in tributary sediments.
Location Sample_ID
# Fragment /100 g sediment
# Fibre /100 g sediment
# Microbeads /100 g sediment
# Microplastics /100 g sediment Grand
River
GR PP1 10 0 0 10
GR PP2 0 0 0 0
Rondeau Inlet
RT PP1 1 ~0 0 1
RT PP2 ~0 ~0 0 1
Leamington Tributary
SD PP1 1 ~0 ~0 2
SD PP2 5 1 ~0 7
Welland Canal
WC PP1 16 35 1 52
WC PP2 38 2 0 40
Figure 3.5.Examples of microplastic particles recovered from Lake Erie tributaries. (A) microplastic fragments and a microbead in sample WC PP1, and (B) fibres from sample WC PP2.
44
Figure 3.6. Microplastics recovered from Lake Erie tributary sediments relative to (A) water flow, (B) tributary depth, and (C) depth of tributary in relation to water flow (where red = high flow, yellow = moderate flow, cyan = low flow, and blue = stagnant).
Depth (m)
0.0 0.5 1.0 1.5 2.0 2.5 3.0
M icr op last ic p art icles (per 10 0 g sed im en t) 0 10 20 30 40 50 60 (b)
Flow (m3/s)
0 20 40 60 80 100 120 140 160 180 200
M icr op last ic p art icles (per 10 0g se dim en t) 0 10 20 30 40 50 60 (a) Depth (m)
0.0 0.5 1.0 1.5 2.0 2.5 3.0