Scholarship@Western
Scholarship@Western
Electronic Thesis and Dissertation Repository
6-28-2016 12:00 AM
Evaluating Loyalty Programs with Endogenous Redemption
Evaluating Loyalty Programs with Endogenous Redemption
Mihaela Alina Nastasoiu The University of Western Ontario
Supervisor
Mark Vandenbosch
The University of Western Ontario Graduate Program in Business
A thesis submitted in partial fulfillment of the requirements for the degree in Doctor of Philosophy
© Mihaela Alina Nastasoiu 2016
Follow this and additional works at: https://ir.lib.uwo.ca/etd
Part of the Marketing Commons
Recommended Citation Recommended Citation
Nastasoiu, Mihaela Alina, "Evaluating Loyalty Programs with Endogenous Redemption" (2016). Electronic Thesis and Dissertation Repository. 3889.
https://ir.lib.uwo.ca/etd/3889
This Dissertation/Thesis is brought to you for free and open access by Scholarship@Western. It has been accepted for inclusion in Electronic Thesis and Dissertation Repository by an authorized administrator of
Evaluating the capacity of consumer loyalty programs to generate additional sales is
essen-tial for marketers who run such programs. However, customers’ self selection into the loyalty
programs makes this evaluation difficult. This is the case especially in set-ups where the reward is not granted automatically upon achieving a certain number of points. In the case of
auto-matic rewards, based on temporal discounting and the diminishing perceived distance to the
goal, marketing theory predicts that points accumulation accelerates as consumers approach
the threshold of necessary points for the reward, and is also boosted after the redemption, in
what is called ‘the rewarded behavior effect’. These mechanisms generate sales that are at-tributed solely to the reward program.
In this thesis I use these insights to develop two models for evaluating loyalty programs
where the rewards are not granted automatically, but consumers accumulate points and are free
to decide the moment and the size of the redemption. These types of programs are expanding
in sectors such as retail and finance, so being able to evaluate them becomes increasingly
important. The first model applies to programs where consumers use the accumulated points
like cash, for groceries and other day-to-day expenses, while the second applies to programs
where consumers use the points for non-ordinary expenses or treats, which on average are much
larger. Both are models of consumer behavior, which retailers need to understand in order to
learn how to improve the profitability of their loyalty programs. The difference between these two set ups is important because consumers plan for redemptions in different ways in these two contexts. I estimate the parameters of both models using data provided by AIR MILES,
Canada’s largest coalition loyalty program. I show how sample heterogeneity and the
non-random timing of the reward cash-in can be confounded with true loyalty program effects and I tease apart these effects to obtain non-biased estimates of program profitability. I use the model insights to suggest ways in which the loyalty program owner can change the program to
further boost its profitability and discuss how the recommendations are contingent on retailers’
contribution margins. The dissertation advances the literature on loyalty program evaluation by
developing structural models for set ups where retailers do not impose automatic redemptions
upon consumers.
Keywords: consumer loyalty programs, endogenous redemption, structural models, points
Abstract i
List of Figures v
List of Tables vii
List of Appendices ix
1 Introduction 1
2 Loyalty reward programs 7
2.1 The business model . . . 11
2.2 In theory, can loyalty reward programs change behavior? . . . 15
2.2.1 Switching costs . . . 17
2.2.2 Points pressure . . . 19
2.2.3 Rewarded behavior . . . 22
2.2.4 Building customer relationships . . . 24
2.3 Measuring loyalty programs’ effectiveness . . . 25
2.3.1 Experimental and quasi-experimental studies . . . 27
2.3.2 Structural studies . . . 36
2.4 Discussion . . . 39
3 A collection-redemption cycle: the ‘cash’ model 42 3.1 Theoretical model . . . 44
3.2 The data . . . 53
3.3 Empirical strategy . . . 59
3.4 Results . . . 64
3.4.1 Policy experiments . . . 75
Program evaluation . . . 75
Policy changes . . . 80
3.5 Discussion . . . 85
4 Dream rewards 88 4.1 Theoretical model . . . 90
4.1.1 An estimable model for dream reward collectors . . . 97
4.2 The data . . . 101
4.3 Empirical strategy . . . 105
4.3.1 Identification . . . 105
4.3.2 Estimation . . . 108
4.4 Results . . . 109
4.4.1 Results for a priori defined segments . . . 116
Program evaluation . . . 121
Policy Change . . . 122
4.5 Discussion . . . 125
5 Conclusion 128 5.1 Contributions . . . 128
5.2 Limitations . . . 131
5.3 Future research . . . 133
A Identification for the ‘Cash’ model in Chapter 3 137
B Interpolation for the ‘Dream’ model in Chapter 4 142
C Identification for the ‘Dream’ model in Chapter 4 144
Bibliography 147
2.1 The business model for a retailer that does not offer a loyalty program . . . 11
2.2 The business model for loyalty programs run ‘in-house’ by a single retailer . . . 13
2.3 The business model for loyalty programs run by third parties . . . 16
2.4 Stylized facts on the dynamics of loyalty points collection . . . 21
3.1 Sequence of actions . . . 50
3.2 Average collection as a function of time to/after a redemption . . . 57
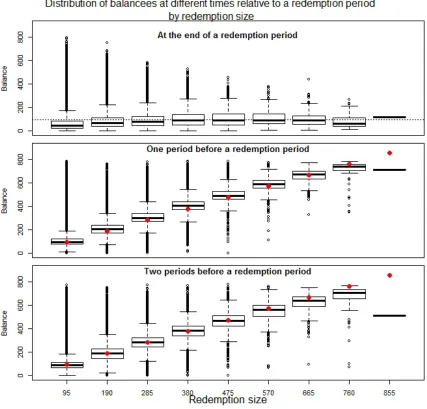
3.3 The distribution of miles balances after a redemption (top panel), one period before a redemption (middle panel) and two periods before a redemption (bot-tom panel) by the size of the redemption . . . 58
3.4 Disentangling the effects of redemption timing selection, heterogeneity, points pressure and rewarded behavior effect. . . 71
3.5 The mean utility of each redemption size from 0 to 10 for both ‘Redeemers’ and ’Non redeemers’. . . 73
3.6 Probability that different rewards are redeemed by the number of available miles. . . 73
4.1 Sequence of spells. The goal (G*) is chosen at the beginning of each spell. Effort is chosen in each period. The utility of redemption is realized at the end of the spell. . . 92
4.2 Distribution of the observed redemptions . . . 104
4.3 Observed redemptions as percentage of the stock of miles available before re-demptions (focusing on rere-demptions smaller than 10,000 miles) . . . 105
redeemed (left panel) and after a redemption (right panel) . . . 106
4.5 The number of observations used to compute the averages shown in Figure 4.4 . 107
4.6 Utilities for three different goals (395, 950 and 1900 miles) at different levels of miles available at the redemption time . . . 113
4.7 Optimal effort for a credit card holder who has the goal of redeeming 2000 miles, as a function of the available stock of miles and closeness to the
re-demption moment . . . 115
2.1 Summary: Theoretical mechanisms through which loyalty programs can affect
firm performance . . . 26
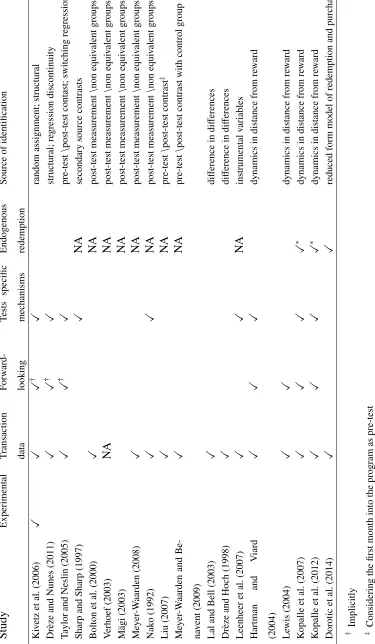
2.2 Summary: Loyalty programs - empirical work . . . 38
3.1 Summary: state and choice variables . . . 53
3.2 Summary: structural parameters . . . 54
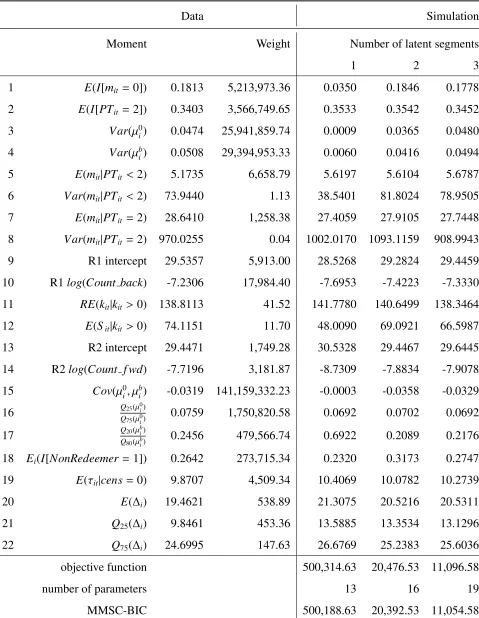
3.3 The data moments, their weights and the simulated moments under the assump-tion of 1, 2 or 3 latent segments in terms of propensity to be disengaged or to collect bonus miles . . . 65
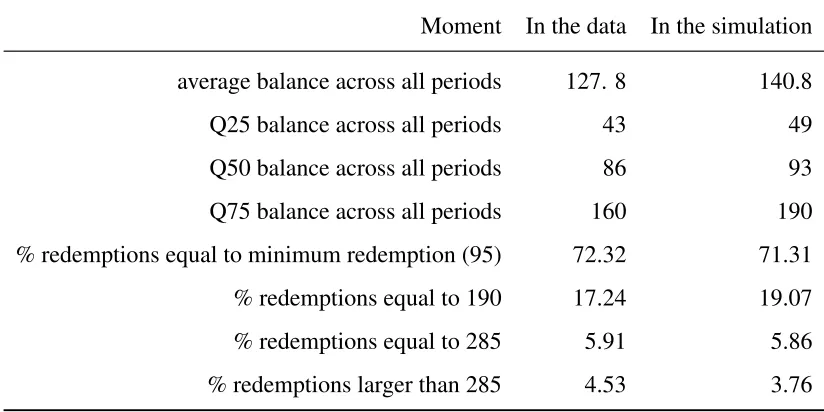
3.4 True and simulated moments not used in the estimation . . . 67
3.5 Estimated structural parameters . . . 68
3.6 Fixed parameters . . . 74
3.7 The effect of the loyalty program on each of the 6 distinct segments . . . 76
3.8 Detailed results assuming a bonus mile is associated with $.2 of sales and that 30% of the miles collected in a bonus period are regular miles . . . 80
3.9 Break-even margin as a function of revenue associated with a bonus mile and percentage of non-bonus miles collected in bonus periods . . . 81
3.10 Share of revenue generated by the program as a function of revenue associated with a bonus mile and percentage of non-bonus miles collected in bonus periods 81 3.11 Policy changes - summary of findings . . . 84
4.1 Summary of the finite-horizon problem: state and choice variables . . . 100
4.2 Summary: structural parameters . . . 101
4.3 Cleaning the Data . . . 102
attached to each moment) . . . 110
4.5 Moments that were not used in the estimation . . . 111
4.6 Point estimates and standard errors in parenthesis below . . . 112
4.7 Matched moments, i.e. the moments used in estimation (both the values
ob-served in the data (ˆθ) and the simulated values (ˆθ) together with the weight attached to each moment), separately for the ‘Bonus’, ‘Core’ and ‘Disengaged’
segments . . . 118
4.8 Moments that are not used in the estimation for the ‘Bonus’, ‘Core’ and
‘Dis-engaged’ segments . . . 119
4.9 Point estimates and standard errors in parenthesis below, separate for the ‘Bonus’,
‘Core’ and ‘Disengaged’ segments . . . 120
4.10 Program evaluation. Applying the model to the whole sample . . . 122
4.11 Program evaluation. Applying the model to each of the 3 pre-defined segments
and aggregating the results . . . 123
4.12 Program outcomes under the current set up and two alternative set ups where
the inter-redemption times are reduced . . . 124
A.1 Parameters used to generate the data . . . 138
A.2 Starting points - within+\ −two standard errors from the true parameters . . . 139 A.3 Estimated parameters . . . 140
A.4 Distance (in standard errors) of the estimated parameters form the true parameters141
C.1 Parameters used to generate the data . . . 145
C.2 Starting points - within+\ −two standard errors from the true parameters . . . 145 C.3 Estimated parameters . . . 146
C.4 Distance (in standard errors) of the estimated parameters form the true parameters146
Appendix A . . . 137
Appendix B . . . 142
Appendix C . . . 144
Introduction
Cultivating customers’ loyalty is key for any business. Besides the product’s intrinsic qualities
and promotion and advertising campaigns, one tool that companies use increasingly to build
customers’ loyalty is to offer reward programs (RPs). These programs offer consumers loyalty points (LPs) or miles proportional to their purchases (e.g. 1 mile per $10 spent) and allow
them to use the amassed LPs to redeem different types of rewards. As RPs impose costs on companies, one of the critical questions that managers need to answer is how effective the RP is in generating sales that would have not been realized in the absence of the RP.
Evaluating the effectiveness of RPs is difficult, given consumers’ self selection into the programs. Two main strategies have been followed: experimental or quasi-experimental
ap-proaches and structural apap-proaches. The first approach aims to compare RP members to
non-members (after accounting for self-selection) and draw conclusions about the overall eff ective-ness of the programs based on this comparison. Structural approaches are more analytical, in
the sense that they focus on identifying the theoretical mechanisms that make RPs effective and measuring the impact of those specific mechanisms. Points pressure (the tendency to
acceler-ate LPs collection as one approaches the redemption moment) and the rewarded behavior effect (the tendency to only gradually decrease collection after a redemption) are the prime
mecha-nisms that have been identified to enhance the effectiveness of the RPs. Chapter 2 presents in detail both the experimental and the structural approaches and reviews their strengths and
challenges. Also, this chapter presents the empirical evidence on RP’s effectiveness.
Looking back at past research in this area, it is apparent that most work is done on RPs
where the reward is pre-set by the merchant and granted automatically to participants - like the
automatic status upgrades that frequent fliers receive upon accumulating a certain number of
flown miles. However, loyalty reward programs are rapidly expanding in areas such as retail
and financial services, where the main attraction is represented by the prizes that consumers
can redeem with their LPs, not the status upgrade. In these programs consumers typically
accumulate points which they can later use either to reduce their bills or redeem rewards from a
given set offered by the company that runs the program. The time and the size of the redemption are usually entirely at consumers’ discretion.
Since the existing models are not well equipped to deal with this endogenous redemption
decision, I address this deficiency. In this thesis I propose two models that focus jointly on
how consumers collect and spend their LPs. The first model is applicable to RPs where prizes
are discounts offered to consumers on their bill (this will be called the ‘cash’ setup), while the second is applicable to RPs that offer more substantial prizes, like flights, cruises or merchan-dise (the ‘dream’ setup). The difference in the prize structure is important because it dictates how consumers think about their LPs and organize their redemptions. I argue that in the ‘cash’
setup consumers plan to accumulate and spend LPs in a continuous way; they derive utility
from the rewards they receive for their points and they permanently struggle between giving
in to the temptation of redeeming something now and hoarding points in order to be able to
make large redemptions which seem to bring more utility per mile redeemed than smaller
re-demptions. No single redemption is a goal in itself, but part of the collection-redemption cycle
that consumers pursue in order to maximize their utility. Chapter 3 presents a model of the
collection-redemption cycle that is applicable in this context. The parameters of the model are
estimated using a sample of AIR MILES cash collectors (participants who chose to use their
AIR MILES only to obtain discounts at different retailers). Based on these parameters, policy experiments are conducted to determine the sales generated exclusively due the RP and ways
in which the RP can be modified in order to further boost sales. The results show that different program set ups are optimal depending on retailers’ contribution margins.
In contrast to RPs that offer cash discounts as prizes, in the ‘dream’ setup any individual redemption stands out because it is larger in value and it usually represents a treat that is not
redemption goal), but once they form such goals (e.g., ‘I’m using my points to redeem gifts for
Christmas’ or ‘to book flights for the family’s summer holiday’), they focus entirely on that goal
and disregard goals that they might form into the future, after achieving (or failing to achieve)
the current goal. This is not to say that that consumers in the ‘dream’ setup are shortsighted,
but that they care about the future only up to a certain point - i.e., they bracket more narrowly
(Read et al., 1999). This is because each redemption is a different event in itself, while in the case of cash discounts, it is easier for consumers to think about the redemptions collectively, as
they are more homogeneous. Chapter 4 presents a model where consumers are assumed to form
specific goal redemptions and work towards attaining their goals. The parameters of this model
are estimated using a sample of AIR MILES collectors who opted to accumulate points that
can be used to purchase ‘dream rewards’ such as flights, cruises or merchandise. Similarly to
the ‘cash’ model, the estimates are used to conduct policy experiments that tease out the share
of points accumulated due solely to the program vs. the share of points corresponding to sales
that would have been attained even in the absence of the RP. Also, the estimated parameters
are used to gain insights into how the efficiency of the program would improve if AIR MILES managed to persuade the program participants to shorten their inter-redemption spells.
This thesis advances research on loyalty reward programs in several ways. First, there
are only two structural models that make the redemption moment endogenous: Kopalle et al.
(2007, 2012). These models are applicable to RPs in industries such as hospitality and travel
where consumers face the trade-offbetween redeeming rewards and amassing points in order to gain status. However, this trade-offis not present in industries such as retail or the financial sector; in these areas sacrificing a redemption in order to build balance for a status upgrade
is not a relevant consideration. So in this thesis I expand the set of models with endogenous
redemption to RPs in the retail and financial sectors, which have come to jointly account for
60% of RP memberships in the US (Berry, 2013). Furthermore, focusing on the timing of
re-demptions is important because it is rere-demptions that actually makes RPs successful, by setting
in motion mechanisms such as points pressure and the rewarded behavior effect. Unredeemed LPs can apparently make a loyalty program seem more profitable, but redemptions are the
engine that power reward programs. For most customer loyalty programs, LP issuance is a
liabil-ity is converted to cash (Konsewicz, 2007). So in the short-run, it is the redemption, not the
issuance, that improves RPs books and allows them to reduce their liabilities and enhance their
financial situation. Redemption is also important for the long run success, especially in the
case of frequent-flyer programs that sell their LPs or miles to credit card companies (The Wall
Street Journal, 2010) and coalition programs administered by a third-party such as AIR MILES,
Nectar or FlyBuys. To work, a reward loyalty program should actually reward customers.
Secondly, this is the first attempt to use a structural approach in evaluating an on-going
retail RP (as opposed to an occasional retail program such the Thanksgiving turkey program
studied by Taylor and Neslin (2005)), where consumers accumulate LPs and are free to decide
when and how many of their points to use for redeeming rewards. Given consumers’
self-selection into RPs, I believe that this is a more sound method of evaluation, compared to
quasi-experimental approaches. (Why structural approaches are more sound will become clearer later
in this dissertation.) Moreover, this method can be applied to coalition RPs, where consumers
can acquire points at dozens of sponsors in very different sectors, so finding adequate controls for a quasi-experimental investigation would be even more challenging in respect of a coalition
program. With a structural approach I am able to evaluate how strong the points pressure and
rewarded behavior effects are and back out the effectiveness of the RP from these estimates. Thirdly, I use the results of the structural models to emphasize how the sample
hetero-geneity and the fact that program participants select the timing of their redemptions can be
confounded with program effects. In other words, these two mechanisms give rise to pat-terns of collection that are similar to the patpat-terns of collection that one would expect if the RP
changes participants’ behavior. Therefore, in order to accurately determine the effect of the RP in driving sales, it is essential that these concurrent effects are isolated and teased apart. In Chapter 3 I show that failing to account for heterogeneity and the selection of the redemption
timing produces upward biased estimates of the efficiency of the program. Somewhat surpris-ingly, it appears that heterogeniety plays a less significant role in the case of ‘dream’ collectors
(Chapter 4), as the model applied on the entire, heterogeneous sample produces similar results
to a specification where I apply the model separately to 3 a priori identified segments and then
I aggregate the results.
(Chintagunta et al., 2006), by modeling fallible cognitive process such as limited foresight,
impulse purchases and fixed transaction costs for making a redemption. Theoretical models
that capture consumer thought processes are valuable because they bolster our confidence in
the results they produce and the recommendations that are based on those results. However,
these more complex models usually suffer from not being amenable to a closed from solution for estimation. I overcome this problem by relying on simulation techniques. Both models are
estimated through indirect inference (Gourieroux et al., 1993; Smith, 2008), a class of GMM
estimators (Hansen, 1982), where the parameters of the structural model are pinned down by
matching selected moments observed in the data to the corresponding moments of a simulated
data set. My models are therefore an excellent managerial tool for evaluating retail RPs and
testing different ideas on how these RPs can be improved. The model can be used in deciding, for example whether the amount of rewards given out for a given amount of points accumulated
should be increased or decreased.
The next chapter presents the existing work on loyalty programs, differentiating the wider concept of customer loyalty from the ‘engineered’ loyalty that RPs aim to create. In this
lit-erature review, I focus both on the theoretical mechanisms through which RPs can increase
sales as well as on the empirical findings so far, emphasizing the different approaches of exper-imental, quasi-experimental and structural approaches. Chapters 3 and 4 present two distinct
models of LPs acquisition and redemption. The main difference between the two models is the set ups in which they apply. Chapter 3 is suitable to analyze RPs where the rewards are small,
in-store discounts and, conditional on having enough LPs for a reward, consumers decide in
every period whether they cash in points. In contrast, Chapter 4 is suitable to analyze RPs
that offer more significant rewards - like flights or hotel stays. In these programs, consumers are assumed to form stable redemption goals and work towards attaining their goals. Both
chapters start by exposing the theoretical models, presenting the data used to estimate them
and then presenting the estimated parameters. I assess the implications for the break-even
mar-gin (the marmar-gin above which running a RP contributes positively to retailers’ profits) and the
share of sales attributable to the program. Furthermore, the estimated parameters are used to
conduct ‘what-if’ analysis (also called counterfactuals) - that is evaluate how profitable the
amount of rewards per mile redeemed). Chapter 5 re-iterates the differences between the mod-els presented in Chapters 3 and 4 and elaborates on the reasons for which the ‘dream’ rewards
program appears to be more profitable than the ‘cash’ rewards program. In this chapter I also
re-state the contribution to the field of loyalty programs that I make in this dissertation and I
Loyalty reward programs
Loyal customers are an asset for any company or brand. As intuition would suggest that,
all else equal, more loyal customers are less likely to be swayed by competition’s attractive
offers, more likely to spread positive word-of-mouth, more forgiving, and also more likely to pay higher prices for the product/ brand towards which they are loyal. It is no surprise then that loyalty occupies such a central place both in academic marketing research, as will
become apparent in the literature review that I am conducting, as well as on the agenda of
many practitioners (O’Brien and Jones, 1995; Reichheld, 1996).
A literature review conducted by Jacoby and Chestnut (1978) covering more than 50 years
of research (1923-1976) reveals that early attempts to operationalize the concept of brand
loy-alty focused almost exclusively on behavioral measures such as share of purchases or sequence
of purchases. However, in the 60’s, researchers started to suggest that besides the behavioral
component, brand loyalty should also include attitudinal measures that tap into consumers’
commitment to the brand. Day (1969) and Dick and Basu (1994) clearly argue that, besides the
behavioral aspect of repeated purchase, the customer loyalty construct should also comprise
an attitudinal element; thus true loyalty exists wherever there is both repeat patronage and
highly positive attitude for the focal brand relative to other brands. Chaudhuri and Holbrook
(2001) also explicitly differentiate between purchase loyalty and attitudinal loyalty, both types of loyalty stemming from brand affect and brand trust. More recently Liu-Thompkins and Tam (2013) differentiate between attitudinal loyalty and habit.
However, adding the attitudinal measure to the concept of brand loyalty doesn’t conclude
the discussion around it. Positive attitudes towards brands can stem from their intrinsic
qual-ities or from the marketing programs that surround them. Researchers in this area have been
careful to emphasize the concept’s property of being different from brand qualities relative to competition or contextual factors, such as lack of alternatives (Day, 1969; Aaker, 1991; Dick
and Basu, 1994; Oliver, 1999). For example, Oliver (1999) defines loyalty as ’a deeply held
commitment to rebuy or repatronize a preferred product/ service in the future (...) despite
situational influences and marketing efforts having the potential to cause switching behavior’. Lemon et al. (2001) provide what I think is the most clean and rigorous definition of
loy-alty. For them programs meant to develop customer loyalty contribute to customer relationship
equity which they define as ‘the tendency of the customer to stick with the brand,above and
beyond customers’ objectiveand subjectiveassessment of the brand’ (emphasis added). Thus,
in this definition, even emotional ties that customers have with a certain product or brand, or
the attitudes they have towards it (the subjective assessment) are separated from brand
loy-alty, which is thus conceptualized as a ‘stickiness’ of the relationship that cannot be explained
either by the value proposition of the brand (the more objective attributes) or by consumers’
emotional ties to the brand. This contrasts with Day (1969)’s tentative conclusion that ‘loyalty
is based on a rational decision made after the evaluation of the benefits of competing brands’
which is later reinforced by the observation that ‘commitment is never total, the decision is
reviewed when competitive or other circumstances change’.
If the early literature in this area, as outlined so far, was more concerned to clarify
con-ceptually what customer loyalty is, recently the literature seems to have agreed on a definition
of loyalty that is closely aligned to the one provided by Lemon et al. (2001). This refinement
of the concept has evolved in step with the proliferation of loyalty programs offered by com-panies for their customers. Through these programs comcom-panies try to enhance and prolong
the relationship with their consumers. Customers acquire points (sometimes called miles after
the successful programs launched in the American airline industry) based on the amounts they
spend with the company. As they collect enough points, consumers can then use them as a sort
refer purely to the stickiness of the relationship, which gives a one to one relationship between
this concept and loyalty programs.
The questions that both academics and managers are now interested in, is whether, and
how, these sort of programs bring value to the brand. In other words the interest lies in
un-tangling between, on the one hand, the equity that is generated through the brand’s objective
qualities or through the emotional ties it fosters with consumers, and on the other hand, by the
loyalty program. The shift can be easily noticed in the managerial recommendations that the
academic loyalty literature provides. Early papers emphasized the role of loyalty antecedents
such as trust, relational benefits and value (Sirdeshmukh et al., 2002) trust and brand affect (Chaudhuri and Holbrook, 2001), cognitive antecedents (accessibility, confidence, etc.), aff ec-tive antecedents (emotion, satisfaction etc.) and conaec-tive antecedents (switching cost, sunk
cost and expectations) (Dick and Basu, 1994) or quality and perceived associations (Aaker,
1991). These authors follow a logic where these antecedents lead (somewhat mechanically)
to loyalty which in turn leads to outcomes of interest (market share, willingness to pay, word
of mouth, etc.). The focus on these antecedents of loyalty seems to be in contradiction with
the definition provided, which emphasized its property of being different from brand intrinsic subjective or objective qualities as assessed by consumers. Loyalty seems to be rather the
out-come of good subjective and objective value provided by the company and not something that
can be fostered exogenously. In contrast, more recent articles focus on evaluating the return of
programs that that are strictly meant to increase loyalty, independently of programs meant to
increase the objective value provided by the brand or the emotional response it generates (Rust
et al., 2004).
In this research, I adopt a view similar to that of Lemon et al. (2001); Rust et al. (2004) and
refer to loyalty as a mechanism that leads to re-purchase or re-patronizing above and beyond
product quality or favorable emotional ties to the product. Specifically, I am interested in
loyalty as a cause of brand or firm superior performance, not as its effect (Reichheld, 1996). I do not contest the fact that product quality or its capacity to generate positive attitudes are
important drivers of commitment towards, and re-purchase of the product, and that these drivers
can create what in lay terms would be called ‘loyalty’. But in this research I am interested in
a different managerial lever. Therefore, I study loyalty programs that reward consumers based on the volume of the previous purchase and have the capacity to create sunk and switching costs
for consumers. This sort of programs may create repeated purchases, or loyalty, the mechanism
being completely orthogonal to product quality and advertising strategy.
In contrast to Kumar and Shah (2004), who are interested in developing programs that
‘pro-actively reward customers “today” for their “future” shopping’, I am specifically interested in
programs that try to change current behavior by offering future rewards. In order to follow Kumar and Shah (2004)’s suggestion companies would need to know who the customers with
high future shopping are, so that it can reward them. But if those customers are highly likely
to patronize the company in the future, why reward them? By rewarding them there is a risk of
creating a ceiling effect where their purchases cannot be further increased instead of offering incentives to those customers who under the current state of affairs are not likely to buy that much into the future, but who can be easily persuaded to change their purchase patterns by
offering them a reward? My emphasis on RPs as amanagerial toolstrongly favors the second approach.
The history of modern loyalty (or frequency reward) programs can be traced back to the
trade stamps (Davis, 1959), that have been used by retailers as a means of increasing customers’
loyalty since the beginning of the 20thcentury. In the 80’s, this business model was adopted by
airlines in their frequent flyer programs and financial service and credit card companies; with
the advent of scanners in retailing and services, LPs have become common in hotel chains, car
rental companies, supermarkets, music and chemist stores (Financial Times, 2006). A recent
study (Nielsen, 2013), which surveyed 29,000 Internet respondents in 58 countries, revealed
that almost 60% said that loyalty programs were available where they shopped; 84% of these
reported that they are more likely to visit those retailers. The wide spread of such loyalty
programs warrants a special focus on them.
The next subsection presents the business model for loyalty programs, distinguishing
be-tween LPs that re run by a third party and those that are run ‘in-house’ by a single retailer.
The next two subsections present and systematize the research on loyalty programs: section
Retailer
Consumers
$
goods
&
services
Figure 2.1: The business model for a retailer that does not offer a loyalty program
2.1
The business model
In this subsection I explain how loyalty programs work. I build the exposition from the simple
case of a single vendor with no LP to the most complex one of an LP run by a third party. A
merchant who does not use a loyalty program makes their profit from the difference between the sales they generate and their costs - the cost of goods sold and any other administrative and
selling costs they may incur. This case is presented in Figure 2.1.
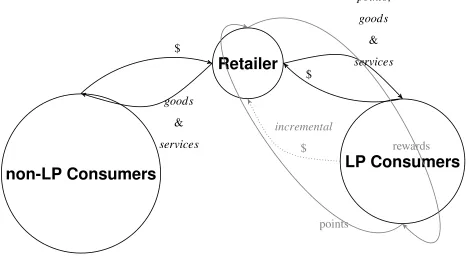
In Figure 2.2, I look at the set-up where the retailer runs an ‘in-house’ LP. In this set-up,
consumers purchase goods and services from retailers and pay for them with money, exactly
as in the previous case. But now, the retailer awards consumers with loyalty program points,
usually proportional with the amount of money they spend. Some customers sign up for the
LP program, some don’t. For those who don’t sign up for the program the business model is
the same as the one presented in Figure 2.1. In Figure 2.2, they are the non-LP consumers in
The consumers who sign up for the program (the LP consumers on the right side in Figure
2.2) now receive points for the goods and services they purchase. For example, a Shoppers
Drug Mart customer who spends $42 in store, receives 420 points (according to the rule that
each dollar spent by the consumer is rewarded with 10 points). In offering these rewards, the retailer hopes that the quantity of goods and services purchased will increase compared to the
scenario without LP (Figure 2.1). This uncertain additional spending is captured in Figure 2.2
by the dotted line labeledincremental $. I used the dotted line precisely to emphasize that when
offering an LP, retailers cannot know for sure that the LP will generate incremental sales, or that the margin on the incremental sales is large enough to cover the cost of the LP program. Once
consumers have accumulated enough points, they redeem these points for rewards (the gray
full arrows in Figure 2.2. A redemption means that consumers’ balance of points is decreased
and they receive a reward in exchange. The reward can be an in-store discount or a gift that
the consumer chooses. The retailer’s profit from the loyalty program is the margin from the
incremental salesdue to the loyalty program minus the cost of running the LP. In turn, the cost
of running the LP is given by the sum between the cost of the rewards and the administrative
cost of running the loyalty program. The total profit is the profit from the loyalty program plus
the profit as calculated for the retailer in the case of no loyalty program, as described in the
previous paragraph.
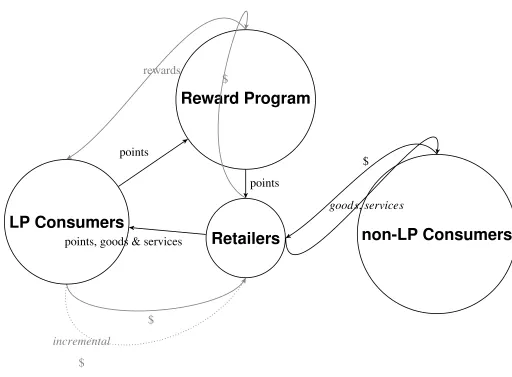
Figure 2.3 shows the more complex case where the loyalty program is administered by a
third party. This third party issues the loyalty points, and sells them to the retailers. Like in the
previous set-up, the retailers award the miles to the consumers who participate in the loyalty
program, proportional with the amount of money that the consumers spend to acquire goods
and services from the retailers. As in the case of the in-house LP, retailers hope that the points
they award will generate incremental sales (captured in Figure 2.3 bu the dotted gray line).
Once the consumers have accumulated enough points, they go the party that issued the
loyalty points (the Reward Program, as labeled in the figure) and trade their points for rewards.
Note that the rewards can be of broad types. The Reward Program can procure them either
from the same retailers to which it sells the points, either from other vendors, but this choice
is not consequential for the models that I am developing, so this this part of the chain is not
Retailer
LP Consumers
non-LP Consumers
$
points, goods
&
services
incremental
$
$
goods
&
services
points
rewards
it receives from the retailers for the points it sells minus the sum of the cost of the rewards and
administration costs. For example if the Reward Program retailers 12 cents for each loyalty
point and the average cost of rewards is 9 cents, the contribution per point for the Reward
Program is 3 cents.
Beyond this hypothetical example, it is difficult to know how profitable third party admin-istered programs are, mainly because these programs are run by larger companies, that also run
marketing analytics and retail solutions divisions and who report their consolidated earnings
and profits. For example, in Canada, AIR MILES is the largest third-party run loyalty
pro-gram. But the program is run by LoyaltyOne, which according to Hoover’s1reported earnings
of $44 million. Other third-party run programs are Aeroplan (in Canada) and Nectar (in the
UK and Italy). Both these programs are run by Aimia which reported revenues of almost $600
million2. These numbers, while not specific for the LP divisions, still suggest that there is a
thriving market for third-party run LPs.
In the case where the program is run by a third party the retailers no longer incur a direct
cost of the reward program (the administrative expenses and the cost of the rewards), but they
simply pay for the loyalty points they hand out to their customers. Retailers’ profit from the
loyalty programis given by the difference between the margin from the incremental sales due to the loyalty program and the cost of the points. For example if a certain retailer gives out
on average 10,000 loyalty points per day, the retailer’s LP cost is $1,200 per day. If the LP
generates incremental sales of say 5,000 per day and the margin on those sales is 30%, then
the daily profit from the LP for the retailer $300 (30%*$5,000-$1,200). Retailers’ total profit
is the profit from the loyalty program plus the profit as calculated for the retailer in the case of
no loyalty program, as described in the case of Figure 2.1.
So far I have used the termprofit from the loyalty program. However, it is not clear whether,
or to what extent loyalty programs are profitable. This is actually the question that I am trying
to answer in this dissertation. While the costs of the LP are easily observable and measurable,
theincremental salescannot be directly measured. If the margin from the incremental sales is
1htt p : //www.hoovers.com/company−in f ormation/company−search.html?term = loyaltyoneaccessed July 28th 2016
2htt ps://www.aimia.com/content/dam/aimiawebsite/f inancial reports/2016/First%20Quarter/AI MIA Q1%202016 Highlights FINAL.pd f
less than the cost of the program, then there will be aloss from the loyalty program.
The two models that I am proposing in this dissertation can be applied to both set-ups
described in Figures 2.2 and 2.3. Since I am interested in how the rewards influence the
con-sumers’ purchase patterns, whether the program is administered in house by the retailer, or run
by a third party, is, in itself, irrelevant for how the model plays out.
2.2
In theory, can loyalty reward programs change
behav-ior?
A loyalty program is considered successful when it generates sales that otherwise would have
not been realized and when the cost of generating these sales doesn’t exceed the additional
profit that is garnered. This relatively simple definition of success however does not
engen-der an equally simple operationalization. The main difficulty, especially with secondary data provided by loyalty programs, is, as in all social sciences that try to gauge causal effects of different programs or polices (Imbens and Wooldridge, 2009), assessing the counterfactual, i.e., assessing how much consumers would have purchased from the focal firm in the absence
of the loyalty program. Given that consumers cannot be randomly placed in conditions that
either enroll or don’t enroll them in a loyalty program, self-selection is always a concern in
empirical studies that try to draw conclusions about the efficacy of a loyalty program based on comparisons between members and non-members.
In this review I will discuss how previous research has tried to circumvent this problem. But
before moving in this direction I will discuss some theoretical reasons that previous researchers
have put forth either to support or to argue against loyalty programs. First of all, reward loyalty
programs are built on the idea that by promising and eventually offering rewards to customers whose purchases from the target company are over a certain threshold, or making the reward
contingent on the amount spent, companies transform a spot market to a multi-period market
where consumers take into account not only the present but also the future (Beggs and
Klem-perer, 1992; Dowling and Uncles, 1997). This change can alter consumers’ decision process
Reward Program
Retailers
LP Consumers
non-LP Consumers
points
points, goods & services points
rewards
$
incremental
$
$
goods,services
$
the program and also increase retention.
2.2.1
Switching costs
Loyalty programs have the ability to lock in consumers into a relationship and thus prevent
them from switching to a competitor. The idea here is that once a consumer has already
accu-mulated a number of points that can be used to obtain a reward from a certain competitor in the
market, switching away from that competitor may entail the loss of the already accumulated
points.
In the two-period theoretical model presented by Kim et al. (2001) the heavy users (i.e.
those who consume the product in both periods) do not switch providers in the second period
because they don’t want to lose the reward offered to those who buy in two consequent periods from the same provider. However, Hartman and Viard (2004), point to the fact that two-period
models overstate switching costs. In a two-period model the switching cost is equal to the
reward value, but in a multi-period consumers can redeem a reward in any of the many future
periods, so failing to re-patronize the target retailer in a certain period does not necessarily
thwart consumers’ chances of gaining the reward.
To the extent that they generate switching costs, loyalty programs have a potential to lock-in
consumers in a relationship with a provider even in a model where consumers realize that firms
have an incentive to increase prices in the second period precisely because of the switching
costs. Based on an analytic model, Kim et al. (2001) find that in most cases, in a duopoly,
firms are better offwith than without a reward program. The same conclusion is drawn in a model where two firms compete in an infinite number of periods (Beggs and Klemperer, 1992).
However, Dowling and Uncles (1997) notice that in the cases of the British grocery market and
the American air carriers, after the competitors started introducing loyalty programs, market
shares remained steady; even more germane is the observation that in Britain, Asda, the only
chain not offering a loyalty program among the top 4, was the fastest growing one (Passingham, 1999). This may appear to contradict the theoretical findings exposed above, but in the absence
Kopalle and Neslin (2003) suggest that the major airlines introduced reward programs to
counteract a stronger outside category - i.e. low-cost new entrants that were allowed to enter
the market after the 1978 Airline Deregulation Act. This idea is derived from their analytical
model which shows that when competitors have a potential to expand the market, they are
better offby offering reward programs. Also, in another analytic model of two retailers located on a Hotelling line, Lal and Bell (2003) show that when only one of the competitors (or both)
introduces a frequent shopper program, customers’ cherry picking is reduced or eliminated and
the profits of both competitors are increased relative to the situation where no retailer offers a loyalty program. However, their analytic model shows that with heterogeneous consumers,
competing loyalty programs do not always result in higher profits.
In markets where competitors offer more or less similar or homogeneous products, loyalty programs act as a tool that help to create differentiation, which in turn makes demand more inelastic and thus can give rise to a non cooperative equilibrium that looks like a collusive
equilibrium (Klemperer, 1987). However, the incentives that companies offer to consumers in the early stages, in the hope that this initial commitment will keep them captive in the later
stages, increase competition and may leave firms worse-offthan in a world without reward pro-grams (Klemperer, 1987). The extra-returns anticipated from the loyalty propro-grams may never
materialize or be dwarfed by the costs. Authors who are pessimistic abut loyalty programs’
value and the likelihood that they increase profitability (Dowling and Uncles, 1997; Shugan,
2005) put more emphasis on these costs rather than on the uncertain and difficult to measure benefits; in this sense reward programs are seen as producing liabilities that are not
compen-sated by the increase in purchases. Dowling and Uncles (1997) argue that such programs are
easy-to-replicate ad-ons (i.e. they don’t provide durable differentiation), especially those pro-grams with non relation specific benefits (Deighton, 2000), that can be easily emulated by
competition. Moreover, these programs, by offering delayed rewards, do not even create such a strong responses as an immediate reward that is given to consumers through a price cut
(Dowl-ing and Uncles, 1997). This observation is qualified by the find(Dowl-ings of Zhang et al. (2000). In
comparing immediate versus delayed rewards (or front-loaded vs. real-loaded promotion), they
find that the latter generate higher profits in a market where consumers seek variety, because in
subsidy, while rear-loaded promotions retain customers that would have otherwise switched.
2.2.2
Points pressure
Blattberg and Neslin (2008) suggest that there are three specific mechanisms through which
firms can use loyalty programs to increase sales: points pressure, rewarded behavior and
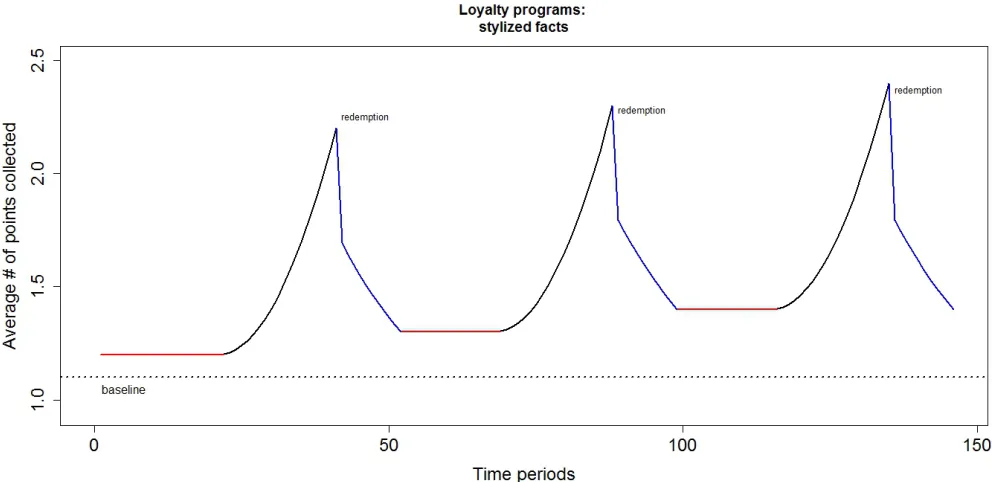
per-sonalized marketing. In this subsection I am focusing on the first one, which is best illustrated
in Figure 2.4 through the black ascending portions that lead to redemption. Additionally, this
figure illustrates the rewarded behavior mechanism, which is explained in section 2.2.3.
In this figure the X axis shows the time periods and Y axis the number of loyalty points
collected per period. There are spikes in collection in the periods right before a redemption
takes place. This pattern can be explained by future discounting. For example, if someone
needs 1,000 points to redeem a reward, and is in a situation where they have only 10 points
into their account, exerting some effort to collect more points doesn’t pay offbecause the cost of the effort is immediate, while the reward is obtained with delay, when enough points will be accumulated. The discounted reward is simply not large enough to compensate for the cost of
effort. However, if the same person is in a situation where they already have, say, 950 points into their account, a small effort to expedite the moment when one can claim the 1000 points worth prize, seems justified. Consequently consumers will accelerate collection as they near
the requirements for a reward (the black portions of the line in the figure).
The idea of cost of effort behind the points pressure mechanism is perfectly aligned with the definition of loyalty programs that stresses the fact that they can driveadditionalsales beyond
those driven by product qualities, be they objective and measurable or subjective emotions
felt by consumers for that product. Without any loyalty program, consumers choose products
that they find the best based on their own criteria and goals (Bettman et al., 1981). The loyalty
program alters these decision criteria. The additional sales generated by the loyalty program are
obtained at the expense of other products or by encouraging consumers to purchase something
that they would have not necessarily purchased. Therefore they represent departures from the
isn’t to say that consumers who incur these costs are overall worse-off. They accept to incur the costs precisely because they are compensated by the reward.
Kivetz et al. (2006) depart from the strictly calculative arguments (current effort vs. dis-counted reward) and rely on the research in the behaviorist and motivation literatures to build
a goal distance model that explains the acceleration in collection through the fact that
achieve-ment motivation increases with smaller goal distance. They call this idea the goal gradient
hypothesis. This explanation doesn’t contradict the first account, but rather emphasizes the
fact that what matters is the perceived, rather than the real progress towards the goal.
Dorotic et al. (2014) propose a new mechanism related to points pressure which they call
re-demption momentum. In their conceptualization redemption momentum motivates consumers
to collect more points in the periods leading to redemption even when consumers aim to make
a redemption for which they already have the sufficient number of points. In my models I do not specifically refer to this effect, but I capture it in two ways: 1) by allowing consumers to have uncertainty around the size of the redemption that they will make (Chapter 3) and 2) by
allowing consumers to be forward looking: after any given redemption the program
partici-pants are likely to extract more utility from future redemptions when they are left with a higher
balance which allows them to make higher redemptions in the future (Chapters 3 and 4).
The points pressure and the switching costs are closely related mechanisms. Both effects increase as the consumers approach the requirements that qualify them for the reward. They
both express the idea that RP entrenchment happens progressively: at low levels of
accumu-lated points the program is less relevant in altering choice than at high level of accumuaccumu-lated
points. One difference between these two constructs can be understood in terms of continuity. With switching costs, the focus is on the discrete choice of whether to buy or not from the focal
retailer that offers the RP; with points pressure the focus is on how much to buy from the focal retailer.
The other, more important difference between switching costs and points pressure stems only from their optics on competition. Switching costs clearly emphasize the idea of a
Figure 2.4: Stylized facts on the dynamics of loyalty points collection
offer the RP. In contrast, the points pressure mechanism may be exerted even in the absence of a competitor; additional sales realized by the firm offering the program may stem either from gain share from competition, from advancing future purchases or from, category expansion,
the mechanism being agnostic with respect to which of these sources is at play.
The distinction between different sources of additional sales becomes important in the an-alytic model of Kopalle and Neslin (2003). In an environment with two competitors and one
outside option, they find that RPs are more likely to be adopted when the category is highly
expandable (i.e. when consumers have a high utility from the outside good). The logic is that
when the outside option is unattractive (the market is served at full potential), if a company
introduces a PR, most of the additional sales come from competition, which thus has an
incen-tive to respond and wash away any benefits. In contrast, when the market is expandable, by
introducing an RP, a company is less likely ruffle its competitor; both can enjoy higher profits by introducing RPs and expanding the market.
Finally, besides switching costs and points pressure another related mechanism which can
or effortless switching. For example if a consumer is indifferent between the product or retailer which offers the reward and another product or retailer that doesn’t adopt such a program, before the introduction of the program the consumer might choose randomly between the two.
After the introduction he or she only buys from the provider with the RP without making
any sacrifice. While this effect may be significant, unfortunately without data on individual purchases at all competitors both before and after the introduction of the reward program, it
cannot be identified. In Figure 2.4 this effect is represented by the difference between the dotted line (the baseline) and the leftmost red line.
2.2.3
Rewarded behavior
The second mechanism emphasized by Blattberg and Neslin (2008) - rewarded behavior - is
illustrated in Figure 2.4 through increased collection rates after the redemption moment (the
blue portions): the drop from the pre-redemption highest point is not sudden and then the
collection flattens out a level that is superior to the previous level. This effect follows from be-havioral learning theory which states that ‘behavior that is positively reinforced is more likely
to recur’ (Rothschild and Gaidis, 1981). Simply put, the reward obtained by consumers
repre-sent anunconditioned stimulus- something that that generates positive feelings and is desired
in itself. The product or brand that offers the reward is theconditioned stimulusthat, through its association with the unconditioned stimulus elicits the same positive feelings (Blattberg
and Neslin, 1990, p. 22). This association becomes more apparent after a redemption, so the
post-redemption increased collection stems from the goodwill that is projected over the brand
through its association with the reward.
This theory, inspired by classical conditioning seems to denude human decision making of
any higher order motivation or cognition, relegating it ‘to the same level as pigeons pecking
levers to obtain their food’ (Blattberg and Neslin, 1990, p. 27). While this critique seems
valid, Blattberg and Neslin (1990) argue that there is little cognitive activity in low-involvement
decision making, so in these type of situations consumers can indeed become susceptible to
behavioral conditioning.
provided by Dr`eze and Nunes (2011). They argue that being able to achieve challenging goals
(for example earning enough miles to be eligible for superior status tier in an airline frequent
flyer program), ‘can lead to self-learning, resulting in an enhanced sense of proficiency’ (p.270)
which, in turn, leads to an increased base level of effort.
While both the rewarded behavior (Blattberg and Neslin, 1990) and the partial post-reward
reset hypotheses (Dr`eze and Nunes, 2011) aim to explain the post-redemption increased
ef-forts towards collection, their specific predictions are different. First, the rewarded behavior mechanism seems more likely to be applicable for rewards that are smaller in size, where
con-sumers are not highly involved either with the category, the product or the reward. In contrast,
the partial post-reward reset seems more fitted for high-involvement categories. Secondly,
while the rewarded behavior hypothesis predicts a gradual decrease in effort after redemption, as the association between the conditional and unconditional stimuli starts to fade away, (the
blue portions in figure 2.4) the partial post-reward reset predicts that after a successful goal
achievement, the baseline collection is higher than the baseline collection before the reward
was achieved (the difference between the red segments in figure 2.4).
Finally, the rewarded behavior effect can also manifest through the reciprocity norm (Ku-mar and Shah, 2004) - customers feeling that they need to make up to the company for the
reward they have received.
Even though the continuous line in Figure 2.4 shows points collected, it is easily apparent
that sales follow the same pattern. All the departures from the dotted baseline represent thus
sales that would have not been realized in the absence of the loyalty program. In my models
I will focus on the points pressure and rewarded behavior mechanisms, since the impact of
effortless switching can only be evaluated in contexts where consumers’ purchase patterns are available across competitors both before and after the introduction of the RP. But before I
con-clude this section on the theoretical mechanisms through which customer reward programs can
benefit companies, in the next subsection I discuss the third mechanism proposed by Blattberg
2.2.4
Building customer relationships
The last mechanism through which loyalty programs can increase sales of the three described
by Blattberg and Neslin (2008) refers to the provision of personalized marketing. This
mech-anism comprises actions like targeted promotions, cross-selling or personalized customer
ser-vice to meet individual customers’ needs better (Sopanen, 1996). When marketers have access
to customer’s purchase patterns, they can provide them private offers, that aren’t visible to competitors (‘stealth marketing’) and thus can’t be easily copied (Deighton, 2000; Kumar and
Shah, 2004).
It seems that this mechanism is in the early stages of theoretical development as the
cur-rent theory can’t answer specific questions such as ‘how should targeted promotions be
im-plemented in order to maximize revenues?’ or ‘how can personalized marketing be used to
stimulate cross-selling better than traditional methods?’. So far the answers have been vague,
such as ‘the answer lies in sophisticated data collection and analytical techniques’ (Kumar and
Shah, 2004).
Another theoretical argument for loyalty programs is that they allow companies to collect
large amounts of data on their customers, which they can subsequently use to better analyze
and diagnose their market and eventually implement changes that would increase their
prof-itability. According to Deighton (2000), retailers can sell the data collected from their shoppers
to manufacturers, who can thus contact specific buyers with targeted offers.
However, this data is only partial; it doesn’t allow us to observe purchases from competitors
and moreover is made up of self-selected customers (Dowling and Uncles, 1997; Passingham,
1999) so the data may not be representative. While these draw backs are not fatal, it is worth
mentioning that the data collected through a loyalty program can’t be relied on as the only
source of market intelligence (Kohli and Jaworski, 1990).
Those loyalty programs that assign customers to tiers can make them feel special by
as-signing them to an elite tier, that provides improved service to the customer, but doesn’t cost
the company too much - for example priority boarding in the airline industry or annual
ex-penditure reports for heavy users of credit cards (Deighton, 2000). Experimental research by
more satisfying to all involved than a two-tier program (gold and no status). However, whether
the preference that respondents have shown for three-tier programs is translated into
behav-ioral measures (such as incidence of re-purchase) remains a still unaddressed question. Also,
RPs may induce consumers ‘a feeling of participation, the anticipation of future rewards, and
a sense of belonging’ (Dowling and Uncles, 1997), but how these benefits translate in sales is
again an under-research area.
Thus, from a theoretical point of view, loyalty programs can bring value to companies
through several mechanisms as summarized in Table 2.1. However, for most of these
mech-anisms, there are factors that impinge on their effectiveness. Given that strong theoretical arguments have been laid both for and against the effectiveness of loyalty programs, next, I will review the empirical evidence.
2.3
Measuring loyalty programs’ e
ff
ectiveness
In this subsection, I review empirical studies that try to asses the effects of loyalty programs on outcomes of interest such as purchases (defined either in absolute value per period of time or
as share of wallet) or retention. I focus on studies that measure this impact either by observing
transaction data or consumer diaries and exclude those that rely solely on survey data
(Liber-man, 1999). Also, I exclude those that focus on estimating brand loyalty rather than its effect on other outcomes (Che and Seetharaman, 2009), as well as those studies that focus on other
aspects of loyalty programs, such as speed of adoption (Allaway et al., 2003).
Two main approaches have been used in order to identify such effects: experimental or quasi-experimental and structural. In the first type of approach, the main challenge is finding
the appropriate counter factual, or the appropriate comparison term against which to
evalu-ate the changes observed with a loyalty program treatment (Heckman et al., 1999).
Experi-mental studies with random assignment are considered best at illuminating causal inference
(Shadish et al., 2002, p.18), but having customers randomly assigned to either loyalty program
or non-loyalty program regime is not how companies run their businesses, so my review of the
literature revealed just two such field experiments. Moreover, as I will show, even random
Positive effects Negative effects or weaknesses of the posi-tive effects
•create switching costs for consumers(Beggs
and Klemperer, 1992; Kim et al., 2001)
• the incentives provided are costly(Dowling
and Uncles, 1997; Shugan, 2005)
•create differentiation(Klemperer, 1987) • this differentiation is easily replicated (Dowling and Uncles, 1997)
• points pressure effect (Blattberg and Neslin, 2008; Kivetz et al., 2006)
•points pressure sets in motion only at high
levels of accumulated points(Dowling and
Un-cles, 1997)
•rewarded behavior effect(Blattberg and Nes-lin, 2008)
• partial post-reward resetting (Dr`eze and
Nunes, 2011)
•possibility of personalized marketing
(Blat-tberg and Neslin, 2008)
•make data collection easy (Dowling and
Un-cles, 1997)
•gathered data is limited(Dowling and Uncles,
1997)
• customer tiers can make customers feel
special(Dr`eze and Nunes, 2009)
•may not translate into increased purchases
• the anticipation of future rewards and a
sense of belonging(Dowling and Uncles, 1997)
•may not translate into increased purchases
Table 2.1: Summary: Theoretical mechanisms through which loyalty programs can affect firm performance
require even stronger assumptions that allow one to interpret the differences between the con-trol and the treatment group as attributable to the loyalty reward program. Quasi-experimental
approaches may appear to be interested only in the overall results, by trying to assess whether
non-RP regime in different theoretically driven contexts (why measure something unless having an
aprioriexpectation, or an expectation deducted from some theory?), this approach implicitly
builds in theory in its development.
The second approach (structural modeling) places more accent up front on the process,
or the theoretical mechanisms outlined in section 2.2. This approach prioritizes theory
(typ-ically derived from an optimizing behavior) as the guiding source for empirical specification
(Chintagunta et al., 2006). While these models have been criticized for relying on numerous
assumptions, their defenders (Keane, 2010) argue that data cannot simply ‘speak’ and
assump-tions are always necessary in order to learn anything from the data (Shugan, 2005). Moreover,
the data itself cannot speak on unobservable constructs that only exist in theory. Here Keane
(2010) lists concepts such as the opportunity cost of time; for loyalty programs such constructs
would be reward valuation, switching cost or cost of effort to increase loyalty points collection. It is important to note that the division between the two approaches is not as clear cut as the
short descriptions above may seem to imply. As I will underline in the literature review, some
studies exhibit the features of both approaches, with the advantage that the obtained results
are more robust. In addition, both approaches agree on the necessity of being clear on the
assumptions that allow inferring causal effects of the RPs and conducting sensitivity analysis to see how results change with changes in assumptions and on the necessity of running
out-of-sample validations.
2.3.1
Experimental and quasi-experimental studies
In two field experiments Kivetz et al. (2006) were able to assign participants randomly to either
a loyalty program or non-loyalty program condition. Both studies involved a campus caf´e. In
the first study, willing participants were randomly assigned to either a ‘reward program’ or a
‘purchase-habit’ condition. Participants in the first condition were given cards that allowed
collecting stamps with the purchase date on 10 purchase occasions. After completing the 10
card at the end of the observation period, no matter how many stamps they collected.
In line with the points pressure hypothesis, the authors found that participants in the ‘reward
program’ condition showed decreased inter-purchase times as they approached the goal (i.e.
the 10th purchase). In contrast, those in the ‘purchase-habit’ condition showed deceleration,
i.e. the inter-purchase times in their case increased as they approached the completion of the
card. Kivetz et al. (2006) were able to rule out alternative explanations such as time effects by using controls, or habituation, by analyzing the data of respondents in the‘reward program’
condition who after receiving the first reward, were reengaged in the program for a second
reward. These participants showed longer inter-purchase times at the beginning of their second
streak than at the end of their first streak.
What makes this design robust is fact that the effect of the program is emphasized though a difference-in-differences approach: inter-purchase times when far vs. close to the goal between the randomly assigned treatment and control conditions. The authors thus don’t rely solely on
comparing the treated to the non-treated (the experimental approach), but also on checking
whether, in line with the theory, the inter-purchase time decreases with decreasing distance
to goal for those on the ‘reward program’ condition (the more structural approach). Testing
specific theoretical mechanisms (such as the points pressure, as in this case), is, I think, one
way in which empirical research in this area can overcome the major problem of self-selection
into loyalty programs.
But even in this felicitous case where selection into the treated and non-treated group is
random, internal validity is not guaranteed. We are interested in the effects of the ‘reward’ and ‘no reward’ treatments on purchases. However, both treatments are included in more complex
packages, that include elements extraneous to our interest - in Shadish et al. (2002)’s
con-ceptualization, the causes in the field experiment aremolar, not molecular. Thus, the reward
treatment might have implicitly brought in a higher motivation to record purchases accurately
(the reward being contingent on the purchases) than the no reward treatment, where there was
no such contingency. Thus, it is plausible that the participants in the second condition might
have made un-recorded purchases (either they didn’t have the card with them or were
unmoti-vated to pull it out of their wallet), so their recordings might be negatively biased. Moreover,