174
P
1
P
Mubarak Dirar Abdallah, P
2
P
Elharam Ali Eltahir Mohammed
P
3
P
Sawsan Ahmed Elhouri Ahmed & P
4
P
Rawia A.Elgani
P
1
P
International University of Africa- College of Science-Department of Physics & Sudan University of Science& Technology-College of Science-Department of
Physics-Khartoum-Sudan
P
2, 4
P
Sudan University of Science& Technology-College of Science-Department of Physics-Khartoum-Sudan
P
3
P
University of Bahri-College of Applied & Industrial Sciences-Department of Physics Khartoum - Sudan
Abstract:
Fe material with different concentrations was used to dope glass and plastic samples. The absorption coefficient, refractive index, real and imaginary electric constants decreases as Fe concentration increases. These results agree with theoretical relations.
Keywords: Glass, plastic, Fe, doping, absorption coefficient, refractive
index, energy gap.
Introduction:
175
2. Theoretical interpretation
The real and imaging permeability can be found from equation of Particle viscous medium of viscosity ƞ which is given by
ƞ = 1
2mnR0 RL ν(2.1)
𝑚 = particle mass nR0R = number density
L = free path length
𝜈𝜈 = velocity
The equation of motion under the effect of electric field of strength E is giving by
𝑚ẍ = 𝑒 𝐸 −6𝜋 𝑎 ƞ ⱱ =𝑒 𝐸 − 𝛾 𝜈𝜈 (2.2) Where
𝛾 = 6𝜋 𝑎 ƞ 𝜈𝜈 = 3𝜋 𝑎 𝑚 𝐿 𝜈𝜈nR0
= 𝛾0nR0R (2.3)
𝑎 = Radius of the particle
𝛾0 = 3𝜋 𝑎 𝑚 𝐿 𝜈𝜈
Consider now the solution
𝑥 = 𝑥0𝑒𝑤𝑡 ẋ =𝑖𝑤𝑥 =𝜈𝜈
ẍ =−𝑤2𝑥 (2.4)
Substituting (2.3) in (2.1) given
(𝑖𝛾 − 𝑚𝑤2)𝑥 =− 𝑒 𝐸 (2.5)
Thus
𝑥 =[𝑖𝛾−𝑚𝑤−𝑒 2]𝐸 = [[𝑚𝑤𝑚2𝑤2+𝑖𝛾4+𝛾]𝑒𝐸2] (2.6)
𝑝 = 𝑒 𝑛 𝑥 =𝑒2𝑛 [𝑚𝑤2+𝑖𝛾] 𝐸 [𝑚2𝑤2+𝛾2]
= [𝑥1 +𝑖𝑥2] 𝐸 (2.7)
𝑥1 = 𝑚𝑤
2𝑛𝑒2
[𝑚2𝑤2+𝛾2]𝑥2 =
𝛾𝑛𝑒2
[𝑚2𝑤2+𝛾2] (2.8)
For very large friction coefficient
𝛾 ≫ 𝑚𝑤 (2.9) Hence
𝑥1 =𝑚𝑤
2𝑛𝑒2
𝛾2 =
𝑛𝑒2𝑚𝑤2
𝛾02𝑛02 (2.10)
𝑥2 = 𝑛𝑒 2
𝛾 =
𝑛𝑒2
𝛾0𝑛0 (2.11)
𝜎1 =𝑤𝑥2 = 𝑤𝜀0𝑥2 (2.12)
α = 𝜎1
176
Five samples plastics and glasses were doped by Fewith different concentration ranging from 29.3 𝝁𝝁g/cmP
2
P
to2623𝝁𝝁g/cmP
2
P
.
The optical properties of samples were studied by using the following devices with the following specification.
a. Spin coater
A thin film is made by the spin coating method, the number of round proportional increases with the voltage, then the thickness decreases with an increase in the number of round
b. Ultra violet (UV) spectrometer
The visible spectra obtained in shimadzo mini 1240 spectrophotometer scanning between 200 -1200 nm.The spectrophotometer measures how much of the light is absorbed by the sample.
4. Results:
Fig(1)The relation between absorption coefficient and wavelength for glass doping by Fe with different concentration
560 588 616 644 672 700 728 756 784 0.00
2.20x10⁻⁹ 4.40x10⁻⁹ 6.60x10⁻⁹ 8.80x10⁻⁹ 1.10x10⁻⁸ 1.32x10⁻⁸ 1.54x10⁻⁸ 1.76x10⁻⁸ 1.98x10⁻⁸
A
bs
orpt
ion C
oef
fic
inent
α
(
c
m
-1 )
Wavelength λ ( nm )
177
Fig(2)The relation between refractive index and wavelength for glass doping by Fe with different concentration
Fig (3) The optical energy gap for glass doping by Fe with different concentration
560 588 616 644 672 700 728 756 784 3.9
5.2 6.5 7.8 9.1 10.4 11.7 13.0 14.3
R
ef
ac
tiv
e I
ndex
(
n )
Wavelength λ ( nm )
29.3 µm 75.1 µm 115.2 µm 120.7 µm 205.8 µm
1.408 1.452 1.496 1.540 1.584 1.628 1.672 1.716 1.760 3.30x10⁻¹⁷
6.60x10⁻¹⁷ 9.90x10⁻¹⁷ 1.32x10⁻¹⁶ 1.65x10⁻¹⁶ 1.98x10⁻¹⁶ 2.31x10⁻¹⁶ 2.64x10⁻¹⁶ 2.97x10⁻¹⁶
(
α
h
υ
)
2 (
e
V
.c
m
-1 )
hυ ( eV )
29.3 µm 75.1 µm 115.2 µm 120.7 µm 205.8 µm
29.3 µmEg = 1.759 eV
178
Fig (4) The relation between real dielectric constant and wavelength for glass doping by Fe with different concentration
Fig (5) The relation between imaginary dielectric constant and wavelength for glass doping by Fe with different concentration
560 588 616 644 672 700 728 756 784 0
23 46 69 92 115 138 161 184 207
R
eal
D
iel
ec
tri
c C
ons
tant
Wavelength λ ( nm ) 29.3 µm
75.1 µm 115.2 µm 120.7 µm 205.8 µm
560 588 616 644 672 700 728 756 784 8.30x10⁻¹⁵
1.66x10⁻¹⁴ 2.49x10⁻¹⁴ 3.32x10⁻¹⁴ 4.15x10⁻¹⁴ 4.98x10⁻¹⁴ 5.81x10⁻¹⁴ 6.64x10⁻¹⁴ 7.47x10⁻¹⁴
I
m
agi
narny
D
iel
ec
tr
ic
C
ons
tant
Wavelength λ ( nm )
179
Fig (6) The relation between absorption coefficient and wavelength forplastic doping by Fe with different concentration
Fig (7) The relation between refractive index and wavelength forplastic doping by Fe with different concentration
560 588 616 644 672 700 728 756 784 0.00
1.10x10⁻⁹ 2.20x10⁻⁹ 3.30x10⁻⁹ 4.40x10⁻⁹ 5.50x10⁻⁹ 6.60x10⁻⁹ 7.70x10⁻⁹ 8.80x10⁻⁹
A
bs
or
pt
ion C
oef
fi
c
inet
α
( c
m
-1 )
Wavelength λ ( nm )
51.1 µg/cm2
106.8 µg/cm2
260.4 µg/cm2
275 µg/cm2
2623 µg/cm2
560 588 616 644 672 700 728 756 784 1.050
1.071 1.092 1.113 1.134 1.155 1.176 1.197 1.218
R
ef
rac
ti
v
e I
ndex
( n )
Wavelength λ ( nm )
180
Fig (8) The optical energy gap forplastic doping by Fe with different concentration
Fig (9) The relation between real dielectric constant and wavelength forplastic doping by Fe with different concentration
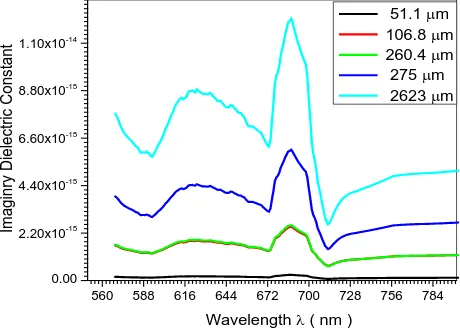
Fig (10) The relation between imaginary dielectric constant and wavelength forplastic doping by Fe with different concentration
1.7532 1.7568 1.7604 1.7640 1.7676 1.7712 1.7748 0.156 0.234 0.312 0.390 0.468 0.546 0.624 0.702 0.780 ( α h υ )
2 (
e
V
.c
m
-1 )
2
hυ ( eV ) 51.1 µm 106.8 µm 260.4 µm 275 µm 2623 µm
2623 µm Eg= 1.763 eV
51.1 µm Eg = 1.764 eV
560 588 616 644 672 700 728 756 784 1.08 1.20 1.32 1.44 1.56 1.68 1.80 1.92 2.04 R eal D iel ec tic C ons tant
Wavelength λ ( nm )
51.1 µm 106.8 µm 260.4 µm 275 µm 2623 µm
560 588 616 644 672 700 728 756 784 0.00 2.20x10⁻¹⁵ 4.40x10⁻¹⁵ 6.60x10⁻¹⁵ 8.80x10⁻¹⁵ 1.10x10⁻¹⁴ I m agi nry D iel ec tr ic C ons tant
Wavelength λ ( nm )
181
5. Discussion
The behaviour of glass and plastic doped with Fe for some optical properties like absorption coefficient α , refractive index 𝑛1, energy gap 𝐸𝑔 , real and
imaginary permitavity inrelationto concentration of Fe is shown in figures (1,2,3,4,5) for glass and figurers (6,7,8,9,10) for plastic respectively . The effect of increasing doping concentration of Fe on α, 𝑛1,𝜀1,𝜀2,shows inverse
relation except for𝐸𝑔 which shown that 𝐸𝑔 is directly proportional to concentration , i.e.
𝐸𝑔 ∝ 𝑛0
𝛼 ∝ 𝑛1 0 𝑛1 ∝𝑛10
𝜀1 ∝𝑛1 0
𝜀2 ∝ 𝑛10 (1)
Where 𝑛0 represent the number density of Fe atoms. This can forms with equations (2.9, 2.10, 2.11, and 2.12)
𝛼 ~𝜎1~𝑛1 0 𝜀1~ 1 +𝑥1 ~ 𝑛1
0 𝜀2~ 𝑥2 ~ 𝑛10 (2)
This means that increasing Fe concentration increase into density. This increase frictional force too. This increase of friction increases absorption which is straight forward by physical intuition.
The refractive index 𝑛1is related to the relaxation time 𝜏 throught the relation between speed of light in a medium𝜈𝜈, and in vacuumc, beside the distance a between two atoms. According to this relation
a
𝑐𝑡 =𝜈𝜈(𝑡+𝜏) = 𝑎 𝜈𝜈 �𝑎𝑐 +𝜏�= 𝑎 𝜈𝜈
𝑐(𝑎+𝑐𝜏) = 𝑎
�1 +𝑐𝑎𝜏�= 𝑐𝜈 =𝑛1 (3)
182 𝜏 =𝑛
0
𝑛1 =�1 +𝑎𝑛𝑐𝑐00�~𝑛10 (4)
This derivation agrees with the empirical relation between 𝑛1 and 𝑛0 shown in equation (5.1).
For plastic doped with Fe the empirical relation between 𝜀1 ,𝑛1is similar to that of Fe with glass. However the relations of α,αl,ε2shows that
𝛼 ,𝛼𝑙 ,𝜀2 ~ 𝑛 (5)
Where n is the concentration of free charge carriers which also increases when 𝑛0 increase.
These empirical relations agrees also with the theoretical relations (2.8, 2.12, 2, 13) where
𝛼,𝛼𝑙 ~ 𝜎1~ 𝑛
𝜀2~𝑥2~𝑛 (6)
This indicates that the effect of free carriers becomes important than the effect of friction in the absorption process.
It is very interesting to note that the energy gap𝐸𝑔, in all cases increases with 𝑛0 i.e
𝐸𝑔 ∝ 𝑛0 (7)
This empirical relation agrees with the theoretical one, where
𝑛𝑖 = 𝑁𝑣𝑁𝑐𝑒−𝛽𝐸𝑔
𝐸𝑔 = 𝛽1𝐿𝑛(𝑁𝑛𝑖𝑐𝑁ⱱ2 ) (8)
Where
𝑁𝑐 ,𝑁𝜈are the average concentrations of carriers in the conduction and
valence band respectively. The term 𝑛𝑖 stands for free charges generated thermally. This means that increasing concentrations of Fe and Fe, increases concentration of holes𝑁𝑣 and concentration of free conduction electrons 𝑁𝐶 without increasing thermally generated carriers 𝑛𝑖 , i.e
𝑁𝑐,𝑁𝜈 ~ 𝑛0 (8)
Thus from (5)
𝐸𝑔 ~ 𝑛0 (9)
In agreement with the empirical relation
6. Conclusion
183
into the room, by decreasing concentration of Fe. It can be also be used in designing sensor and solar cells to improve their performance.
7. Reference:
1. Glass - Chemistry Encyclopedia". Retrieved 1 April 2015.
2. B. H. W. S. de Jong, "Glass"; in "Ullmann's Encyclopedia of Industrial Chemistry"; 5th edition, vol. A12, VCH Publishers, Weinheim, Germany, 1989, ISBN 978-3-527-20112-9, pp. 365– 432.
3. Pfaender, Heinz G. (1996). Schott guide to glass. Springer. pp. 135, 186. ISBN 978-0-412-62060-7. Retrieved 8 February 2011.
4. Corning, Inc. Pyrex data sheet. (PDF). Retrieved 2012-05-15. 5. AR-GLAS Schott, N.A., Inc data sheet