PROBLEMS: EXPLORING CHILDREN’S STRATEGIES
Jenny Houssart, Hilary EvensCentre for Mathematics Education, Open University
We describe the first phase of a project concerned with the foundations of algebra. Data consists of the responses of 11 year-olds to selected questions from national tests. We focus on one question, which concerns a sequence of shapes and classify successful methods and incorrect solutions. The most common method of successful solution involves some form of table of numbers. Other methods include drawing and use of a relationship. Examination of incorrect answers suggests four common errors. The idea of a ‘best method’ proves problematic, as both the apparently sophisticated and reliable methods sometimes produced incorrect solutions.
INTRODUCTION
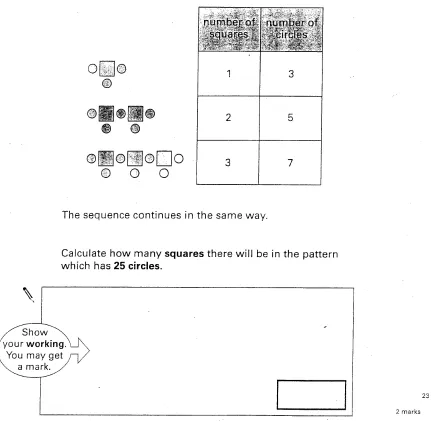
This paper reports on the first phase of a study being carried out jointly by the Open University and the Mathematics Test Development Team at the Qualifications and Curriculum Authority. The study concerns the responses of 11-year-olds to tasks that can be seen as pre-algebraic. The first phase was based on the responses of children to Key Stage 2 written mathematics tests. This paper discusses the first phase and looks in detail at children’s responses to one question. The question concerns a sequence of growing shapes and we refer to it as ‘Squares and Circles’ (see Figure 1). The next phase of this study will consist of the trialling of different but related questions and it is hoped that this will be followed by interviews with children to explore their responses.
Key Stage 2 tests are compulsory tests taken by eleven-year-old children in England. These are nationally set tests, linked to a National Curriculum and the results are publicly available. Such testing is therefore considered ‘high-stakes’ and is seen by external observers as a major focus for schools (Earl et al 2001). One consequence of national testing is that it provides large scale information about what children can do at the end of primary schooling. In fact, as Black argues (1998), the existence of these tests has led to the extinction of other systems in England for assessing children’s mathematical performance, for example the Assessment of Performance unit, which was set up in 1974 to monitor mathematical standards. It is therefore hoped that enough information can be extracted from test responses to indicate children’s strengths and difficulties and suggest implications for future teaching. Such information is provided in outline to schools each year (eg. QCA 2001). Researchers have also looked in more detail at children’s answers, for example Williams and Ryan (2000) conducted an error-analysis based on 1997 tests for 7-year-olds and 14-7-year-olds. The intention of our study is to provide a detailed picture of children’s performance on a particular aspect of mathematics.
BACKGROUND Early Algebra
The framework adopted for this study is that of ‘Roots of algebra’ as identified by Mason et al (1985). The authors describe the roots of algebra as ‘Strands or ideas which underlie algebraic thinking’ (p1). They go on to identify four roots : expressing generality; rearranging and manipulating; possibilities and constraints; generalised arithmetic. In adopting this framework we acknowledge that there are a range of views of early algebra in the research literature and a corresponding range of terminology.
Definitions of algebraic thinking are also problematic. Wheeler (1996) wrote that the question ‘What are the essential characteristics of algebraic thinking?’ had not been worked on enough, though he went on to say that it was an excellent long-term research question. Lee (2001) acknowledges that there is still a lack of consensus about what algebraic thinking is, but examines possible views in the literature, concentrating on those elements which might be appropriate for early algebra. Her list includes; reasoning about patterns, seeing the general in the particular, mentally handling the as-yet-unknown and thinking about mathematical relations rather than mathematical objects. These elements have much in common with the ‘Roots of Algebra’.
Nickson (2000) acknowledges that there is a considerable body of research on the transition from arithmetic to algebra and asserts that the idea of ‘Pre-algebra’ is fairly well established. One theme in the research is the importance of structure in algebra, in contrast to the importance of procedures in arithmetic (Kieran 1992, Sfard 1991). Other terms used include ‘Emergent Algebra’ (Ainley 1999), ‘Foundations of Algebra’ (Royal Society 1997) and ‘Early Algebra’ (Lee 2001). Lee confirms that there are many different views of what introductory algebra is or might be and she relates this to different views of what algebra itself consists of. The views given include algebra as a language; as a way of thinking; as an activity; as a tool; as generalised arithmetic and as a culture.
This study takes the view that algebra is a way of thinking, as exemplified in the roots of algebra framework described above, which may be provoked by certain activities. Thus although we will identify certain test questions as offering the potential for algebraic thought, we need also to look at the solution strategies the children used, to see if there was evidence of such thinking. This is consistent with recent work acknowledging the possibility of algebraic thinking in numerical activities (Linchevski 1995, Blanton and Kaput 2001, Steffe 2001).
Sequences of Patterns
Sequences of patterns are seen by many as a way of approaching algebra (eg. Mason 1985, 1996, Lee 1996). Orton et al (1999) discuss the possible benefits of setting pattern tasks within pictorial and practical contexts. These include adding meaning to the task as well as perhaps making it simpler for some or all pupils. Mason et al (1985) make extensive use of patterns of shapes when suggesting activities which will encourage pupils to express generality. They suggest four stages in this process: seeing a pattern; saying a pattern; recording a pattern and testing formulations. They go on to say that the recording stage can involve a range of different formats including pictures, words, symbols and various combinations of these.
Tasks of this type are also seen by many as appropriate for both primary and secondary children and hence several studies compare the response of upper primary and lower secondary pupils to items involving sequences of patterns. For example, in tests set in 1982, the Assessment of Performance Unit asked 11 year olds and 15 year olds several questions involving sequences of shapes (APU undated). In all questions more 15 year olds than 11 year olds were successful. Pupils were less likely to be successful as the information asked for became further from the pictured shapes. The omission rate was low for questions requiring a number as an answer, but higher when explanations and generalisations were sought.
Stacey (1989) reports a study in which students aged between 9 and 13 worked on what she called ‘Linear Generalising Problems’. These are defined as problems which require students to observe and use a linear pattern of the form f n( )= an b+ , with b≠0. She classifies pupils’ methods and models, including those leading to incorrect answers. These include the ‘whole object method’ where children take a multiple of the number of parts in a smaller shape. An example of this would be using a ladder with 2 rungs made from 8 matches to arrive at the result that a ladder with 4 rungs would need 16 matches. Stacey’s study also introduces the terms ‘near generalisation’ and ‘far generalisation’ to distinguish between examples which can reasonably be solved by drawing or another step by step approach and those which are unlikely to be solved in this way. Finding the number of matches needed to make a ladder with 20 rungs is an example of what she would call a ‘near generalisation’. Finding the number of matches needed to make a ladder with 100 rungs would be seen as a ‘far generalisation’.
she reports that once the numbers had been made explicit, it often appeared that the matches were set aside.
Ishida (1998 in Japanese, reported in Ishida and Sanji 2002) studied solutions to problems where students had to identify the 100th pattern in a sequence. He classified
these as ‘far generalisations’ building on the work of Stacey described above and hence suggested that drawing is a poor strategy in such problems. He explicitly identified the ‘best method’ for such problems as providing an expression linked to a simple generalisable structure.
The test question being considered here differs from those asked in the studies described above in three ways. Firstly the question is presented with a table of numbers alongside the pictures, which may have encouraged the children to use tables or lists of numbers in their solutions. Secondly our question only requires an answer about one other shape in the sequence and it is near enough to be reasonably reached by a drawing or difference method. Finally the ‘Squares and Circles’ question requires pupils to give the number of squares (effectively the same as the number in the sequence) for a given number of circles, rather than the other way round. In this respect the question can be seen as more demanding.
METHOD
This phase of the research was based on KS2 National Curriculum level 3-5 test papers from 2001. The 451 papers used for this research were made available to us by the Mathematics Test Development team at the Qualifications and Curriculum Authority. They came from the sample used for the 2001 Analysis of Pupil Performance which forms the basis of the official report on the 2001 KS2 tests (QCA 2002). The sample was chosen to show a range of responses from each of the three main levels achieved at Key Stage 2 so it comprises roughly 33% at each of the levels 3,4 and 5.
The first stage was to identify questions that were considered to offer opportunities for early algebra. This was done by a team of researchers, using the ‘roots of algebra’ framework. At this point 17 of the 52 questions in the tests were considered for possible inclusion. An additional criteria was that questions should result in responses likely to give us detailed information about children’s methods of solution and this reduced the number of questions considered to ten. Once questions had been provisionally selected, we looked at responses to the questions from the sample, to determine whether they were likely to give sufficient information. In this way, the number of questions was narrowed down and six questions were selected for detailed analysis. Two of these were considered to be examples of Expressing Generality, two of Rearranging and Manipulating and two of Possibilities and Constraints.
generalisation approach to algebra (Mason 1996, Lee 1996). Analysis of responses to some other selected questions is discussed elsewhere (Houssart and Evens 2002).
Figure 1. The question ‘Squares and Circles’, 2001 KS2 Test A Question 23 The starting point for analysis of responses was recording grids used for official analysis. These included classification of answers and working. These were expanded to include more detailed method categories, consistent with existing research on similar items. After trialling they were expanded again in line with children’s responses. Finally there was agreement trialling between researchers to achieve consistency, before the full analysis was carried out.
which were often accompanied by little or no working. Initial analysis of incorrect answers was by answer given. For common incorrect answers, photocopies were taken of working if it was present, to try to determine how these solutions were arrived at.
FINDINGS Overview
We looked at the responses of 451 children to this question. These are summarised in Tables 1-3.
Total number of scripts 451
Number Percentage
Correct answer 168 37
No response 65 14
Incorrect answer 218 48
Table 1. Overview of responses
This was amongst the harder questions in the test, with only 37% of the papers examined showing the correct answer, as shown in Table 1. However, unlike some other ‘hard’ questions, many children did attempt to answer, with 48% of papers examined showing an incorrect answer. We classified the correct answers according to the method used. We also looked at incorrect answers and the accompanying working, if there was any, to try to find explanations for children’s difficulties.
Correct Answers
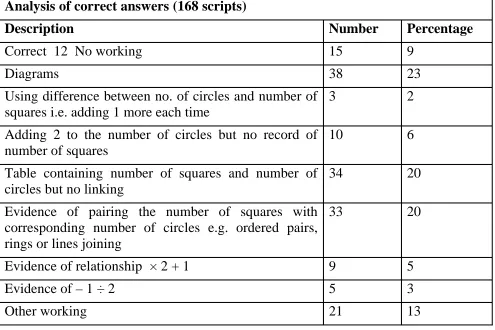
Analysis of correct answers (168 scripts)
Description Number Percentage
Correct 12 No working 15 9
Diagrams 38 23
Using difference between no. of circles and number of squares i.e. adding 1 more each time
3 2
Adding 2 to the number of circles but no record of number of squares
10 6
Table containing number of squares and number of circles but no linking
34 20
Evidence of pairing the number of squares with corresponding number of circles e.g. ordered pairs, rings or lines joining
33 20
Evidence of relationship × 2 + 1 9 5
Evidence of – 1 ÷ 2 5 3
Other working 21 13
Table 2. Analysis of correct answers
Other common solutions involved some type of table, chart or list of numbers. Examples of this are shown in Figure 3. Some children seemed to have worked downwards, continuing both columns until they arrived at 25 circles as shown in the first example. Others showed evidence of working across, linking the number of
circles to the number of squares in each case. Such evidence was in the linking of the pairs of numbers by lines or rings as shown in the second example. This linking can be seen as an important step, as the ability to link the number of squares to the number of circles in each case might assist children in solving ‘far generalisation’ problems or in seeing the relationship. Sometimes a table format was used but with evidence of some linking as in the third example. This could be seen as an important intermediate step between working down and working across, though it may also be seen as an attempt to keep the table straight. Almost half the children who answered this question correctly used some sort of continuation of number pattern in a table.
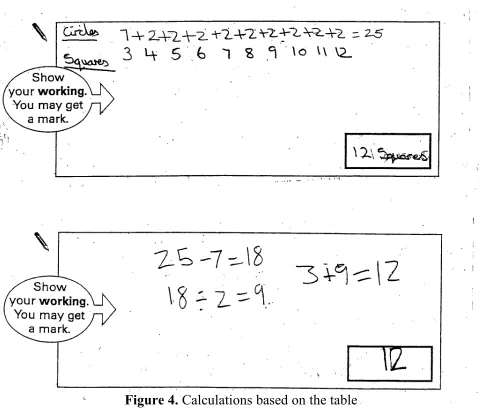
A small number of children produced numerical solutions based on the table, but without drawing out the whole table or list of pairs of numbers. One way of doing this was to work out how many times 2 needed to be added to 7 to reach 25. This method is shown in the two examples in Figure 4, firstly in longhand and then in a more succinct version.
Finally, some children presented solutions that focussed on the relationship between the number of circles and the number of squares. Such solutions were much less
common than those based on diagrams or tables, with 8% of correct answers showing evidence of using the relationship between the number of squares and the number of circles. Some examples of such solutions are given in Figure 5. The first two examples show evidence of the fact that the number of circles is double the number of squares add one. In the first example given this relationship is written alongside a table of numbers and there is also evidence that the relationship written is a second attempt, with an earlier attempt (probably including the number 12.5) being written over. The second solution shown expresses the relationship in letters, something only a very few children did. The third solution given here shows evidence of subtracting one then dividing by two.
Incorrect Answers
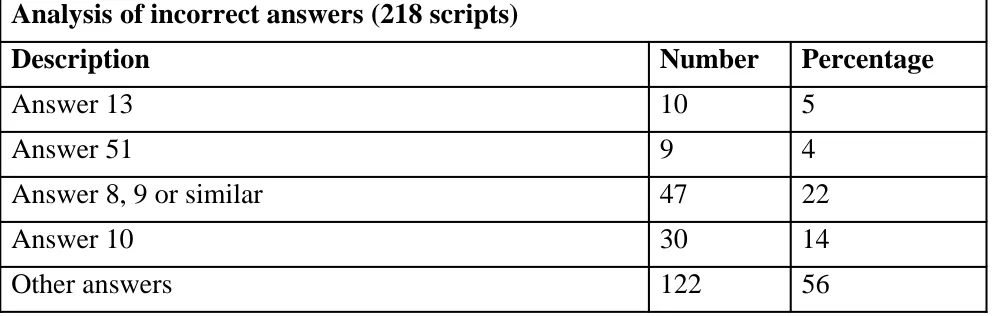
Analysis of incorrect answers (218 scripts)
Description Number Percentage
Answer 13 10 5
Answer 51 9 4
Answer 8, 9 or similar 47 22
Answer 10 30 14
Other answers 122 56
Table 3. Analysis of incorrect answers
DISCUSSION
Comparison with Other Research
Children’s responses to this question differ to similar questions reported in the research literature in that the most common successful strategy was to use some sort of table of numbers. However it could be argued that children were drawn to this strategy by the fact that a table was effectively started for them. The fact that this question involved a ‘near generalisation’ may also have had a significant effect on the solution strategies chosen and hence many children solved it by drawing. Some children made use of the relationship between the number of circles and squares. The most common errors involved the ‘whole object’ method, which is consistent with other research. An additional error caused by the fact that this was an ‘inverse’ problem, was to apply the relationship the wrong way round. Another factor to be remembered in comparing our findings with those of others is that we were looking at answers produced in a real test situation rather than as part of a research project. This would limit the time available and may also encourage children to use solutions which they see as reliable. It may be that the same children would use different methods in other circumstances.
Comparison of Strategies
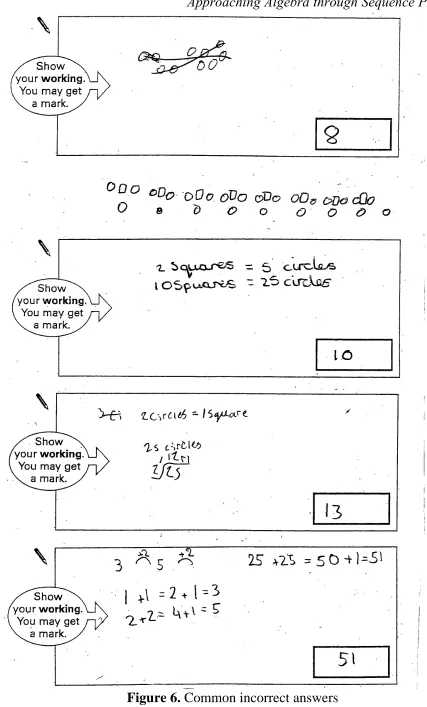
It is difficult to define a ‘best strategy’ for this problem. Using the relationship between the numbers of circles and squares can be seen as the most sophisticated method and would certainly be preferable in the case of a ‘far generalisation’. However in this case, some children applying the ‘relationship’ approach did so the wrong way round and arrived at an incorrect answer. Although 13 children arriving at the correct answer showed some evidence of using a relationship, 9 children apparently applied the relationship the wrong way, arriving at the answer 51.
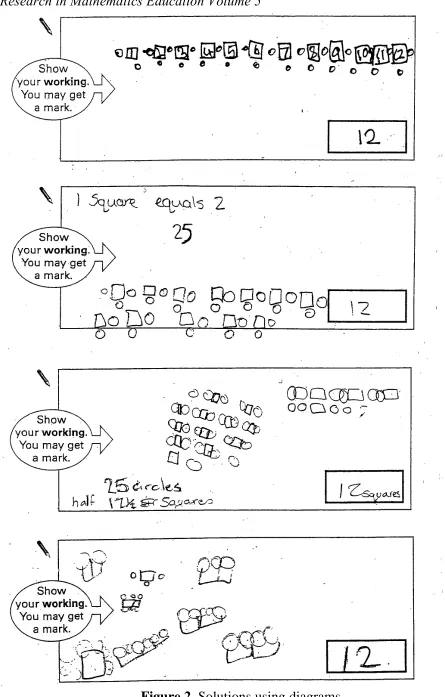
The drawing approach could be seen as the least sophisticated, but most reliable. However for some children, there is a suggestion that drawing the shapes may have aided their understanding of the relationship. In some cases this was suggested by gaps in the drawing, indicating that children may have added one square and two accompanying circles. This can be seen in the second example in Figure 2 where the drawing is also accompanied by a statement of the relationship.
However the use of diagrams was not as foolproof as might be imagined, as some children drew an incorrect pattern. This was particularly the case for children who thought the pattern was three circles round every square and therefore drew that, as previously shown in the first example in Figure 6.
Limitations
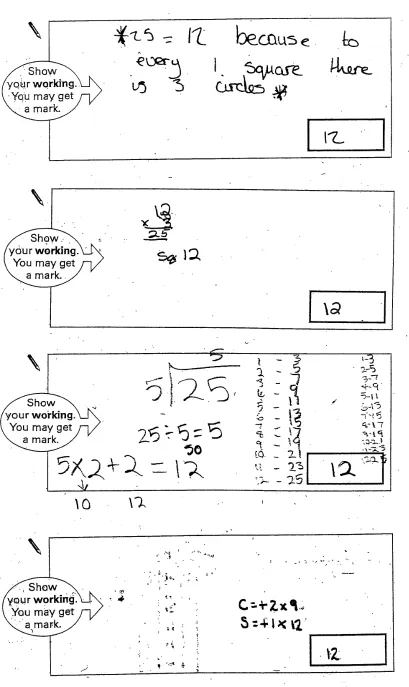
We can not be certain that the method presented in the solution box is the one that the child actually used to reach the solution. Some children presented a formal but incorrect method alongside the correct answer. Some examples of this are given in Figure 7. Several children who appeared to think that there were three circles for every square still arrived at the correct answer. Two examples of this are shown. In the first of these the incorrect relationship is explicitly stated alongside the correct answer. In the second example the child seems to have tried to justify the answer 12 by showing a calculation based on the incorrect relationship. In both these cases there is no indication how the correct solution was really arrived at. In the third example we can see that the correct solution was probably arrived at using a table of numbers. However it is accompanied by a calculation based on the incorrect whole object method, which would have given an answer of 10, but with 2 added, presumably to give the answer arrived at in the table.
In the final example given, marks on the paper suggest that the answer may have been arrived at by writing lists of numbers, which were then rubbed out. The solution presented looks like the sort of algebraic expression that the child may think is what the markers want. It is possible that this is a similar solution to that shown in Figure 4 where 2 is added to the number of circles 9 times. This raises another limitation, that even when children attempt to explain what they have really done, there is a danger of reading more or less than was intended in to the answer.
IMPLICATIONS FOR TEACHING
Our findings suggest a wealth of solutions provided by children. Teachers might want to capitalise on this by encouraging a whole class to work on problems such as this and share their solutions.
We have also noted some common errors, which teachers may wish to be aware of. Some of these are likely to occur in any linear generalisation problem. The error of applying the relationship the wrong way is likely to occur only when children are asked for an inverse, as in this problem. One approach to incorrect answers is to return to the stages offered by Mason et al (1985): seeing a pattern; saying a pattern; recording a pattern and testing formulations. It seems that many children would be helped by encouragement to carry out the fourth stage. This could mean checking that the relationship or pattern suggested applies to all the diagrams already provided, not just one. It could be extended to include further examples.
encourage-ment to record in different ways and to use their recordings to explain what is happening. It may be that such work would be more beneficial in asissting children to see the structure of patterns than premature introduction to algebraic symbols.
REFERENCES
Ainley, J.: 1999, ‘Doing Algebra-Type Stuff: emergent algebra in the primary school.’ Proceedings of the 23rd Annual Conference of the International Group for the Psychology of Mathematics Education, Haifa, Israel, Volume 2, 9-16.
Assessment of Performance Unit: undated, A Review of Monitoring in Mathematics 1978 to 1982, Part 2.
Black, P.: 1998, Testing: Friend or Foe? Theory and Practice of Assessment and Testing. London: Falmer Press.
Blanton, M. and Kaput, J.J.: 2001,‘Algebrafying the Elementary Mathematics Experience, Part 2: Transforming Practice on a District-Wide Scale.’ Proceedings of the Twelfth ICMI study, The future of the Teaching and Learning of Algebra, Melbourne, Australia.
Earl, L., Levin, B., Leithwood, K., Fullan, M. and Watson, N. with Torrance, N., Jantzi, D. and Mascall, B.: 2001, Watching and Learning 2, OISE/UT Evaluation of the Implementation of the National Literacy and Numeracy strategies.Toronto: Ontario Institute for studies in Education, University of Toronto.
Houssart, J. and Evens, H.: 2002, ‘Children Using Trial and Improvement Methods: examples from Key Stage Two tests’ Proceedings of the British Society for Research into Learning Mathematics, Day Conference held at the University of Bristol on 18th May 2002, Volume 22(2), 19-24.
Ishida, J. and Sanji, A.: 2002, ‘Can Poor Students Identify the Good Features of a Demonstrated Problem Solving Method and use it to Solve a Generalization Problem?’ Proceedings of the 26th Annual Conference of the International Group for the Psychology of Mathematics Education, University of East Anglia, UK, Volume 3, 137-144.
Kieran, C.: 1992, ‘The learning and Teaching of School Algebra.’ In D.A. Grouws (ed), Handbook of Research on Mathematics Teaching and Learning (pp. 390-419). New York: Macmillan.
Lee, L.: 1996, ‘An Initiation into Algebraic Culture through Generalisation Activities’ In N. Bednarz, C. Kieran and L. Lee (eds.), Approaches to Albebra Perspectives for Research and Teaching (pp. 87-106). Dordrecht: Kluwer Academic Publishers.
Linchevski, L.: 1995, ‘Algebra with Numbers and Arithmetic with Letters: A Definition of Pre-Algebra.’ Journal of Mathematical Behaviour, 14, 113-120.
Mason, J., Graham, A., Pimm, D. and Gowar, N.: 1985, Routes to / Roots of Algebra. Milton Keynes: The Open University Press.
Mason, J.: 1996, ‘Expressing Generality and Roots of Algebra.’ In N. Bednarz, C. Kieran and L. Lee (eds.), Approaches to Algebra, Perspectives for Research and Teaching (pp. 65-86). Dordrecht: Kluwer Academic Publishers.
Nickson, M.: 2000, Teaching and Learning Mathematics, A Teacher’s Guide to Recent Research and its Application. London: Cassell.
Orton, J.: 1997, ‘Matchsticks, Pattern and Generalisation.’ Education 3-13, 25(1), 61-65.
Orton, J., Orton, A. and Roper, T.: 1999, ‘Pictorial and Practical Contexts and the Perception of Pattern.’ In A. Orton (ed.), Pattern in the Teaching and Learning of Mathematics (pp. 121-136). London: Cassell.
QCA : 2001, Standards at Key Stage 2, English, Mathematics and Science: A report for headteachers, class teachers and assessment coordinators on the 2000 national curriculum assessments for 11-year-olds. Suffolk: Qualifications and Curriculum Authority.
QCA : 2002, Standards at Key Stage 2, English, Mathematics and Science: A report for headteachers, class teachers and assessment coordinators on the 2001 national curriculum assessments for 11-year-olds. Suffolk: Qualifications and Curriculum Authority.
Royal Society, Joint Mathematical Council of the United Kingdom: 1997, Teaching and Learning Algebra pre-19, Report of a Royal Society/ JMC Working Group. London: The Royal Society.
Sfard, A.: 1991, ‘On the Dual Nature of Mathematical Conceptions: reflections on process and objects as different sides of the same coin.’ Educational Studies in Mathematics, 22, 1-36.
Stacey, K.: 1989, ‘Finding and Using Patterns in Linear Generalising problems.’ Educational Studies in Mathematics, 20, 147-164.
Steffe, L. P.: 2001, ‘What is Algebraic about Children’s Numerical Operating?’ Proceedings of the twelfth ICMI Study, The Future of the Teaching and Learning of Algebra, Melbourne, Australia.
Wheeler, D.: 1996, ‘Backwards and Forwards: Reflections on Different Approaches to Algebra.’ In N. Bednarz, C. Kieran and L. Lee (eds.), Approaches to Algebra, Perspectives for Research and Teaching (pp. 317-325). Dordrecht: Kluwer Academic Publishers.