Comparison of various Edge Detection Techniques
for maximum data hiding using LSB Algorithm
Soumyajit Sarkar
(Computer Science, St. Thomas’ College of Engineering and Technology (WBUT), Kolkata, WB, India)
Arijit Basu
(Information Technology, Heritage Institute of Technology (WBUT), Kolkata, WB, India)
Abstract- Steganography is the art of hidinginformation. It is derived from the Greek word ‘’Steganos’’ which means covered writing, a science of secret communication. It is a tool for hiding information in a medium so that the information does not appear to exist. For hiding secret information in images there exists a large variety of steganographic techniques, some are more complex than others and all of them have respective strong and weak points. The edges of an image can be used very efficiently for hiding data.
In this paper we performed a thorough investigation in comparing the different edge detection techniques and hence evaluate which technique is better for image steganography
Keyword—Steganography, Steganalysis, Edge Detection, Robert, Prewitt, Sobel, Laplace, Canny, LSB, PSNR, MSE, Greyscale image
I. INTRODUCTION
The modern day rise in improved technology have led intruders’ access to sensitive information and use them in an unethical manner. Hence, security is getting compromised more often during an exchange process between the sender and the receiver. To accomplish this task new methods based on the principles of image processing and steganography are being developed and used. Image steganography is the technique of hiding information bits within the image. There are various patterns of hiding the text bits amongst which a safe way is detecting the edges of the image and hiding the information there. The edges of an image lay in a random fashion and hence the information bits also get encoded in that way. Also it is important to note that the edges can be detected in various ways viz Robert, Laplace, Prewitt, Sobel, Canny edge detection techniques. It is important to understand the layer of difference Steganography and Cryptography. While the former deals with hiding the very existence of the information, the later embarks on converting the information into a more complicated form which is not readily understandable.
A. Image Processing
Image processing is any form of signal processing for which the input is an image, such as photographs or frames
of videos, the output of image processing can be either an image or a set of characteristics related to the image. Thus, an image is an array of numbers that represent light intensities at various pixels.
In computer vision image processing can be done through digital images which includes Greyscale images. A Greyscale image consists of pixels ranging from values (0-255). Each pixel represents one byte of image matrix [1].
B. Edge Detection Techniques
An Edge is defined by the boundary with which it separates the higher intensity of the image with that of the lower intensities. An Edge can also be used as a filter in image processing. The edge filters are used in the process of identifying the image by locating the sharp edges which are discontinuous [5]. The edge values lay in a random fashion throughout the length of the image and thus presents a more secured perspective. Detection of edges for an image may help for image segmentation, data compression and also help for well matching such image reconstruction, pattern matching and so on [3]. An edge pixel is described by using two important features, primarily the edge strength, which is equal to the magnitude of the gradient and secondarily edge direction which is equal to the angle of the gradient.
1) Robert Edge Detection operator
The Robert edge detector uses the masks in Figure 1, to approximate digitally the first derivatives as differences between the adjacent pixels. The Robert’s detector is one of the oldest edge detectors in digital image processing and it is also the simplest. This detector is used considerably less than others due to its limited functionality i.e. it is not symmetric and cannot be generalized to detect edges that are multiple of 45 degrees [2].
2) Laplacian of Gaussian Edge Detection operator
Laplacian of Gaussian function is referred to as LoG. The filtering process can be seen as an application of a smoothing filter followed by a derivative operation. The smoothing is performed by a convolution with a Gaussian function. The derivatives applied to a smooth function can be obtained by applying a convolution with the derivative of the convolution mask. One of the interesting characteristics of Gaussian is its circular symmetry which is coherent with the implicit anisotropy. The Laplacian of an image highlights regions of rapid intensity change and is therefore often used for edge detection. The laplacian operator normally takes a single grey level image as input and produces another grey level image as output.
Figure 2: Masks for Laplacian of Gaussian
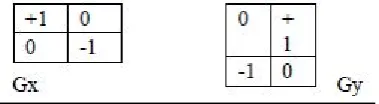
3) Prewitt Edge Detector
The Prewitt edge detector uses the masks in Figure 3, to approximate digitally the first derivatives Gx and Gy.
Figure 3: Masks for Prewitt Operator
The 3X3 total convolution mask is used to detect gradient in the X,Y directions as shown in figure 3. Prewitt filter is a fast method for edge detection. It is only suitable for well contrasted noiseless images.
4) Sobel Edge Detector
Gx Gy
Figure 4: Masks for Sobel Operator
First order derivatives are approximated digitally by differences. The Sobel edge detector computes the gradient by using the following discrete differences between rows
and columns of Figure 4 where the centre pixel in each row or column is weighted by 2 to provide smoothing[2].
The operator consists of a pair of 3x3 convolution kernels s shown in Figure 4 .One kernel is simply the other rotated by 90 degree. These kernels are designed to respond maximally to edges running at 45 degree to the pixel grid. One kernel for each of the two perpendicular orientations. The kernels can be applied separately to the input image to produce measurements of the gradient components in each orientation (call these Gx and Gy). These can then be combined together to find the absolute magnitude of the gradient at each point and the orientation of that gradient[4]. The gradient magnitude is given by:
Although typically an approximate magnitude is computed using:
|
G
|
=
|
Gx
|
+
|
Gy
|
The angle of orientation of the edge giving rise to the special gradient is given by :
5) Canny Edge Detector:
The canny detector is the most powerful edge detector in function edge. The method can be summarized as follows[9]:
1. The image is smoothed using Gaussian filter with a specified deviation sigma, to reduce noise. 2. The local gradient [ gx + gy ]1/2 and edge direction
tan-1(g
x/g/gy), are computed at each point. An edge
point is defined to be a point whose strength is locally maximum in the direction of the gradient. 3. The Edge points determined in (2) give rise to
ridges in the gradient magnitude image. The algorithm then tracks along the top of these ridges and sets to zero all pixels that are not actually on the ridge-top so as to give a thin line in the output, a process known as non-maximal suppression. The ridge pixels are then thresholded by so called hysteresis thresholding, which is based on using two thresholds, T1 and T2, with T1 < T2. Ridge
pixels with values greater then T2 are said to be
“strong” edge pixels. Ridge pixels with values between T1 and T2 are said to be “weak” edge
pixels.
C. Image Steganography
Image steganography,is one kind of steganographic system where the secret message is hidden in a digital image with some kind of hiding strategy. The conventional image steganographic algorithm is the Least Significant Bit(LSB) algorithm, the advantage of LSB is its simplicity to embed the bits of the message directly into the LSB plane of the cover image and many applications use this method. The storage of information bits in the Least significant bits of the image does not affect the image in a greater scale and hence the change is not perceived by the Human Visual System(HVS). LSB embedding when applied to the pixels of an image sequentially make it easy for any intruder to uncover the information, hence the bits can be embedded in a random fashion but it causes speckels in the image. Hence to overcome this problem, we have concentrated embedding the message bits within the edge pixels of an image[6].
II. PROPOSED WORK
In this paper we have detected the edge pixels of an input grey scale image by using the edge detection techniques as described earlier. Then we have calculated the optimal threshold value for each and every edge detection technique by using Otsu’s Algorithm. The regions greater than the threshold values where selected for embedding the message bits using the Least Significant bit Algorithm. Then, we compared the output images based on several parameters viz. Peak-Signal-To-Noise Ratio (PSNR), Mean Square Error (MSE) , Visibility, Normalized Coefficient(NC) ,Histogram Processing. Based on these results we have concluded the best Edge Detection technique for Image Steganography using the LSB Algorithm.
III. ALGORITHM AND PAREMETERS
A. Least Significant Bit Embedding
Embedding technique in the algorithm is based on replacing the LSB of the pixel (I(i,j)) with the message bits one by one. Hence if the message is equivalent to m-bits there are m-pixels to deal with, whose least significant bits will be replaced by the m-message bits. The embedding procedure can be described using the equation as follows:
In general, a p-by-q image is simply a p-by-q matrix, where each entry in the matrix is a positive integer called the pixel
value, which determine the color of that pixel. For an n-bit image, these pixel values range from 0 to 2n − 1. In other
words, the possible color values for each pixel in an n-bit image are the colors corresponding to the bit strings of length n. Unless there is a specific need to use the bit string representations of pixel values, we will typically use the decimal representations. In this paper, we talk primarily about 8-bit grayscale images. These images are thus p-by-q matrices of integers ranging from 0 to 255, where 0 corresponds to black, 255 to white, and the values in between form a spectrum of varying shades of grey (i.e., darker shades nearer 0 and lighter shades nearer 255). The least significant bit (LSB) is the bit corresponding to 20, that is, the bit that makes a value even or odd. Since these grayscale values form a spectrum ranging in order from dark to light, each grey value varies little from the values on either side of it. For example, the grey value 100 varies little from the grey values 99 or 101. Therefore, changing the LSB creates an imperceptible change in the image.
Algorithm:
Step 1: Read the cover image and text message which is to be hidden in the cover image.
Step 2: Convert text message in binary.
Step 3: Calculate LSB of each pixels of cover image.
Step 4: Replace LSB of cover image with each bit of secret message one by one.
Step 5: Write stego image
Step 6: Calculate the Payload Capacity, Mean square Error (MSE), Peak signal to noise ratio (PSNR) of the stego image.
B. Least Significant bit Extraction
Algorithm:
Step 1: Read the stego image.
Step 2: Calculate LSB of each pixels of stego image.
Step 3: Retrieve bits and convert each 8 bit into character.
C. Otsu’s Algorithm for Optimal Thresholding
In Computer Vision and Image Processing Otsu’s method is used to automatically perform cluster based image thresholding or the reduction of a grey level image to a binary image. The algorithm assumes that the image to be thresholded contains two classes of pixels or bimodal histogram then calculates the optimum threshold separating those two classes so that their combined spread is minimal [8]. The algorithm can be summarized as:
2. Setup initial class probability computed from the histogram and class mean.
3. Step through all possible thresholds
i. Update class probability and class mean ii. Compute intra-class variance
4. Desire threshold corresponds to the maximum intra-class variance.
5. Compute two maxima and two corresponding
thresholds, T1 and T 2.
6. Desired threshold =(T1+T2)/2
D. Parameters used for comparison 1) Peak Signal to noise ratio(PSNR)
PSNR is an engineering term between the maximum possible power of a signal and the power of corrupting noise that affects the fidelity of its representation. PSNR here refers to the ratio between the stego-image i.e. the image which has been embedded and the cover-image i.e. the original image.PSNR can be evaluated by using the following equation:
2) Mean Square Error (M.S.E)
The Mean squared error of an estimator measures the average of the squares of the ‘’errors’’, i.e. the difference between the estimator and what is estimated. The difference occurs because of randomness or because the estimator does not account for information that could produce a more accurate estimate. The MSE varies inversely with the PSNR. The M.S.E can be calculated from the following equation:
Where I1 (m, n) and I2 (m, n) are the stego and cover
images respectively and M, N are the dimensions of the image.
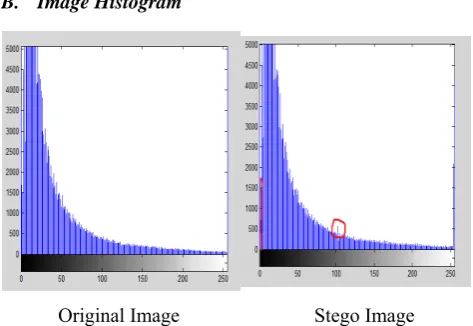
3) Image Histogram
An image histogram is a type of histogram that acts as a graphical representation of the tonal distribution in a digital image. It plots the number of pixels for each tonal value. By looking at the histogram for a specific image a viewer will be able to judge the entire tonal distribution at a glance.
In the field of computer vision image histograms can be useful tools for thresholding because the information contained in the graph is a representation of pixel distribution as a function of tonal variation, image histograms can be analysed for peaks or valleys which can be used to determine a threshold value. This threshold value can then be used for edge detection, image segmentation and co-occurrences matrices.
4) Payload Capacity
It is the size of data in a cover image that can be modified without detoriating the integrity of the cover image. The steganography embedding operation needs to preserve the statistical properties of the cover image in addition to its perceptual quality. Therefor capacity depends on the total number of bits per pixel and the number of bits embedded in each pixel. Capacity is represented by bits per pixel and the Maximum Hiding Capacity.
IV. EXPERIMENTAL RESULTS
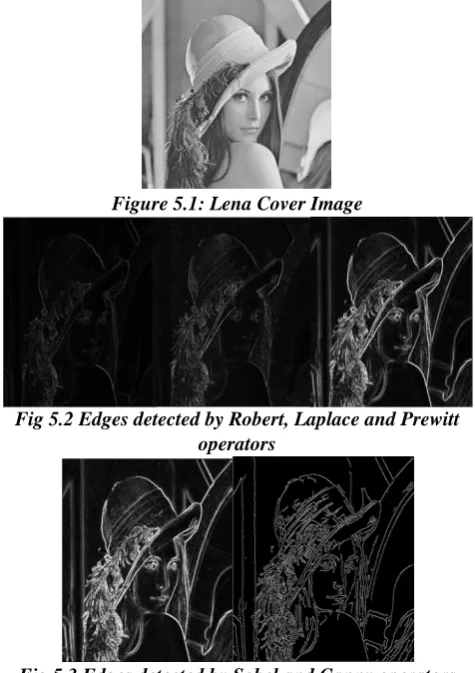
In this section we perform a detailed analysis on a number of input portable graymap images viz. Lena and apply the edge detection techniques viz. Robert, Laplace, Sobel, Prewitt and Canny. After the edges were detected we used the Otsu’s Thresholding Techniques to determine the threshold value for every technique implemented. Following that the LSB algorithm was implemented to hide the message ’’The quick brown fox jumps over the lazy dog’’ (repeated as many times according to the payload capacity) inside the values greater than the optimal threshold value (values that represent the near white pixels). The output stego-images for each technique were compared on the grounds of Payload Capacity, PSNR, M.S.E and histogram and hence a conclusion has been reached regarding the efficiency of each detection technique for data hiding.
Figure 5.1: Lena Cover Image
Fig 5.2 Edges detected by Robert, Laplace and Prewitt operators
Table 1.1 Showing values of parameters for Lena after embedding the message
Technique Payload Capacity PSNR M.S.E
Robert Very Low 62.6543 0.0353
Laplace Low 60.893 0.0529
Prewitt Medium High 60.7181 0.0551
Sobel High 60.601 0.0566
Canny Very High 58.487 0.0611
A. Result Analysis
On careful observation of Table 1.1 it can be seen that the payload capacity for Robert edge detection technique comes with a very low value. On the contrary as we proceed further down the table we find that the capacity increases for Laplace, Prewitt, and Sobel and is highest for the Canny Edge detection method. Hence it can be inferred that the maximum amount of data can be hidden within the edges obtained from canny detection. As more data can be embedded inside canny edges, the larger is the change in the pixel values, hence lower will be the PSNR values, since PSNR gives the ratio between the stego image to that of the cover image, the stego-image has the possibility of having more data resulting in a greater M.S.E. If we observe the same for the other detection techniques we can find that their payload capacity is lower than that of the Canny Edge Detection method and on the contrary lesser data can be incorporated. It is important to note that the amount of information that has been embedded for each technique is nearly equal to the payload capacity of the respective image edges. The input image Lena gives the best experimental results out of the image set that we have considered and hence we have given the output data particularly for this image.
B. Image Histogram
Original Image Stego Image
Fig 6.1 Image histogram comparison for Sobel embedding
Original Image Stego image
Fig 6.2 Image histogram comparison for Robert embedding
The Image Histograms shown in Fig 6.1 and 6.2 represent the Sobel and Robert Edge detectors before and after data embedding. Careful observation of the Sobel histograms indicates that the payload capacity for Sobel is much higher than that of the Robert histograms. This is also evident from the volume of blue lines that are present in the two. The regions marked with red represent the changes in the histogram after data had been inserted.
V. CONCLUSION
We have implemented the above work using MATLAB 2013b.With regard to the above results computed we can successfully infer that the Canny Edge Detection technique is best suitable for large amount of data hiding since it comes with a high Payload Capacity and subsequently a lower PSNR value and a higher M.S.E. In our daily lives we deal with large volumes of sensitive data that can be covertly transferred through images without creating a suspicion. Hence the Canny edge detection technique serves as an important tool since it can accommodate any length of message from a mere small value to its payload capacity. Moreover if an intruder comes to know about data hidden in an image, he or she will not be able to know the pattern in which data has been hidden without prior knowledge of the various edge detection techniques which have a randomness in their bit assignment. Also important to note that the canny edge detection technique the chances of data getting not embedded is low than that of Robert, Laplace etc. operators. In conclusion it can be said that the canny operator serves as a powerful data hiding technique in the field of image steganography.
REFERENCES
[1] Nitin Jain, Sachin Meshram, Shikha Dubey, ”Image Steganography using LSB and Edge Detection Technique”,IJCSE,July 2012. [2] R. C. Gonzalez and R. E. Woods. “Digital Image Processing”. 2nd
ed.Prentice Hall, 2002.
[4] Raphael C.-W. Phan, H.-C. Ling, “Steganalysis of Random LSB Insertion using Discrete Logarithms proposed at CITA03”.
[5] G.T. Shrivakshan, Dr.C. Chandrasekar,” A Comparison of various
Edge Detection Techniques used in Image Processing”, IJCSI,
Spetember 2012, Vol. 9.
[6] M. Pavani, S. Naganjaneyulu, C. Nagaraju , “A Survey on LSB Based Steganography Methods”, IJECS, Aug 2013, Vol. 2, Issue 8.
[7] Stuti Goel, Arun Rana, Manpreet Kaur, “ Comparison of Image
Steganography Techniques”, IJCDS, Apr-May 2013, Vol. 3 , Issue 1. [8] Nobuyuki Otsu, “A Threshold Selection method for grey level
histograms”, IEEE Trans. Sys. Man. Cyber ,1979, 9(1):62-66.
[9] J. F. Canny. “A computational approach to edge detection”. IEEE Trans.
Pattern Anal. Machine Intell., vol. PAMI-8, no. 6, pp. 679-697, 1986. [10] E. Argyle. “Techniques for edge detection,” Proc. IEEE, vol. 59, pp.
285-286, 1971.
[11] T. Peli and D. Malah. “A Study of Edge Detection Algorithms”. Computer Graphics and Image Processing, vol. 20, pp. 1-21, 1982.