Cancer Management and Research 2018:10 625–635
Cancer Management and Research
Dove
press
submit your manuscript | www.dovepress.com 625
O R I G I N A L R E S E A R C H
open access to scientific and medical research
Open Access Full Text Article
Prognostic significance of leukopenia during
the induction phase in adult B cell acute
lymphoblastic leukemia
Chongyun Xing1,*
Bin Liang1,*
Junqing Wu1
Qianqian Yang1
Gang Hu1
Ye Yan1
Yu Zhang1
Songfu Jiang1
Kang Yu1
Jianhua Feng1,2
1Division of Hematology, The First
Affiliated Hospital of Wenzhou Medical University, Wenzhou, PR China; 2Division of Pediatric
Hematology-Oncology, The First Affiliated Hospital of Wenzhou Medical University, Wenzhou, PR China
*These authors contributed equally to this work
Abstract:The association between chemotherapy-induced leukopenia and clinical outcome has been reported for several types of cancer. The objective of the current study was to evaluate the association of chemotherapy-induced leukopenia during the induction phase with the clinical outcome of adult B cell acute lymphoblastic leukemia (B-ALL). Fifty-one cases of B-ALL, age ≥14 years, were reviewed. The variables under consideration included age, sex, the initial white blood cell (WBC) count (WBC-0), as well as the WBC counts on days 8 (WBC-8), 15 (WBC-15), and 22 (WBC-22) during induction therapy, early bone marrow responses on day 15 during induction therapy, immunophenotype, and cytogenetics. Univariate analysis revealed that WBC-15 ≥0.40×10⁹/L was significantly associated with inferior event-free survival (EFS)
(hazard ratio [HR]=2.95, P=0.004) and overall survival (OS) (HR=2.92, P=0.015). On multi-variate analysis, high WBC-15 (≥0.40×10⁹/L) remained an independent prognostic factor for
EFS (HR=3.29, P=0.014) and OS (HR=3.29, P=0.038). Our results suggested that WBC-15 may contribute to refinements in the current risk stratification algorithms for adult B-ALL.
Keywords:adult acute lymphoblastic leukemia, chemotherapy, white blood cell count, prog-nosis, survival
Introduction
Acute lymphoblastic leukemia (ALL) is a relatively infrequent malignant hematopoietic neoplasm in adolescents and adults. Despite significant improvements in the manage-ment of pediatric ALL patients, because of the contemporary risk-adapted treatmanage-ment and improved supportive care, for whom long-term survival approaches 90%, the long-term survival rates for adults with ALL remain poor at 40%.1,2 Refinement of the current risk stratification for predicting clinical outcome of this disease is important because treat-ments can be optimized on the basis of accurate estimation of outcome. Current ALL therapeutic regimens risk-stratify patients based on the patient clinical features (such as age and white blood cell [WBC] count at diagnosis), tumor biologic features (such as immunophenotype, cytogenetic profile, and molecular genetic profile), and early response to initial chemotherapy.3–6 However, identification of additional prognostic markers is still needed to permit better risk stratification, promote the development of novel therapies, as well as improve the outcome of this disease.
Hematologic toxicity (leukopenia, thrombocytopenia, and anemia) is the most common dose-limiting side effect of combination chemotherapy in the treatment of acute leukemia. Despite the use of similar chemotherapy regimens, the degree of acute hematotoxicity among patients is heterogeneous. Several studies have Correspondence: Jianhua Feng; Kang Yu
Division of Hematology, The First Affiliated Hospital of Wenzhou Medical University, No. 2 Fuxue Lane, Wenzhou 325000, Zhejiang, PR China
Tel +86 577 5557 8999 ext 669889 Fax +86 577 5557 8999
Email wzfjh@126.com; yukang62@126.com
Journal name: Cancer Management and Research Article Designation: ORIGINAL RESEARCH Year: 2018
Volume: 10
Running head verso: Xing et al
Running head recto: Prognostic significance of leukopenia DOI: http://dx.doi.org/10.2147/CMAR.S158359
Cancer Management and Research downloaded from https://www.dovepress.com/ by 118.70.13.36 on 20-Aug-2020
For personal use only.
Dovepress Xing et al
suggested that chemotherapy-induced hematotoxicity might be used as a measure of the biologic activity of cytotoxic drugs.7 The degree of hematotoxicity caused by cytotoxic drugs is probably influenced by the known pharmacokinetic parameters, which reflect individual metabolism and elimination capabilities,8 and thus may cor-relate with the systemic availability of chemotherapeutic drugs.9 Furthermore, the correlation between hematotox-icity and disease control has been investigated in several diseases. Studies of adjuvant treatment in breast cancer have shown that patients who had increased hematotoxicity during treatment had better clinical outcome than did those whose hematotoxicity was less severe.10–13 Additionally, chemotherapy-induced myelosuppression has also been described to be linked to the clinical outcome in patients with testicular cancer,14 ovarian cancer,15 non-small-cell lung cancer,16 and lymphoma.17,18 More relevantly, the degree of myelosuppression during maintenance therapy has been shown to be associated with the risk of relapse in adolescents with intermediate-risk B cell ALL (B-ALL).19 Furthermore, chemotherapy-induced leukopenia during the consolidation phase has only recently been shown to correlate with relapse-free survival in childhood high-risk ALL.20 However, the influence of chemotherapy-induced leukopenia during the induction phase on the clinical out-come of adult B-ALL patients has not been established.
The objective of the current study was to evaluate the pos-sible association between chemotherapy-induced leukopenia during the induction phase and clinical outcome in a cohort of 51 adult patients with newly diagnosed B-ALL.
Patients and methods
Patients
Patients were enrolled in the study if they were 14 years of age or older, diagnosed with B-ALL, treated at the First Affiliated Hospital of Wenzhou Medical University between February 2010 and June 2016, and had adequate medical records avail-able for review. B-ALL was diagnosed based on standard criteria, which included morphologic, immunophenotypic, and cytogenetic features. The definition and assessment for adult ALL were determined according to NCCN Guideline Version 1.2014 Acute Lymphoblastic Leukemia.21 The study was reviewed and approved by the Institutional Review Board of the First Affiliated Hospital of Wenzhou Medical University. The requirement for patient informed consent was waived by the Institutional Review Board because of the retrospective nature of this study, but patient confidentiality was protected.
Medical records were reviewed to determine age, sex, initial WBC count (WBC-0), as well as the WBC counts on days 8 (WBC-8), 15 (WBC-15), and 22 (WBC-22) during induction therapy, early bone marrow (BM) responses on day 15 during induction therapy, immunophenotype, and cyto-genetics. The value for WBC count was obtained from the clinical laboratory records, and was determined either by the hematology automatic analyzer Sysmex XE-2100 ( Sysmex, Kobe, Japan) or manual differential (in cases flagged for abnormal values). Early BM responses to treatment on day 15 of induction therapy, evaluated using routine cytologic examination, were defined as M1, M2, or M3 marrow if the residual blast percent was <5, 5–25, or >25, respectively, regardless of cellularity.
For the cytogenetic study, BM samples at diagnosis were obtained and systematically examined by R- and/or G-banding techniques. The criteria of the International System for Human Cytogenetic Nomenclature22 were employed for karyotype descriptions. Risk status based on cytogenetics was defined as follows: favorable: 12p and 14q11 rearrangements, hyperdiploidy (51–65 chromosomes); unfavorable: t(9;22) (q34;q11.2):BCR/ABL1, t(v;11q23):MLL rearrangement, t(1;19) (q23;p13.3):E2A/AML1, hypodiploidy (<44 chro-mosomes), complex karyotype (5 or more chromosomal abnormalities); and intermediate: abnormalities other than those in categories favorable or unfavorable.23–25
Treatment
Figure 1 shows the flow chart with treatment and outcome of the patients. All patients received 4-week induction therapy with VDCP±L (vincristine 1.5 mg/m2 or vindesine 4 mg, days 1, 8, 15, and 22; daunorubicin 45 mg/m2 or idarubicin 8 mg/ m2, days 1–3; cyclophosphamide 600–750 mg/m2, days 1 and/or 15; prednisone 60 mg/m2, days 1–21). A supplement of 6,000 IU/m2 l-asparaginase every other day was added on days 19–29 when BM blasts persisted >5% on day 15. Eighteen patients with Philadelphia-positive ALL received an extra 400 mg/day imatinib or 140 mg/day dasatinib. After induction, the response was evaluated following the recom-mendation by NCCN Guidelines. Thirty-nine patients after the first induction therapy achieved complete remission (CR), which was defined as the absence of detectable leukemia cells in blood smears, a BM with active hematopoiesis and <5% leukemia blast cells, and without extramedullary disease. Two patients died during induction because of treatment toxicity. Of the remaining 10 patients who did not achieve CR after the first induction therapy, 9 patients received a second course of induction therapy with VDCP±L and 1 patient was
Cancer Management and Research downloaded from https://www.dovepress.com/ by 118.70.13.36 on 20-Aug-2020
Dovepress Prognostic significance of leukopenia
administered a second-line induction, FLAM (fludarabine, cytarabine, and mitoxantrone). Eight out of 10 patients achieved CR after the second induction therapy; 1 patient died of infection during the second induction therapy and the remaining 1 patient was refractory. For 47 patients who achieved CR after 1 or 2 induction therapies, consolidation therapy26 alternating with high-dose methotrexate or cytara-bine followed. Early relapses were observed in 7 patients, and 2 died because of treatment toxicity. Among the 38 patients in CR, after consolidation, allogeneic hematopoietic stem cell transplantation (HSCT) was performed in 15, and the remaining 23 underwent maintenance therapy. Central ner-vous system prophylaxis consisted of intrathecal therapy with methotrexate, cytarabine, and dexamethasone administered twice during the induction therapy as well as once during each consolidation. Overall 27 patients died; 10 as a conse-quence of the therapy (3 in induction, 2 in consolidation, 4
in maintenance, and 1 as a consequence of the HSCT) and 17 because of disease progression. Twenty-one patients are currently alive in remission (Figure 1).
Statistical analysis
Receiver operating characteristic (ROC) curves were derived from the WBC values and survival status. In an ROC curve, the sensitivity and specificity were calculated by combining the optimal cut-off value and survival outcome. Categorical covariates were compared using the chi-square test or Fisher’s exact test and numerical covariates were compared using the Wilcoxon rank-sum test. Event-free survival (EFS) was calculated from the initiation of the treatment to the date of first event (induction failure, relapse, second malignancy, or death from any cause) occurrence or last follow-up. Induction failure was defined as non-CR at the end of the first induction therapy. In the case of induction failure, EFS
Figure 1 Flow chart of the patients.
Abbreviations: CR, complete remission; HSCT, hematopoietic stem cell transplantation.
Death (N=2)
CR (N=39) Non-CR (N=10)
Re-induction (N=10)
Death (N=1)
Death (N=2)
Relapse (N=7)
Post-consolidation (N=38)
Maintenance (N=23) HSCT (N=15)
Death (N=1)
Relapse (N=4) Alive in remission
(N=10) Alive in remission
(N=11) Death (N=4)
Relapse (N=8)
Resistant (N=1) CR (N=8)
Consolidation (N=47) Diagnosis (N=51)
Induction (N=51)
Cancer Management and Research downloaded from https://www.dovepress.com/ by 118.70.13.36 on 20-Aug-2020
Dovepress Xing et al
was set to the first day. Overall survival (OS) was computed from the date of the start of the induction therapy until the date of death from any cause or the last follow-up. EFS and OS were estimated by Kaplan–Meier analysis and compared using the log-rank test. Univariate and multivariate analyses with the Cox proportional hazards model were performed to evaluate the potential risk factors for EFS and OS. Variables with P-value <0.15 in the univariate analysis were included in the multivariate Cox proportional hazards model. All tests were 2-sided and P-value <0.05 was considered to indicate significance. Stata version 12 software (StataCorp LP, Col-lege Station, TX, USA) was used for all statistical analyses.
Results
Cut-off value for WBC-15
The potential prognostic factors were initially chosen in an unbiased manner using the median values of WBC counts at different time points during induction therapy as cut-off values. The median values for the initial WBC count as well as WBC-8, WBC-15, and WBC-22 were 11.50, 0.60, 0.39, and 2.40×10⁹/L, respectively. Kaplan–Meier analysis (log-rank test) showed that only WBC-15 was associated with both EFS (P=0.0013) and OS (P=0.0046) when a cut-off point of median value was used. In addition, the ROC curve was also performed to analyze the correlation between different WBC count levels during induction therapy and the survival status of death/survival. The areas under the ROC curve for WBC-0, WBC-8, WBC-15, and WBC-22 were 0.560 (95% CI: 0.397–0.723), 0.419 (95% CI: 0.257–0.581), 0.759 (95% CI: 0.616–0.901), and 0.655 (95% CI: 0.496–0.813), indicating that only WBC-15 was predictive of survival. The optimal cut-off value for WBC-15 was 0.40×10⁹/L, yielding sensitivity and specificity for predicting survival of 74.07% and 79.17%, respectively. Thus, we chose the WBC-15 with a cut point of 0.40×10⁹/L, quite close to the median value of WBC-15, as a threshold value to discriminate patients with different probabilities of survival at the interim of induction therapy.
Patient characteristics
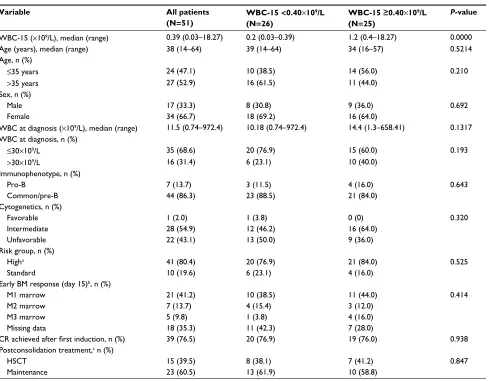
Patient characteristics are summarized in Table 1. Fifty-one patients were evaluable. The median age was 38 years (range: 14–64 years) with 17 (33.3%) males. The median WBC count at diagnosis was 11.5×10⁹/L (range: 0.74–972.4×10⁹/L). Two percent of patients (N=1) had favorable karyotype, 54.9% (N=28) intermediate karyotype, and 43.1% (N=22) unfa-vorable karyotype. A total of 26 and 25 patients showed low (<0.40×10⁹/L) and high WBC-15 (≥0.40×10⁹/L), respectively.
Although WBC-15 <0.40×10⁹/L was more correlated with lower WBC count at diagnosis, no statistical significance was observed (P>0.05). In addition, no relationship was shown between WBC-15 and the percentage of residual BM blasts on day 15 of induction therapy (P=0.414).
Prognostic impact of WBC-15
A total of 33 events occurred during the present study: 10 in the WBC-15 <0.40×10⁹/L group (5 induction failures, 4 relapses, and 1 nonrelapse mortality) and 23 in the WBC-15
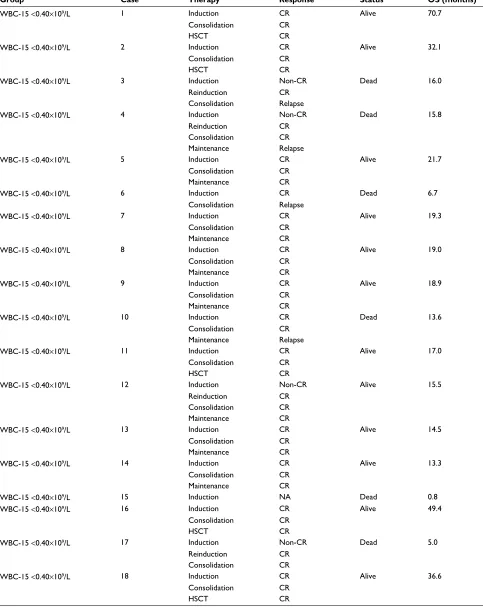
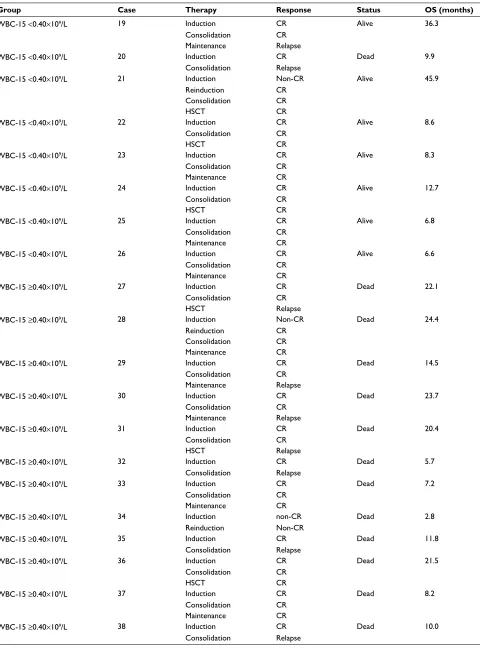
≥0.40×10⁹/L group (5 induction failures, 13 relapses, and 5 nonrelapse mortalities). With a median follow-up duration of 15.5 months (range: 0.8–70.7), the 3-year EFS and OS rates estimated for the entire cohort were 21.9% and 30.1%, respectively. The detailed information regarding treatment and follow-up of the 51 adult B-ALL patients is shown in Table S1.
Kaplan–Meier analysis showed that the patients with WBC-15 <0.40×10⁹/L had a significantly superior EFS and OS: the 2-year EFS estimate was 52.0%±13.9% (N=26, 95% CI: 23.3%–74.5%) vs. 4.3%±4.2% (N=25, 95% CI: 0.3%–18.2%) for the patients with WBC-15
≥0.40×10⁹/L (P=0.0020; Figure 2A); the 3-year OS esti-mate was 66.4%±10.8% (N=26, 95% CI: 41.1%–82.8%) vs. 11.2%±7.1% (N=25, 95% CI: 2.1%–29.0%) for the patients with WBC-15 ≥0.40×10⁹/L (P=0.0111; Figure 2B).
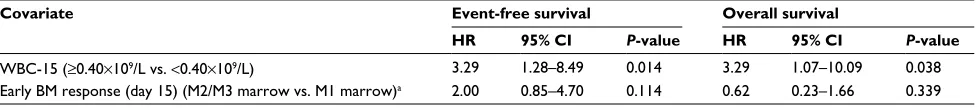
Results of the univariate and multivariate analyses for fac-tors associated with EFS and OS are presented in Tables 2 and 3, respectively. The univariate analysis showed that WBC-15
≥0.40×10⁹/L was significantly associated with inferior EFS (hazard ratio [HR]=2.95, 95% CI: 1.40–6.23, P=0.004) and OS (HR=2.92, 95% CI: 1.23–6.93, P=0.015; Table 2). Among the other factors included in univariate analysis, although early BM responses on day 15 during induction therapy (M2/M3 marrow vs. M1 marrow) were correlated with EFS (Table 2), no statistical significance was observed (P=0.102). Multivariate analysis that included all the parameters with
P-value <0.15 in univariate analysis revealed that the high WBC-15 (≥0.40×10⁹/L) was independently associated with shorter EFS (HR=3.29, 95% CI: 1.28–8.49, P=0.014) and OS (HR=3.29, 95% CI: 1.07–10.09, P=0.038; Table 3).
Discussion
The association between chemotherapy-induced leukopenia and clinical outcome has been previously reported for several types of chemosensitive malignancies.10–18 This retrospective analysis was carried out in order to study a possible cor-relation between the development of leukopenia during the
Cancer Management and Research downloaded from https://www.dovepress.com/ by 118.70.13.36 on 20-Aug-2020
Dovepress Prognostic significance of leukopenia
induction phase and clinical outcome in adult B-ALL patients treated with unified induction regimens. Our analysis shows that the patients with a low WBC (<0.40×10⁹/L) at the interim of induction therapy have a significantly superior EFS and OS. This provides additional prognostic information that may be used to further refine current risk stratification strat-egies for adult B-ALL. Han et al previously reported that a leukocyte nadir of >0.12×10⁹/L in the induction phase was associated with poor OS in older adults with acute myeloid leukemia, although no statistically significant difference was observed.27 This is consistent with our current findings.
ALL can be identified by a combination of morphologic, cytochemical, immunophenotypic, cytogenetic, and molecu-lar assays. However, risk assessment of ALL patients should consider a range of clinical, biologic, and genetic features, such as age, initial WBC, immunophenotypic, cytogenetic,
and molecular characteristics,3–6 as well as the response to therapy assessed with the minimal residual disease (MRD) clearance, which is currently shown to be the most important prognostic factor for ALL at any age.28 In childhood ALL, the observation that a rapid drop in peripheral WBCs and circulating lymphoblasts on day 8 of induction is a favorable prognostic factor was described many years ago.29 Our cur-rent study confirmed a similar finding in the setting of adult B-ALL, where a low WBC (<0.40×10⁹/L) at the interim of induction therapy can portend a superior prognosis.
A possible explanation for the observed association between chemotherapy-induced leukopenia and clinical outcome is that the absence of leukopenia may suggest a lack of efficacy of cytostatic drugs administered. It is proposed that the bioavailability of cytotoxicity drug is affected by pharmacokinetic factors, which produce a similar effect Table 1 Patient characteristics in adult B-ALL cohorts
Variable All patients
(N=51)
WBC-15 <0.40×10⁹/L
(N=26)
WBC-15 ≥0.40×10⁹/L
(N=25)
P-value
WBC-15 (×109/L), median (range) 0.39 (0.03–18.27) 0.2 (0.03–0.39) 1.2 (0.4–18.27) 0.0000
Age (years), median (range) 38 (14–64) 39 (14–64) 34 (16–57) 0.5214
Age, n (%)
≤35 years 24 (47.1) 10 (38.5) 14 (56.0) 0.210
>35 years 27 (52.9) 16 (61.5) 11 (44.0)
Sex, n (%)
Male 17 (33.3) 8 (30.8) 9 (36.0) 0.692
Female 34 (66.7) 18 (69.2) 16 (64.0)
WBC at diagnosis (×109/L), median (range) 11.5 (0.74–972.4) 10.18 (0.74–972.4) 14.4 (1.3–658.41) 0.1317
WBC at diagnosis, n (%)
≤30×109/L 35 (68.6) 20 (76.9) 15 (60.0) 0.193
>30×109/L 16 (31.4) 6 (23.1) 10 (40.0)
Immunophenotype, n (%)
Pro-B 7 (13.7) 3 (11.5) 4 (16.0) 0.643
Common/pre-B 44 (86.3) 23 (88.5) 21 (84.0)
Cytogenetics, n (%)
Favorable 1 (2.0) 1 (3.8) 0 (0) 0.320
Intermediate 28 (54.9) 12 (46.2) 16 (64.0)
Unfavorable 22 (43.1) 13 (50.0) 9 (36.0)
Risk group, n (%)
Higha 41 (80.4) 20 (76.9) 21 (84.0) 0.525
Standard 10 (19.6) 6 (23.1) 4 (16.0)
Early BM response (day 15)b, n (%)
M1 marrow 21 (41.2) 10 (38.5) 11 (44.0) 0.414
M2 marrow 7 (13.7) 4 (15.4) 3 (12.0)
M3 marrow 5 (9.8) 1 (3.8) 4 (16.0)
Missing data 18 (35.3) 11 (42.3) 7 (28.0)
CR achieved after first induction, n (%) 39 (76.5) 20 (76.9) 19 (76.0) 0.938
Postconsolidation treatment,c n (%)
HSCT 15 (39.5) 8 (38.1) 7 (41.2) 0.847
Maintenance 23 (60.5) 13 (61.9) 10 (58.8)
Notes: aHigh-risk group was defined by the presence of at least 1 of the following parameters: age >35 years, WBC count at diagnosis >30×109/L, pro-B phenotype, 2 courses
of induction required to achieve CR, and unfavorable cytogenetic features. bEarly BM responses to the treatment on day 15 of induction therapy were defined as follows: M1 marrow <5%, M2 marrow ≤25% and ≥5%, M3 marrow >25%. cOnly patients who completed consolidation in CR are considered.
Abbreviations: B-ALL, B cell acute lymphoblastic leukemia; BM, bone marrow; CR, complete remission; HSCT, hematopoietic stem cell transplantation; WBC, white blood cell; WBC-15, WBC count on day 15.
Cancer Management and Research downloaded from https://www.dovepress.com/ by 118.70.13.36 on 20-Aug-2020
Dovepress Xing et al
against both malignant and normal cells. Patients who experi-ence low acute hematologic toxicity probably achieve lower concentrations of the cytostatic drugs because of greater drug metabolism and elimination capabilities. The correla-tion between the concentracorrela-tion of the cytostatic drugs and anticancer effect has been previously reported.30–32 With lower concentrations of the cytostatic drugs, reduced disease control may be expected. Not surprisingly then, hematologic
toxicity, reflecting the ability of individual patients to metabo-lize antileukemic drugs, correlates with the prognosis of ALL. Wide interindividual variability in pharmacokinetics of most cytotoxic drugs has been described, for example, for doxo-rubicin, cyclophosphamide, ifosfamide, and others.33,34 The variation may be partially due to patient characteristics such as age, body mass index,35 and impaired liver and/or kidney function,36 but may also be due to genetic background.37
Figure 2 Kaplan–Meier estimates of EFS and OS in adult patients with B cell acute lymphoblastic leukemia.
Notes: Patients with a WBC-15 <0.40×10⁹/L vs. patients with a WBC-15 ≥0.40×10⁹/L. (A) The 2-year EFS was 52.0%±13.9% (N=26, 95% CI: 23.3%–74.5%) vs. 4.3%±4.2%
(N=25, 95% CI: 0.3%–18.2%), respectively, P=0.0020. (B) The 3-year OS was 66.4%±10.8% (N=26, 95% CI: 41.1%–82.8%) vs. 11.2%±7.1% (N=25, 95% CI: 2.1%–29.0%), respectively, P=0.0111. P-values were based on the log-rank test. WBC-15 indicates WBC count on day 15 during induction therapy.
Abbreviations: EFS, event-free survival; OS, overall survival; WBC, white blood cell.
20 40 60 80
0 0
0.00 P=0.0020 P
=0.0111 0.25
0.50
Event-free surviva
l 0.75 1.00
A B
WBC-15<0.4 WBC-15≥0.4 WBC-15<0.4 WBC-15≥0.4
0.00 0.25 0.50
Overall surviva
l
0.75 1.00
20 40
Survival time (months) Survival time (months)
60 80
Table 2 Univariate analysis for event-free and overall survival
Variables Event-free survival Overall survival
HR 95% CI P-value HR 95% CI P-value
WBC-15 (×109/L) (≥0.40 vs. <0.40) 2.95 1.40–6.23 0.004 2.92 1.23–6.93 0.015
WBC at diagnosis (×109/L) (>30 vs. ≤30) 1.34 0.63–2.83 0.442 1.42 0.63–3.18 0.394
Sex (female vs. male) 0.98 0.47–2.03 0.951 0.71 0.32–1.55 0.386
Age (years) (>35 vs. ≤35) 0.93 0.47–1.86 0.837 1.38 0.64–2.96 0.406
Cytogenetics (unfavorable vs. other) 0.96 0.48–1.94 0.917 0.81 0.37–1.78 0.608
Immunophenotype (Pro-B vs. common/pre-B) 0.43 0.13–1.40 0.161 0.43 0.10–1.81 0.248
Early BM response (day 15) (M2/M3 marrow vs. M1 marrow)a 2.03 0.87–4.73 0.102 0.70 0.26–1.88 0.480
Risk group (high vs. standard) 1.50 0.58–3.91 0.407 1.21 0.42–3.55 0.723
Postconsolidation treatment (HSCT vs. maintenance) 0.62 0.25–1.59 0.322 0.49 0.16–1.44 0.191
Notes: aOnly including 33 patients with available data on early BM response at day 15 of the induction therapy.
Abbreviations: BM, bone marrow; HR, hazard ratio; HSCT, hematopoietic stem cell transplantation; WBC, white blood cell; WBC-15, WBC count on day 15.
Table 3 Multivariate analysis for event-free and overall survival
Covariate Event-free survival Overall survival
HR 95% CI P-value HR 95% CI P-value
WBC-15 (≥0.40×10⁹/L vs. <0.40×10⁹/L) 3.29 1.28–8.49 0.014 3.29 1.07–10.09 0.038
Early BM response (day 15) (M2/M3 marrow vs. M1 marrow)a 2.00 0.85–4.70 0.114 0.62 0.23–1.66 0.339
Notes: aOnly including 33 patients with available data on early BM response at day 15 of the induction therapy.
Abbreviations: BM, bone marrow; HR, hazard ratio; WBC, white blood cell; WBC-15, WBC count on day 15.
Cancer Management and Research downloaded from https://www.dovepress.com/ by 118.70.13.36 on 20-Aug-2020
Dovepress Prognostic significance of leukopenia
A number of drug-metabolizing enzymes including Phase I activation enzymes and Phase II detoxification enzymes form complex pharmacokinetic systems, which determine the effective dose of antileukemic drugs delivered to target cells. The activities of these drug-metabolizing enzymes are affected by gene polymorphisms, which present with individual differences.8 We speculate that, in the process of leukemia treatment, the detection of genetic polymorphisms and activities of drug-metabolizing enzymes, and monitor-ing the blood concentrations of antileukemic drugs might provide objective indicators for prognostic evaluation and treatment interventions (such as dose adjustment and change of chemotherapy protocols) to assist in attaining better treat-ment outcomes.
A second possible explanation for the deleterious effect of high WBC-15 is that blasts may not be cleared from peripheral blood at day 15 of the induction therapy; thus, high WBC-15 may reflect residual blasts and treatment resistance. However, due to the relative ineffectiveness of the hematology automatic analyzer in the proper recognition of abnormal cells and the inaccuracy of manual WBC differen-tial counts for severely leukopenic samples, the information about the WBC differential counts is usually not available in the samples with WBC counts of <0.50×10⁹/L in our depart-ment. Therefore, we could not compare the percentages of peripheral blood blasts between patients with WBC-15 values above and below 0.40×10⁹/L. More sensitive and accurate methods, such as multiparameter flow cytometric methods for WBC differential counts,38,39 are needed to explore the above possibility.
The limitations of the present study include its retrospec-tive nature and the relaretrospec-tively small sample size, and thus het-erogeneity of the data was difficult to rule out. For example, although a unified programmed treatment was given in our patient cohort, it was possible for the dose of chemotherapeu-tic drugs to be adjusted according to the patient’s individual situation, such as with a comorbidity or the susceptibility to serious drug-related toxicity. Therefore, there is no guarantee that each patient has received a sufficient dose of chemo-therapy. In addition, although the WBC-15 with a cut point of 0.40×10⁹/L was confirmed as the strongest predictor of survival outcome of B-ALL patients by ROC curve analysis, the predictive value of the selected variable should be tested in an independent cohort. Therefore, caution should be taken when interpreting the results of the present study; it might be premature to suggest that chemotherapy-induced leukopenia can be used as an independent prognosis factor to be incor-porated into the prognostic models for B-ALL. Prospective
studies with more patients, which can provide more detailed information, are needed to validate our work regarding the prognostic significance of WBC-15. Furthermore, most patients lack the data regarding the MRD status after induc-tion, which is considered to be an important prognostic factor in the modern strategy of adult ALL.40 Therefore, the relationship between WBC-15 and MRD data after induction should be addressed in further studies.
In conclusion, we herein demonstrated that WBC-15 is a simple, significantly prognostic factor in a Chinese adult B-ALL cohort. Due to its advantages of convenience and low cost, WBC-15 may contribute to the refinement of current risk stratification algorithms for adult B-ALL, especially in most developing countries. Larger prospective studies are needed to confirm the existence of a correlation between WBC-15 and clinical outcome in adult B-ALL.
Acknowledgments
This study was supported by grants from the Public Wel-fare Science and Technology Project of Wenzhou (No. Y20160099) and the Natural Science Foundation of Zhe-jiang Province (Nos. LQ14H080002, LY12H08002, and LY16H080006).
Disclosure
The authors report no conflicts of interest in this work.
References
1. Faderl S, O’Brien S, Pui CH, et al. Adult acute lymphoblastic leukemia: concepts and strategies. Cancer. 2010;116(5):1165–1176.
2. Bassan R, Hoelzer D. Modern therapy of acute lymphoblastic leukemia.
J Clin Oncol. 2011; 29(5):532–543.
3. Rowe JM, Buck G, Burnett AK, et al. Induction therapy for adults with acute lymphoblastic leukemia: results of >1500 patients from the international ALL trial: MRC UKALL XII/ECOG E2993. Blood. 2005;106(12):3760–3767.
4. Hoelzer D, Thiel E, Loffler H, et al. Prognostic factors in a multicenter study for treatment of acute lymphoblastic leukemia in adults. Blood. 1988; 71(1):123–131.
5. Le QH, Thomas X, Ecochard R, et al. Initial and late prognostic fac-tors to predict survival in adult acute lymphoblastic leukaemia. Eur J
Haematol. 2006;77(6):471–479.
6. Baccarani M, Corbelli G, Amadori S, et al. Adolescent and adult acute lymphoblastic leukemia: prognostic features and outcome of therapy. A study of 293 patients. Blood. 1982;60(3):677–684.
7. Kvinnsland S. The leucocyte nadir, a predictor of chemotherapy effi-cacy? Br J Cancer. 1999;80(11):1681.
8. Iyer L, Ratain MJ. Pharmacogenetics and cancer chemotherapy. Eur J
Cancer. 1998;34(10):1493–1499.
9. Evans WE, Crom WR, Stewart CF, et al. Methotrexate systemic clear-ance influences probability of relapse in children with standard-risk acute lymphocytic leukaemia. Lancet. 1984;1(8373):359–362. 10. Saarto T, Blomqvist C, Rissanen P, Auvinen A, Elomaa I.
Haematologi-cal toxicity: a marker of adjuvant chemotherapy efficacy in stage II and III breast cancer. Br J Cancer. 1997;75(2):301–305.
Cancer Management and Research downloaded from https://www.dovepress.com/ by 118.70.13.36 on 20-Aug-2020
Dovepress Xing et al
11. Poikonen P, Saarto T, Lundin J, Joensuu H, Blomqvist C. Leucocyte nadir as a marker for chemotherapy efficacy in node-positive breast cancer treated with adjuvant CMF. Br J Cancer. 1999; 80(11):1763–1766. 12. Mayers C, Panzarella T, Tannock IF. Analysis of the prognostic effects of
inclusion in a clinical trial and of myelosuppression on survival after adju-vant chemotherapy for breast carcinoma. Cancer. 2001;91(12):2246–2257. 13. Cameron DA, Massie C, Kerr G, Leonard RC. Moderate neutropenia
with adjuvant CMF confers improved survival in early breast cancer.
Br J Cancer. 2003;89(10):1837–1842.
14. Horwich A, Sleijfer DT, Fossa SD, et al. Randomized trial of bleomy-cin, etoposide, and cisplatin compared with bleomybleomy-cin, etoposide, and carboplatin in good-prognosis metastatic non-seminomatous germ cell cancer: a Multiinstitutional Medical Research Council/European Organization for Research and Treatment of Cancer Trial. J Clin Oncol. 1997;15(5):1844–1852.
15. Rankin EM, Mill L, Kaye SB, et al. A randomised study comparing stan-dard dose carboplatin with chlorambucil and carboplatin in advanced ovarian cancer. Br J Cancer. 1992; 65(2):275–281.
16. Pallis AG, Agelaki S, Kakolyris S, et al. Chemotherapy-induced neu-tropenia as a prognostic factor in patients with advanced non-small cell lung cancer treated with front-line docetaxel-gemcitabine chemotherapy.
Lung Cancer. 2008;62(3):356–363.
17. Brosteanu O, Hasenclever D, Loeffler M, Diehl V. Low acute hemato-logical toxicity during chemotherapy predicts reduced disease control in advanced Hodgkin’s disease. Ann Hematol. 2004;83(3):176–182. 18. Gurney H. How to calculate the dose of chemotherapy. Br J Cancer.
2002;86(8):1297–1302.
19. Schmiegelow K, Heyman M, Gustafsson G, et al. The degree of myelo-suppression during maintenance therapy of adolescents with B-lineage intermediate risk acute lymphoblastic leukemia predicts risk of relapse.
Leukemia. 2010;24(4):715–720.
20. Shiozawa Y, Takita J, Kato M, et al. Prognostic significance of leu-kopenia in childhood acute lymphoblastic leukemia. Oncol Lett. 2014;7(4):1169–1174.
21. National Comprehensive Cancer Network: Fort Washington, USA. Acute Lymphoblastic Leukemia, NCCN Clinical Practice Guidelines in Oncology (NCCN Guidelines®) Version 1, 2014.
22. An International System for Human Cytogenetic Nomenclature (1985) ISCN 1985. Report of the Standing Committee on Human Cytogenetic Nomenclature. Birth Defects Orig Artic Series. 1985;21(1):1–117. 23. Wetzler M. Cytogenetics in adult acute lymphocytic leukemia. Hematol/
Oncol Clin N Am. 2000;14(6):1237–1249.
24. Pullarkat V, Slovak ML, Kopecky KJ, Forman SJ, Appelbaum FR. Impact of cytogenetics on the outcome of adult acute lymphoblastic leukemia: results of Southwest Oncology Group 9400 study. Blood. 2008;111(5):2563–2572.
25. Moorman AV, Harrison CJ, Buck GA, et al. Karyotype is an independent prognostic factor in adult acute lymphoblastic leukemia (ALL): analy-sis of cytogenetic data from patients treated on the Medical Research Council (MRC) UKALLXII/Eastern Cooperative Oncology Group (ECOG) 2993 trial. Blood. 2007;109(8):3189–3197.
26. Stanulla M, Schrappe M. Treatment of childhood acute lymphoblastic leukemia. Semin Hematol. 2009;46(1):52–63.
27. Han HS, Rybicki LA, Thiel K, et al. White blood cell count nadir following remission induction chemotherapy is predictive of outcome in older adults with acute myeloid leukemia. Leuk Lymphoma. 2007; 48(8):1561–1568.
28. Conter V, Bartram CR, Valsecchi MG, et al. Molecular response to treat-ment redefines all prognostic factors in children and adolescents with B-cell precursor acute lymphoblastic leukemia: results in 3184 patients of the AIEOP-BFM ALL 2000 study. Blood. 2010;115(16):3206–3214. 29. Brandalise SR. Prognostic value of day 8 peripheral blood response for children with acute lymphocytic leukemia. In: Zander AR, editor. Gene
Technology: Stem Cell and Leukemia Research. Berlin: Spring-Verlag;
1996:421–428.
30. Preisler HD, Gessner T, Azarnia N, et al. Relationship between plasma adriamycin levels and the outcome of remission induction therapy for acute nonlymphocytic leukemia. Cancer Chemother Pharmacol. 1984;12(2):125.
31. Rodman JH, Abromowitch M, Sinkule JA, Hayes FA, Rivera GK, Evans WE. Clinical pharmacodynamics of continuous infusion teniposide: systemic exposure as a determinant of response in a phase I trial. J Clin
Oncol. 1987;5(7):1007–1014.
32. Evans WE, Crom WR, Abromowitch M, et al. Clinical pharmacody-namics of high-dose methotrexate in acute lymphocytic leukemia. Identification of a relation between concentration and effect. N Engl J
Med. 1986;314(8):471–477.
33. Gurney H. Dose calculation of anticancer drugs: a review of the current practice and introduction of an alternative. J Clin Oncol. 1996;14(9):2590–2611.
34. Hassan M, Svensson US, Ljungman P, et al. A mechanism-based pharmacokinetic-enzyme model for cyclophosphamide autoinduction in breast cancer patients. Br J Clin Pharmacol. 1999;48(5):669–677. 35. Sparreboom A, Wolff AC, Mathijssen RH, et al. Evaluation of alternate
size descriptors for dose calculation of anticancer drugs in the obese.
J Clin Oncol. 2007;25(30):4707–4713.
36. Sulkes A, Collins JM. Reappraisal of some dosage adjustment guide-lines. Cancer Treat Rep. 1987;71(3):229–233.
37. Ekhart C, Rodenhuis S, Smits PH, Beijnen JH, Huitema AD. An over-view of the relations between polymorphisms in drug metabolising enzymes and drug transporters and survival after cancer drug treatment.
Cancer Treat Rev. 2009 35(1):18.
38. Cherian S, Levin G, Lo WY, et al. Evaluation of an 8-color flow cyto-metric reference method for white blood cell differential enumeration.
Cytometry B Clin Cytom. 2010;78(5):319–328.
39. Yu C, Kong QL, Zhang YX, et al. Clinical significance of day 5 periph-eral blast clearance rate in the evaluation of early treatment response and prognosis of patients with acute myeloid leukemia. J Hematol Oncol. 2015; 8(1):48.
40. Bruggemann M, Raff T, Kneba M. Has MRD monitoring super-seded other prognostic factors in adult ALL? Blood. 2012;120(23): 4470–4481.
Cancer Management and Research downloaded from https://www.dovepress.com/ by 118.70.13.36 on 20-Aug-2020
Dovepress Prognostic significance of leukopenia
Supplementary material
Table S1 Treatment and follow-up of the 51 adult B-ALL patients
Group Case Therapy Response Status OS (months)
WBC-15 <0.40×10⁹/L 1 Induction CR Alive 70.7
Consolidation CR
HSCT CR
WBC-15 <0.40×10⁹/L 2 Induction CR Alive 32.1
Consolidation CR
HSCT CR
WBC-15 <0.40×10⁹/L 3 Induction Non-CR Dead 16.0
Reinduction CR
Consolidation Relapse
WBC-15 <0.40×10⁹/L 4 Induction Non-CR Dead 15.8
Reinduction CR
Consolidation CR
Maintenance Relapse
WBC-15 <0.40×10⁹/L 5 Induction CR Alive 21.7
Consolidation CR
Maintenance CR
WBC-15 <0.40×10⁹/L 6 Induction CR Dead 6.7
Consolidation Relapse
WBC-15 <0.40×10⁹/L 7 Induction CR Alive 19.3
Consolidation CR
Maintenance CR
WBC-15 <0.40×10⁹/L 8 Induction CR Alive 19.0
Consolidation CR
Maintenance CR
WBC-15 <0.40×10⁹/L 9 Induction CR Alive 18.9
Consolidation CR
Maintenance CR
WBC-15 <0.40×10⁹/L 10 Induction CR Dead 13.6
Consolidation CR
Maintenance Relapse
WBC-15 <0.40×10⁹/L 11 Induction CR Alive 17.0
Consolidation CR
HSCT CR
WBC-15 <0.40×10⁹/L 12 Induction Non-CR Alive 15.5
Reinduction CR
Consolidation CR
Maintenance CR
WBC-15 <0.40×10⁹/L 13 Induction CR Alive 14.5
Consolidation CR
Maintenance CR
WBC-15 <0.40×10⁹/L 14 Induction CR Alive 13.3
Consolidation CR
Maintenance CR
WBC-15 <0.40×10⁹/L 15 Induction NA Dead 0.8
WBC-15 <0.40×10⁹/L 16 Induction CR Alive 49.4
Consolidation CR
HSCT CR
WBC-15 <0.40×10⁹/L 17 Induction Non-CR Dead 5.0
Reinduction CR
Consolidation CR
WBC-15 <0.40×10⁹/L 18 Induction CR Alive 36.6
Consolidation CR
HSCT CR
(Continued)
Cancer Management and Research downloaded from https://www.dovepress.com/ by 118.70.13.36 on 20-Aug-2020
Dovepress Xing et al
Group Case Therapy Response Status OS (months)
WBC-15 <0.40×10⁹/L 19 Induction CR Alive 36.3
Consolidation CR
Maintenance Relapse
WBC-15 <0.40×10⁹/L 20 Induction CR Dead 9.9
Consolidation Relapse
WBC-15 <0.40×10⁹/L 21 Induction Non-CR Alive 45.9
Reinduction CR
Consolidation CR
HSCT CR
WBC-15 <0.40×10⁹/L 22 Induction CR Alive 8.6
Consolidation CR
HSCT CR
WBC-15 <0.40×10⁹/L 23 Induction CR Alive 8.3
Consolidation CR
Maintenance CR
WBC-15 <0.40×10⁹/L 24 Induction CR Alive 12.7
Consolidation CR
HSCT CR
WBC-15 <0.40×10⁹/L 25 Induction CR Alive 6.8
Consolidation CR
Maintenance CR
WBC-15 <0.40×10⁹/L 26 Induction CR Alive 6.6
Consolidation CR
Maintenance CR
WBC-15 ≥0.40×10⁹/L 27 Induction CR Dead 22.1
Consolidation CR
HSCT Relapse
WBC-15 ≥0.40×10⁹/L 28 Induction Non-CR Dead 24.4
Reinduction CR
Consolidation CR
Maintenance CR
WBC-15 ≥0.40×10⁹/L 29 Induction CR Dead 14.5
Consolidation CR
Maintenance Relapse
WBC-15 ≥0.40×10⁹/L 30 Induction CR Dead 23.7
Consolidation CR
Maintenance Relapse
WBC-15 ≥0.40×10⁹/L 31 Induction CR Dead 20.4
Consolidation CR
HSCT Relapse
WBC-15 ≥0.40×10⁹/L 32 Induction CR Dead 5.7
Consolidation Relapse
WBC-15 ≥0.40×10⁹/L 33 Induction CR Dead 7.2
Consolidation CR
Maintenance CR
WBC-15 ≥0.40×10⁹/L 34 Induction non-CR Dead 2.8
Reinduction Non-CR
WBC-15 ≥0.40×10⁹/L 35 Induction CR Dead 11.8
Consolidation Relapse
WBC-15 ≥0.40×10⁹/L 36 Induction CR Dead 21.5
Consolidation CR
HSCT CR
WBC-15 ≥0.40×10⁹/L 37 Induction CR Dead 8.2
Consolidation CR
Maintenance CR
WBC-15 ≥0.40×10⁹/L 38 Induction CR Dead 10.0
Consolidation Relapse
(Continued) Table S1 (Continued)
Cancer Management and Research downloaded from https://www.dovepress.com/ by 118.70.13.36 on 20-Aug-2020
Dovepress
Cancer Management and Research
Publish your work in this journal
Submit your manuscript here: https://www.dovepress.com/cancer-management-and-research-journal
Cancer Management and Research is an international, peer-reviewed open access journal focusing on cancer research and the optimal use of preventative and integrated treatment interventions to achieve improved outcomes, enhanced survival and quality of life for the cancer patient. The manuscript management system is completely online and includes
a very quick and fair peer-review system, which is all easy to use. Visit http://www.dovepress.com/testimonials.php to read real quotes from published authors.
Dove
press
Prognostic significance of leukopenia
Group Case Therapy Response Status OS (months)
WBC-15 ≥0.40×10⁹/L 39 Induction Non-CR Alive 53.6
Reinduction CR
Consolidation CR
HSCT CR
WBC-15 ≥0.40×10⁹/L 40 Induction CR Dead 3.4
Consolidation CR
WBC-15 ≥0.40×10⁹/L 41 Induction CR Alive 26.3
Consolidation CR
Maintenance CR
WBC-15 ≥0.40×10⁹/L 42 Induction CR Dead 14.8
Consolidation Relapse
WBC-15 ≥0.40×10⁹/L 43 Induction Non-CR Alive 10.4
Reinduction Non-CR
WBC-15 ≥0.40×10⁹/L 44 Induction CR Dead 24.6
Consolidation CR
HSCT Relapse
WBC-15 ≥0.40×10⁹/L 45 Induction CR Alive 48.5
Consolidation CR
Maintenance Relapse
WBC-15 ≥0.40×10⁹/L 46 Induction CR Dead 14.0
Consolidation CR
HSCT Relapse
WBC-15 ≥0.40×10⁹/L 47 Induction Non-CR Dead 16.1
Reinduction CR
Consolidation CR
Maintenance CR
WBC-15 ≥0.40×10⁹/L 48 Induction CR Dead 31.1
Consolidation CR
Maintenance Relapse
WBC-15 ≥0.40×10⁹/L 49 Induction CR Dead 27.4
Consolidation CR
Maintenance Relapse
WBC-15 ≥0.40×10⁹/L 50 Induction CR Alive 8.9
Consolidation CR
HSCT CR
WBC-15 ≥0.40×10⁹/L 51 Induction NA Dead 1.0
Abbreviations: B-ALL, B cell acute lymphoblastic leukemia; CR, complete remission; HSCT, hematopoietic stem cell transplantation; NA, not available; OS, overall survival; WBC, white blood cell; WBC-15, WBC count on day 15.
Table S1 (Continued)
Cancer Management and Research downloaded from https://www.dovepress.com/ by 118.70.13.36 on 20-Aug-2020