ATTRACTING PASSERSBY INTO A BUILDING
USING AN INTERACTIVE INSTALLATION
Jelle Wolbers
Abstract
This report presents the results of a bachelor graduation project for the University of Twente, 100%FAT & Concordia. Concordia is an organisation that provides film, arts and theatre in En-schede who hired 100%FAT to design and build an interactive installation that will attract more visi-tors to their public art display building.
The projects goal is to develop strategies and form recommendations for 100%FAT for the design and implementation of this interactive installation. This is done through literature research, con-ducting interviews and building three testing devices which are then used to conduct user tests at Concordia.
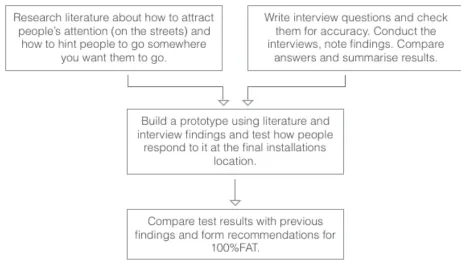
All in all the research method consists of several elements described in figure 1.
Figure 1: The Research Method
Report Organisation
The introduction chapter gives context and states the projects’ research questions and methods. The next chapter, Analysis, will start by diving into literature concerning people’s behaviour as well as a note on evaluations. State of the Art will show several other inspiring projects that in some way or form relate to this project. Users and Environment will discuss the location and people walk-ing past the location of where the final installation is gowalk-ing to be located. The chapter, Interviews, will discuss the results of the conducted interviews and its findings. Now that most analysis is done, Requirements will show the specific requirements that must be met according to the analy-sis.
For the chapter Design and Implementation, a method involving an Ideation, Specification and Re-alisation phase will be used. This is a method often used in Creative Technology projects and de-scribed in a paper[1] by A. Mader & W. Eggink in 2014.
Analysis
In this chapter we will discuss literature concerning people’s behaviour, a state of the art analysis, notes on the users and environment at the final installations location as well as the conducted in-terviews and setting up recommendations that follow from all obtained information.
Theory
As mentioned before, it is necessary to research what draws people’s attention on the streets. An important non-intrusive way of attracting attention is by invoking curiosity.
Curiosity & Attention
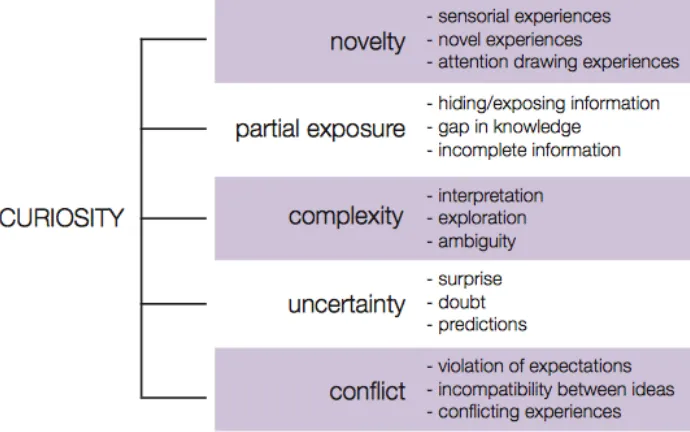
As R. Tieben, M.M. Bekker & B.A.M. Schouten[2] summarised in 2011, we can define five main principles for evoking curiosity: novelty, partial exposure, complexity, uncertainty, and conflict which can be seen in figure 2.
Figure 2: Five Main Principles for Evoking Curiosity
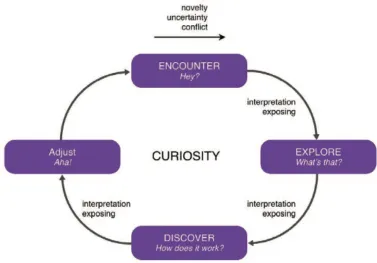
They also provide the curiosity process which can be found in figure 3.
Figure 3: The Curiosity Process
State of the Art
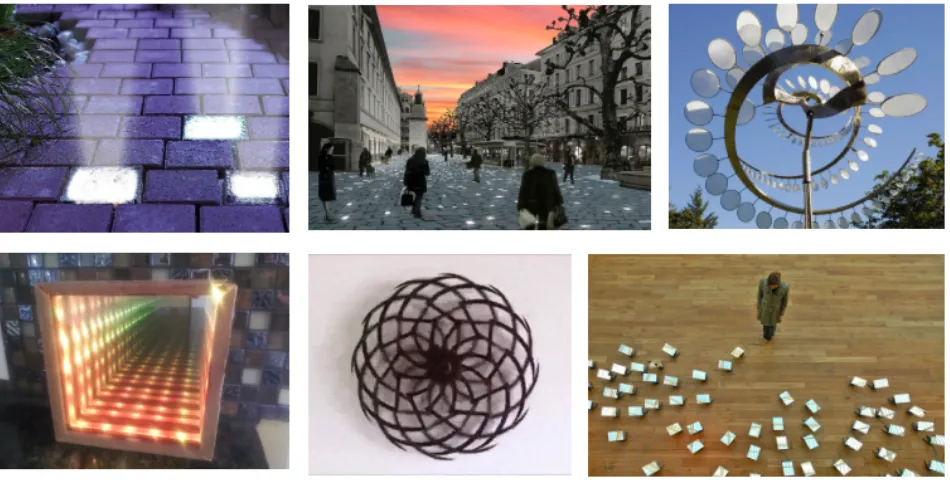
Besides the famous ‘Piano Staircase’ by TheFunTheory, there are a lot of other public art installa-tions, many of them interactive. Below are several examples, in no particular order, showcasing installations that show similarities to this project.
Face in the Snow
Jonathan Trumbull, a designer menswear store, installed an interactive digital window entitled 'Face in the Snow’. It consists of a large mounted LED screen with falling snow which digitally sweeps across the display, whilst blizzard sound effects are piped through the window to create a magical and immersive effect.
Behind the magic of the window are several technologies including facial recognition software, which detects your face and takes your photo before posting it to Facebook. Plus Feonic sound transducers turn the glass shop window into a massive speaker that pipes the blizzard effect soundtrack on to the street.
21 Balançoires
Image by Olivier Blouin
This musical installation called ’21 Balançoires’ (21 Swings) from Canadian design collective Daily Tous Les Jours is a whimsical, interactive experience. The contemporary-style swing set in Mon-tréal’s busy Quartier des Spectacles is a giant musical instrument triggered by motion. Dreamy, pre-recorded sounds of pianos, xylophones, and more are programmed to play various notes cre-ating complex melodies when the swings move together. He also included an eater egg in which secret song kicks into gear when all 21 swings are in use.
Every Passing Moment
A Tilt of Light
Image by Shannon Morris
An Australian art and design studio created A Tilt of Light and installed it in Melbourne’s Federation Square. The group used LED strips activated by computer software that are tucked inside the body of a seesaw. When one end tilts, the lights glow and zoom across the seesaw’s length. Studio Eness wanted to demonstrate the kinetic physics of the playground equipment, but make it a truly fun learning experience.
Rainbow City
Time After Time Capsule
Sebastian Masuda, Dag Hammarskjold Plaza
Photo: twi-ny/mdr.
This nine-foot-tall crystalline-looking Hello Kitty may be the world’s cutest time capsule, with Masu-da encouraging viewers to fill the hollow doll with their personal effects. The artist is staging the interactive work in cities around the globe. Masuda plans to unite all the collected artefacts at the upcoming 2020 Summer Olympics, slated to be held in his native Japan.
Interactive Think Sphere
Users and Environment
Concordia’s public art display is located in the city centre of Enschede, near the ‘Oude Markt’. This is shown in figure 5. The street at which the building is located is called the ‘Langestraat’ and runs south, away from the popular ‘Oude Markt’. This central location makes sure that a lot of people pass by every day.
Figure 5: A Map of Concordia’s Location Image from Google Maps
Locatus (a big company specialised in data collection) counts visitors in Enschede each year. This data is published afterwards and, because one of the counting locations (marked in figure 6) is right next to Concordia’s exposition building, provides information on the number of people walking past Concordia.
As can be seen in figure 6, in 2016 17400 people walked by Concordia’s exposition building on a single Saturday . The counting is done at 48 different locations in the city centre of Enschede. 2
Figure 6: The Amount of People Passing by Several Locations per Year.
Counted by Locatus on Saturday April 9th, 2016, between 10:00 and 17:00. 2
Although the location of Concordia’s exposition building seems favourable, a lot of people probably also pass by purely for commuting purposes, focussed solely on getting to work or getting home without paying much attention to the buildings they pass. The mindset of people passing by the building plays a very important role in their choice to interact with things in their environment. How many people that pass by the building which attention can be grabbed, who have time and the right mindset is discussed later in this report.
Curiosity decreases with age as seen by S. Harter in 1981[5] which would mean that an interactive installation designed to attract people using their curiosity may work worse for elder people.
Requirements
Because the prototype will be tested outside of Concordia’s exposition building in a busy street there are several (technical) limitations we need to address as well as some requirements for what it needs to do for us to test exactly what we want to know.
The installation needs to be able to withstand a little force as people could use it a way that they’re not supposed to. It also needs to not rely too much on LED lighting as the brightness of the day (when the building is open) can interfere with the desired lighting effects.
As we’ve seen in a previous chapter, curiosity can be triggered in these ways: novelty, partial ex-posure, complexity, uncertainty, and conflict. In order for people to be curious at what the device does and therefore interacting with it, it needs to fulfil at least one but preferably more of these fac-tors.
In order to not only track the attention of people but also to track how to direct those people inside of the building, part of the installation or another installation must be built that convinces people to go inside of the building once their attention is drawn.
Design and Implementation
As Ann Morrison says in her paper ‘The Lens of Ludic Engagement’: “However, there is no escap-ing the functional: and even art is framed and viewed through a functional lens.” This chapter will discuss the ideation phase, specification phase and realisation phase, of which the last will show requirements for designing and building the testing installation.
Ideation
At the start of 100%FATs cooperation with Concordia, a brainstorm was held by 100%FAT. Its goal was to develop several concepts that will be presented to Concordia. These concepts are shown below.
Concept 1: Kinetic Facade Game
A gigantic mechanical installation on the facade of the building where children and adults are invit-ed to play with using levers and buttons. Input for the game is providinvit-ed by the players who activate the device by turning mechanical discs and levers to solve puzzles where the goal is for example to guide balls through a maze. Elements for this device could be:
- lifting metal balls up through the installation - pneumatic valves controlled by a pump
- generating power by turning a disc to power motors
- a tube which goes through the inside of the building where the game continues
Concept 2: Interactive Approach
When approaching the building, several noticeable elements are implemented in the street that draw attention to the building where the frequency of these elements is at its peak. These ele-ments could consist of glowing bricks, units that have reflecting mirrors in them or pressure-sensi-tive tiles that respond to people passing over them.
By letting the units communicate with each other, the units could behave as a swarm that can then be programmed to show entertaining patterns or games which can give people the feeling of a liv-ing identity that invites them to come in.
This concepts mood-board can be found in figure 8.
Figure 8: Mood-board Interactive Approach
Concept 3: Interactive Gateway
By substituting the front door with a crazy, artistic entrance which could be an experience on its own to pass through, you trigger the adventurous side of people in which they want to explore and see what’s inside just by seeing the entrance. By using sensors and specific audio/visual elements you can create an experience in which the door opens in a creative way when you come close to the entrance, essentially forming around you dynamically. A mood-board can be found in figure 9.
Figure 9: Mood-board Interactive Gateway
Variations:
When these concepts were presented at Concordia, the Kinetic Facade Game was chosen to pro-ceed with. After deciding on the functional side of the installation, several themes were considered for its look & feel. Of these themes, several are depicted below together with a persona that gives an example as to how people could experience these themes when implemented into the build-ing’s facade.
Steampunk
Steampunk is centred around the theme that the invention of electricity never happened. Gears, steam, windmills and oil represent important parts of this world.
Sophie studies history at the local college and is always fascinated by retro devices and old school installations. As she walks through the city of Enschede on her way to class, she notices from a distance several big gears turning at the facade of a building. She knows she has other places to go but can’t help herself wanting to go there and explore some more. As she arrives at Concordia’s building, she is very intrigued as to what is happening in front of her as she notices a small object that she previously researched in school. Looking for confirmation and further information, she walks inside the building to ask the employees about the project. They tell her there are several artefacts hidden in the installation that represent important parts of the history of Enschede. She spends the next hour looking to find all of them.
Clean
This theme consists of simple geometric shapes, forms and surfaces. It’s as minimalistic and clean as possible.
Toys
This theme is based on existing modular toys such as LEGO, K’nexx, Duplo, Domino and marble tracks.
Jitske is a 10 year old girl. She likes playing with her toys and mac n’ cheese. She lives with her parents in Enschede and goes to school all by herself. She is not afraid of anything and is attracted to colourful things.
Jitske is shopping with her mother in the city center. As they pass Concordia’s public art gallery Jitske stops to look at the new contraption on the front wall. The contraption got her interest be-cause it had nice bright colours and it looked like a marble coaster she has at home. She spots a lever with a sign next to it which says: “pull me”. She does not hesitate and walks to the lever to pull it. A Ferris wheel starts to turn and a ball drops out. The ball drops in a tube and makes a loop-ing. After that it gets stuck. A tile in the sidewalk starts to blink and making noise. It looks like a but-ton, so she steps on it. The ball gets released and goes through a few other elements based on LEGO. K'NEX and Duplo to finally disappear through the main entrance. She pulls her mother’s hand and together they enter the building to look for the ball.
Again, these were presented at Concordia and Steampunk was chosen to be their favourite. Be-sides this theme, another idea popped up in the conversation about putting hints from famous people from Twente inside the installation. These hints could be picked up by people looking at the installation which may trigger them to keep looking for other hints. Now that ideas for the final in-stallation were in place, a plan was needed to test specific features and themes to see how people will react to this.
After a brainstorm session and several discussions, two plans were made. The first contained a joke generator that would play jokes by a famous comedian from Twente, Herman Finkers, when a lever is pulled in order to attract the attention of people walking by. The second plan involved a system which goal is to ‘lure’ people inside of the building using sound and maybe LEDs.
The arrow will be made out of wood and the LED strips will be digital to have more animation op3
-tions. The back of the arrow will contain a case in which the Arduino and other electronics can be placed. A battery pack might be added but won’t be necessary.
Device 3: The Speaker Box
The third device will feature a box with an Arduino, speaker and RF (Radio Frequency) receiver. It might also include a PIR (Passive Infrared) sensor to let the device work on its own although this could not be necessary. In figure 13 a sketch of this device can be found.
Figure 13: The Speaker Box Sketch
Device 3: The Speaker Box
A box-designer for laser-cut shapes was used to cut the 6 sides of a box out of wood that would 4 hold the speaker and electronics in place. Speaker holes were drilled and then cut out using a saw to allow sound to pass through more easily and the left- and right side of the box were adjusted to fit the speaker inside. All sides of the box were then painted bright yellow and coated with a clear oil-based spray.
The plan originally included an Arduino with an MP3 shield that would play a voice message when the Arduino received an RF signal from its remote. Because the MP3 shield didn’t work properly, a different solution was needed. People at 100%FAT suggested using their custom Raspberry Pi-based media player (the FAT Player) which could play media when one of the Pi’s GPIO (general purpose input/output) pins was fed power. This option would require communication between an Arduino (with its 5 volt RF receiver) and a Raspberry Pi which meant converting between an Ar-duino operating at 5 volts and the Raspberry Pi’s normal GPIO pins operating at 3.3 volts.
A voltage divider was then used as this could lower the Arduino’s 5 volt signal to a 3.3 volt signal that the Raspberry Pi’s GPIO input pins can handle. Some examples of a voltage divider schemat-ic can be seen in figure 15.
Figure 15: Examples of voltage divider schematics Image from SparkFun5
This means that to convert a 5 volt signal into a 3.3 volt signal, resistor 2 should have double the resistance of resistor 1.
The Arduino was programmed to detect RF signals using a RF receiver that was taken out of a 433MHz socket and send out a 5 volt signal (the Arduino code can be found in the appendix). This 5 volt signal was converted to a 3.3 volt signal using the voltage divider while using a 100 Ω resis-tor as R1 and 200 Ω resistor as R2. The output of this voltage divider was then connected to one of the Raspberry Pi’s GPIO pins.
A voice was then recorded saying ‘Psst. Please come inside’ and the file was converted to a video file as the FAT Player can only play videos. The FAT Player software was formatted onto an SD card that the Raspberry Pi could read and configured so that it would play the recording when a specific GPIO pin received an ON signal (3.3 volts). The speaker was connected to the Raspberry Pi and the Pi’s audio was routed through the 3.5mm jack port instead of the HDMI output. An im-age of this completed setup can be found in figure 17. It was decided not to include the PIR sensor as this testing setup did not need to work stand-alone.
Figure 17: The Arduino and Raspberry Pi Setup.
The laser-cut box was then assembled and adjusted so the speaker would fit in the front and the electronics in the back. Two plastic parts (which originally held the LED strips) were then glued to the front of the box to make it look like a vintage movie projector. The inside view of the electronics fitting inside and the completed device can be seen in figure 18 and 19 respectively.
After this first test, a second test included testing device 2 and 3, which were meant for ‘luring’ people inside, was executed. When people came close to the entrance or were done interacting with the first device, the arrow showed several different lighting patterns and the speaker played the voice message that invited the person inside. This interaction was written down as well. A pic-ture of the complete installation can be seen in figure 20.
Counting will be done on three consecutive days, starting at Tuesday the 17th of January till Thursday the 19th of January. The goal was to count until a big enough sample size would be reached that will confidently represent the response of passersby within a small margin of error. For this purpose a sample size calculator was used(reference https://www.surveymonkey.com/mp/ sample-size-calculator/ ).
In figure 21, a table showing the number of passersby at several locations in Enschede on a Sat-urday (reference: counting was done on SatSat-urday April 9th 2016 between 10:00 and 17:00) can be found. The address next to Concordia is marked in the table. In the same report can be read that Saturday is the busiest day of the week so for the testing days, a maximum of 17400 people will pass by each day between the hours of 10:00 and 17:00. For a population size that should be en-tered in the sample size calculator described above, 17400 should therefore be more than enough. Using a confidence level of 95% and a margin of error of 5%, these values yield a sample size of 376 which meant that for each testing day, for both the passive and proactive mode, at least 376 people should be counted in total passing by, looking at the device or interacting with the device for the data to be accurate with a 95% confidence level and a 5% margin of error.
Results
In this chapter, several charts will be shown and discussed that were created using the obtained testing data. The raw counting data can be found in the appendix. In this chapter, ‘this device’ equals testing device 1, the reason shall be explained later in this report.
Figure 22 shows a total of how many people walked pass the device, how many people looked at the device and how many people interacted with the device as well as the total amount of passers-by counted for each testing day. In this graph can be seen that the sample size goal was reached almost every testing day.
Figure 22: The Total Amount of People Counted per Testing Day
Figure 23 displays several charts that show what percentage of people fell into which interaction category (walking past vs looking interested and interacting), sorted per day and per mode (pas-sive vs proactive).
Figure 23: The Percentage of Counted People per Category.
In this last figure can be seen that each testing day approximately yields the same data, while the different modes clearly yield different data.
To more clearly see this difference, figure 24 combines the different testing days but separates the active and proactive mode in a table.
Figure 24: The Combined Testing Days by Category
As can be seen in the figure above, the total testing time for the passive mode does not equal the total testing time for the proactive mode. To be able to compare their results requires normalisation by the duration time. The number of people counted in the proactive mode were therefore scaled up by the same proportion as their different durations. This can be seen in figure 25.
Figure 25: The Combined Testing Days by Category Normalised on Test Duration
Acknowledgement
I would like to thank my supervisor, Edwin Dertien, for helping me throughout this project and shar-ing his knowledge with me. His enthusiasm and all-round capabilities are and have been of great inspiration to me. I want to thank Richard Bults for helping me find a great graduation project and getting me in contact with 100%FAT.
My thanks also goes towards the great people of 100%FAT, especially Floris Schreuder and Lieven Maes who helped me a lot, not only through their huge amount of knowledge but also for the great work environment and inspirational words, all of which I greatly enjoyed. Thanks towards the peo-ple that I interviewed and who shared their valuable knowledge with me: Edwin Dertien & Dennis Reidsma (University of Twente), Kees de Groot (Gogbot director), Elles van Vegchel (NEMO) and Karen Drost (Nederlands Instituut voor Beeld en Geluid).
References
[1] Mader, A. H., & Eggink, W. (2014). A design process for creative technology. The Design Soci-ety.
[2] Tieben, R., Bekker, T., & Schouten, B. (2011, July). Curiosity and interaction: making people curious through interactive systems. In Proceedings of the 25th BCS Conference on Human-Com-puter Interaction (pp. 361-370). British ComHuman-Com-puter Society.
[3] Jacucci, G., Wagner, M., Wagner, I., Giaccardi, E., Annunziato, M., Breyer, N., ... & Roussel, N. (2010, October). ParticipArt: exploring participation in interactive art installations. In Mixed and Augmented Reality-Arts, Media, and Humanities (ISMAR-AMH), 2010 IEEE International Sympo-sium On (pp. 3-10). IEEE.
[4] Morrison, A. J., Mitchell, P., & Brereton, M. (2007, September). The lens of ludic engagement: evaluating participation in interactive art installations. In Proceedings of the 15th ACM international conference on Multimedia (pp. 509-512). ACM.
[5] Harter, S. (1981). A new self-report scale of intrinsic versus extrinsic orientation in the class-room: Motivational and informational components. Developmental psychology, 17(3), 300.
[6] Ajzen, Icek. "From intentions to actions: A theory of planned behavior." Action control. Springer Berlin Heidelberg, 1985. 11-39.