Earth-Abundant Materials for Solar Hydrogen
Generation
Thesis by
James Robert McKone
In Partial Fulfillment of the Requirements for the Degree of
Doctor of Philosophy
California Institute of Technology Pasadena, California
2013
© 2013
Acknowledgments
There are so many people who contributed to my personal and professional experience as a graduate student; anything I write here couldn’t possibly do them justice.
Thanks to my advisors, Harry Gray and Nate Lewis. Harry was instrumental in drawing me to Caltech, and I have benefitted from every interaction with him. He is undoubtedly one of the greatest scientists of his age, and he is a consummate research advisor. I expect to strive for the rest of my life to be more like Harry. Nate is the most brilliant mind I have ever encountered, and his passion and tanacity for great science are infectious. Nate has taught me more than anyone how to think like a scientist, and for that I am grateful.
I would also like to thank Bruce Brunschwig, Jay Winkler, Siddharth Dasgupta, and my thesis committee members Jonas Peters, Mitchio Okumura, and Tom Miller. It has been a pleasure to interact with all of these fantastic scientists at various times during my years at Caltech. Each of them freely extended their advice and feedback regarding research, outreach, and career. I aspire to live up to their examples as scientists and members of a research community.
at Penn State, Ray Schaak, Eric Popczun, and Matthew Buck. Their partnership allowed me the opportunity to practice teaching about my own research methods as well to as learn from them a range of techniques that were otherwise opaque to me.
It was such a pleasure to work with a number of talented high school and un-dergraduate students during my time Caltech. I extend my gratitude in particular to Miguel Reyes, Mateo Martinez, Caroline Werlang, and Paul Nuñez, all of whom contributed directly to the primary efforts of my thesis work. Thanks also to all of the undergraduate students in the Lewis and Gray groups as well as the high school students whom I worked with as part of Harry’s Solar Army. Their curiosity and excitement about chemistry and science have been tremendously inspiring and motivating to me over the years.
Jim Maiolo, Jillian Dempsey, and Bryan Stubbert were instrumental in getting me started in the Lewis and Gray labs at Caltech and in teaching me some of the most important tools of my graduate work. Additionally, as part of the Lewis and Gray groups I was lucky to interact with a string of amazing postdoctoral researchers, including (in no particular order!) Mike Walter, Nick Strandwitz, Matt Bierman, Bryce Sadtler, Ron Grimm, CX Xiang, Mike Rose, Rob Coridan, Qixi Mi, Wes and Aaron Sattler, James Blakemore, and Jeff Warren. These postdocs were instrumental to my research successes; they challenged me and taught me intellectual maturity in everything from planning experiments to planning a career.
Abstract
A critical challenge for the 21st century is shifting from the predominant use of fossil fuels to renewables for energy. Among many options, sunlight is the only single renewable resource with sufficient abundance to replace most or all of our current fossil energy use. However, existing photovoltaic and solar thermal technologies cannot be scaled infinitely due to the temporal and geographic intermittency of sunlight. Therefore efficient and inexpensive methods for storage of solar energy in a dense medium are needed in order to greatly increase utilization of the sun as a primary resource. For this purpose we have proposed an artificial photosynthetic system consisting of semiconductors, electrocatalysts, and polymer membranes to carry out photoelectrochemical water splitting as a method for solar fuel generation.
Contents
Acknowledgments iv
Abstract vi
List of Figures ix
List of Tables xiv
1 Introduction 1
1.1 Purpose and Scope . . . 1
1.2 Background . . . 2
1.2.1 Current Energy Use . . . 2
1.2.2 Why Renewables? . . . 4
1.2.3 Why Solar? . . . 7
1.2.4 Solar Limitations . . . 8
1.2.5 Solar Energy Storage . . . 9
1.2.6 Artificial Photosynthesis . . . 13
1.3 Narrative Summary . . . 15
1.3.1 CCI Solar . . . 15
1.3.2 Chronological Research History . . . 17
2 Earth-Abundant Electrocatalysts 23 2.1 Introduction and Background . . . 23
2.2 Electrodeposited Ni-based Catalysts . . . 27
2.4 Catalyst Comparison on Si Substrates . . . 39
2.5 Ni–Mo Nanopowder . . . 43
2.6 Ni2P Nanoparticles . . . 57
3 Silicon Hydrogen-Evolving Photocathodes 64 3.1 Introduction and Background . . . 64
3.2 Deposition and Characterization . . . 65
3.3 Si Homojunctions . . . 74
3.4 Alternative Design . . . 76
4 Tungsten Diselenide Photocathodes 85 4.1 Introduction and Background . . . 85
4.2 Synthesis . . . 90
4.3 Initial HER Studies . . . 93
4.4 Optimized HER Studies . . . 96
4.5 Further Characterization . . . 101
4.6 Complete Picture of p-WSe2 . . . 108
5 Summary and Conclusions 116 A List of Symbols, Abbreviations, and Their Meanings. 119 B Tutorial on Characterization of HER Electrocatalysts and Photo-electrodes 123 B.1 Hydrogen Evolution Electrocatalysts . . . 123
B.1.1 Theoretical Considerations . . . 123
B.1.2 Experimental Considerations . . . 128
B.2 Hydrogen Evolution Photocathodes . . . 137
B.2.1 Theoretical Considerations . . . 138
B.2.2 Experimental Considerations . . . 141
List of Figures
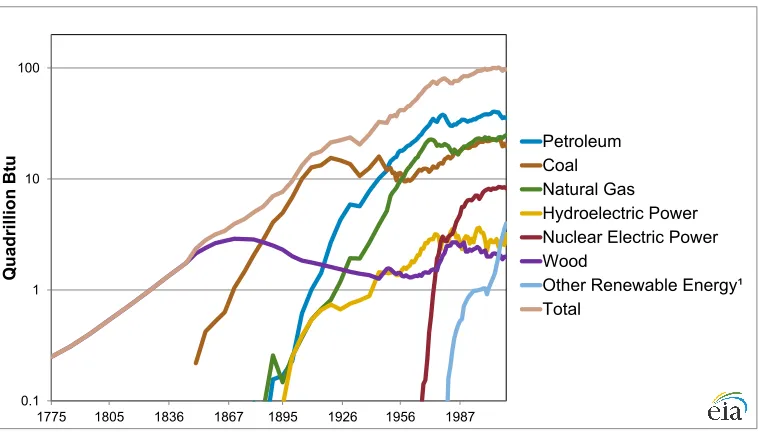
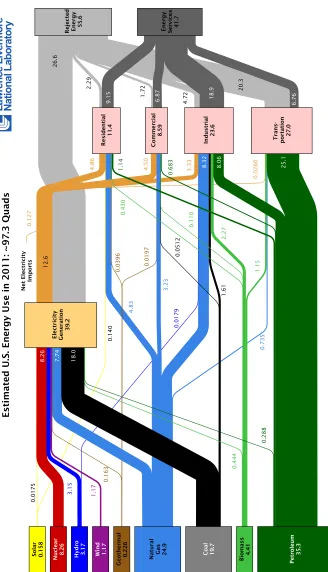
1.1 U.S. energy consumption by source, 1775–2011 . . . 3 1.2 Flow diagram for U.S. energy consumption in 2011 . . . 5 1.3 Climate change data and models compiled by the Berkeley Earth Surface
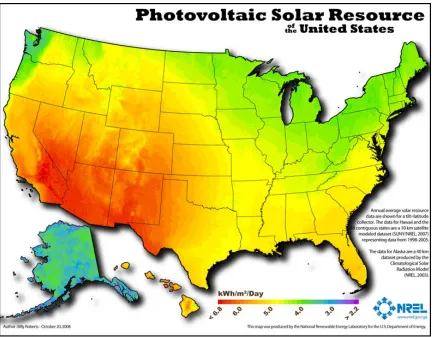
Temperature program . . . 6 1.4 Global energy demand in 2050 and feasible supply from renewables . . 7 1.5 Data from residental rooftop Si PV array in Northfield, MN . . . 10 1.6 Heat map of insolation intensity in the U.S. . . 11 1.7 Solar water splitting device schematic . . . 16
2.1 Schematics of key processes involved in PEC hydrogen evolution using Si microwire arrays and heteregeneous catalysts . . . 25 2.2 Volcano plots for HER electrocatalysts under acidic and alkaline conditions 26 2.3 Tafel data for Ni–Mo films electrodeposited from alkaline solutions on
glassy carbon and Si surfaces . . . 30 2.4 Cyclic voltammetry for Ni–Mo electrodeposition from sulfamate solution
as a function of [Mo] . . . 32 2.5 Electrochemical deposition and stripping data for Ni–Mo films using
FTO substrates . . . 34 2.6 Electrochemical HER behavior and photographs of Ni–Mo films
elec-trodeposited with various loadings on FTO substrates . . . 35 2.7 TEM data for electrodeposited sulfamate Ni–Mo films . . . 36 2.8 Time-lapse photographs giving qualitative indication of the stability of
2.9 SEM images for sulfamate Ni and Ni–Mo films electrodeposited onto planar Si substrates . . . 40 2.10 SEM images for sulfamate Ni and Ni–Mo films electrodeposited onto
microwire Si substrates . . . 41 2.11 Electrochemical j–E data showing HER catalytic behavior of various
catalysts deposited onto planar and microwire Si substrates . . . 42 2.12 Ni–Mo nanopowder synthetic scheme . . . 45 2.13 SEM and TEM data for Ni–Mo nanopowder before and after thermal
reduction. . . 46 2.14 Electrochemical j–E data showing HER catalytic activity of Ni–Mo
nanopowders compared to Ni and Ti controls . . . 47 2.15 Stability data for Ni–Mo nanopowders carrying out the HER under
acidic and alkaline conditions . . . 48 2.16 Plot illustrating the relationship between composition and activity for
Ni–Mo nanopowders . . . 50 2.17 Tafel data for the HER from Ni–Mo nanopowder films as a function of
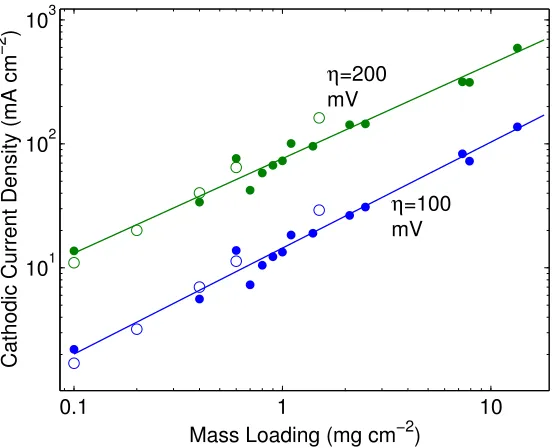
mass loading . . . 51 2.18 CV data for Ni and Ni–Mo nanopowders under alkaline conditions . . 52 2.19 Plot depicting the power law relationship between Ni–Mo nanowder
mass loading and cathodic current density at two different overpotentials 53 2.20 Electrochemical HER j–E data and SEM of metallurgical Ni–Mo alloys 56 2.21 Tafel plot for the HER on various chalcogenide nanoparticle films under
alkaline conditions . . . 58 2.22 Compiled synthetic data for Ni2P nanoparticles . . . 59 2.23 Electrochemical j–E data for the HER on Ni2P particles under acidic
4.1 Crystal structure and MO diagram for the Mo and W layered chalcogenides 87 4.2 Scanning electron micrograph of an as-grown WS2 crystal . . . 88 4.3 Reaction scheme for MX2 crystal growth by CVT . . . 91 4.4 Photograph of a large WSe2 crystallite grown by CVT . . . 93 4.5 Electrochemical j–E data illustrating the low catalytic activity of
pris-tine p-WSe2 toward the HER in the dark and under illumination . . . 95 4.6 Initial PEC hydrogen evolution j–E behavior of p-WSe2/Pt
photoelec-trodes in mildly acidic and strongly alkaline solutions . . . 96 4.7 PEC j–E data for deposition of Pt and Ru catalysts onto the surfaces
of p−WSe2 photoelectrodes . . . 98 4.8 Scanning electron micrograph of a p-WSe2 electrode after Pt deposition
and PEC HER testing . . . 99 4.9 PEC hydrogen evolution j–E data for illuminated p-WSe2
photoelec-trodes deposited with the noted catalysts using optimized methods . . 99 4.10 Comparison of PEC HER results for a single p-WSe2/Pt photoelectrode
in two different electrolytes . . . 100 4.11 Potentiostatic i–t data for a p-WSe2 photoelectrode in MV2+ solution
at two different pH values . . . 102 4.12 Optical micrographs of p-WSe2 photoelectrodes before, between, and
after stability tests . . . 103 4.13 Spectral response data for a representative p-WSe2 photoelectrode in
aqueous MV2+ solution . . . 104 4.14 Detail of the spectral response data for p-WSe2 at the photocurrent
onset overlaid with data predicted from the Gärtner carrier diffusion model . . . 106 4.15 PEC hydrogen evolution j–E data for a representative p-WSe2 crystal
under illumination in Ru(NH3)3+6 /2+ solution . . . 107 4.16 Mott-Schottky data and optical micrographs for p-WSe2photoelectrodes
4.17 Flatband potentials calculated for a set of 9 p-WSe2 photoelectrodes from Mott-Schottky measurements in Fe(CN)36−/4− solution . . . 110 4.18 Schematic depiction of the pH-dependence of the band edge positions for
a hypothetical, canonical semiconductor and for WSe2 electrodes with pristine surfaces . . . 111 4.19 Comparison of the expected photocurrents for p-WSe2 using the
ELH-type tungsten-halogen bulb spectrum compared to the standard AM1.5G spectrum . . . 114 4.20 Scanning electron micrograph of the powder that results from heating
together tungsten metal, Na2S, and pure S under inert gas . . . 115
5.1 World record energy conversion efficiency vs. time for the various com-mercial and several heavily researched solar photovoltaic technologies. . 118
B.1 Cyclic voltammograms of glassy carbon electrodes deposited with poly-tungstate using Pt and carbon counter electrodes . . . 130 B.2 Electrochemical j–E data for clean Pt electrodes near ERHE in 0.5 M
H2SO4 solutions that have and have not been saturated with H2(g) . . 135 B.3 Model of a high performing Si/Pt hydrogen evolving photocathode under
List of Tables
1.1 Materials and energy storage efficiencies of selected artificial photosyn-thetic devices . . . 14
2.1 Compositions of two alkaline Ni–Mo deposition solutions from prior lit-erature reports of high HER activity . . . 29 2.2 Compositions of two new Ni–Mo deposition solutions with mildly acidic
pH values. . . 33
4.1 Optoelectronic properties for MX2 compounds . . . 86 4.2 Compiled figures of merit from previous examples of efficient MX2
pho-toelectrodes in contact with aqueous redox couples . . . 89 4.3 Compiled figures of merit for PEC hydrogen evolution on p-WSe2
Chapter 1
Introduction
1.1
Purpose and Scope
This dissertation describes in detail the whole of my research efforts from the Fall of 2008 through the present date (May of 2013). It has been written in part to satisfy the requirements for a doctoral degree in chemistry from Caltech. I also hope that it will be useful as a resource for scientists who are interested in solar hydrogen generation, or for researchers that would like to replicate or expand on my work. With these audiences in mind, I have divided the content into chapters addressing various topics. The remainder of Chapter 1 is a general overview and introductoin to the field of artificial photosythesis as I have come to understand it through my involvement with the Gray and Lewis groups. Following this overview, I have included a brief narrative summary of how I came to work on the topic of photoelectrochemical (PEC) hydrogen evolution and a brief chronology of my research efforts.
Chapters 2–4 are the main body of the dissertation, covering experimental work and major results. Chapter 2 describes development of earth-abundant Ni–Mo and Ni2P electrocatalysts for the hydrogen evolution reaction (HER). Chapter 3 details efforts on coupling various catalysts to silicon light absorbers. Chapter 4 covers work on synthesizing and characterizing p-WSe2 as a photocathode light absorber.
reproduce the results. The reader is encouraged to consult the associated publications for more detailed experimental information.
This dissertation concludes with a brief summary as well as some conclusions and general recommendations for future efforts toward solar hydrogen generation and artificial photosynthesis. I have also included two appendices. Appendix A1 contains a list of symbols and abbreviations used herein with their associated definitions. Appendix A2 is a brief tutorial on best practices for carrying out electrochemistry and photoelectrochemistry measurements in characterizing hydrogen evolving cathodes and photocathodes, respectively. This tutorial discusses several subtle features and pitfalls of these measurements that I found were not immediately obvious from the published literature. I have also included references to what I believe to be the best current resources for detailed treatments of the relevant theory for electrochemistry and solid-state physics.
I hope that this dissertation will serve some useful purpose other than facilitating receipt of a doctoral degree. The main text, along with the Appendix B and the associated references, should be sufficient to allow anyone with a strong background in chemistry to repeat and expand on my work. If nothing else, perhaps some decades down the road a young researcher will come across this document and marvel at how quaint was our understanding of photoelectrochemistry and electrocatalysis back then. In any case, please enjoy!
1.2
Background
1.2.1
Current Energy Use
0.1 1 10 100
1775 1805 1836 1867 1895 1926 1956 1987
sources, and also that over half of all the energy currently recovered is “rejected” (i.e., wasted).
1.2.2
Why Renewables?
Today there exists a broad and strong consensus in the global scientific and political communities that humans must transition away from intensive utilization of carbon-based fossil fuels and toward renewable sources of energy. Nate Lewis has collected a large body of data to highlight the imperatives and material requirements for such a shift to renewables. The remainder of this introduction is based in large part on his writings and presentations on the subject.3,4
One concern over continued use of fossil fuels is their inherently finite nature. Aca-demic and industry representatives have anticipated the arrival of “peak oil,” wherein the supply of fossil fuels reaches a maximum and then gradually transitions from a functionally infinite to a highly precious resource, for some time.5 This transition is predicted to result in a consistent increase in the price of fossil fuels into the foresee-able future. Nevertheless, allowing for an eventual peak in world fossil fuel recovery and consumption, conservative estimates suggest that reserves sufficient for hundreds of years at current usage rates are already accessible.3
Another concern for the continued use of fossil fuels involves human health and welfare. Burning fossil fuels produces large quantities of pollutants, including nitro-gen and sulfur oxides, particulates, and volatilized heavy metals. These compounds are inevitable byproducts because the fuels themselves consist of fossilized animal and plant matter that have been massively concentrated over geological timescales. Burning fossil fuels therefore releases these concentrated deposits over a compara-tively short time period, resulting in local atmospheric concentrations of, e.g., volatile mercury species, for which living species like humans are not adapted.
1750 1800 1850 1900 1950 2000
0.1 1 10 100
P
ow
er
(
TW)
*Based on 10% utilization of the theoretical total global power
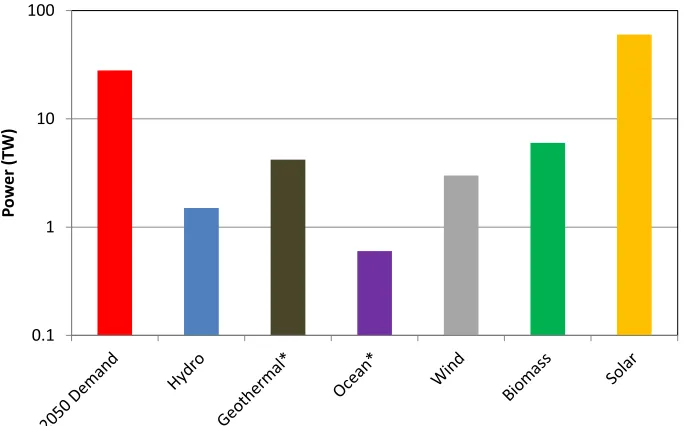
Figure 1.4. Chart of the expected global power demand in 2050 along with estimates of the feasible supply from various non-fossil resources. Data collected from calculations by Nate Lewis.3
1.2.3
Why Solar?
Figure 1.4 depicts (on a log scale) the anticipated global energy demand in 2050 along with estimates of the energy that could be feasibly extracted from various major renewable energy sources.3 Although each renewable resource could be used to offset a significant proportion of the energy demand, solar energy is the only one where the recoverable fraction is larger than the total demand. This is perhaps unsurprising, as all renewable energy sources rely fundamentally on the sun through electromagnetic radiation or gravitational effects. Solar energy is also arguably the most underutilized renewable resource, especially relative to its enormous potential. This underutilization is largely due to the high cost of manufacturing photovoltaic (PV) and solar thermal technologies exacerbated by the relatively low energy density in sunlight striking a given area (∼1 kW m−2 around noon on a sunny day in North America).
inexpensive to produce and to install. The average installed cost for PV arrays continues to decline at a rate that, if continued, will lead to direct cost-competitiveness with conventional fossil fuels within the next 1–2 decades in the United States.7 The U.S. Department of Energy has recently funded a broad effort called the SunShot program intended to facilitate technological innovations that will enable photovoltaic arrays to reach installed costs of <$1 per watt.8
Continued PV research and industrial innovations leading to decreases in cost in the coming years are highly likely. Simply increasing the scale of production for crystalline Si and thin-film technologies will eventually result in manufacturing efficiencies, diminishing hardware and installation costs significantly. Also, continued basic technological innovations on the design and construction of photovoltaic cells and modules will result in decreased costs per watt for manufactured systems. Some of these innovations can be quite significant, such as the recent (as of this writing) record efficiencies for CdTe solar cells.9
Other unforseen “step-change” innovations in developing cost-competitive solar are also quite likely, as unconventional photovoltaic technologies are constantly being improved in laboratories and pilot-scale manufacturing facilities. For example, Alta Devices recently demonstrated ultrathin crystalline GaAs solar cells that approach the efficiency limit of ∼30% obtainable for this material.9,10 Modules are currently being manufactured and marketed to the consumer electronics and military markets, as the high obtainable efficiencies and good low-light performance makes these cells useful for charging personal electronics and powering remote military installations.
1.2.4
Solar Limitations
only ∼40% of total energy usage in the U.S. is in the form of electricity. The re-mainder comes largely from direct combustion of carbon-based fuels in the industrial and transportation sectors. Some proportion of this current fuels use could likely be transitioned to electricity, especially in transportation with the continued adoption of battery and hybrid technologies, but a complete transition to solar-driven electrical energy usage is impractical.
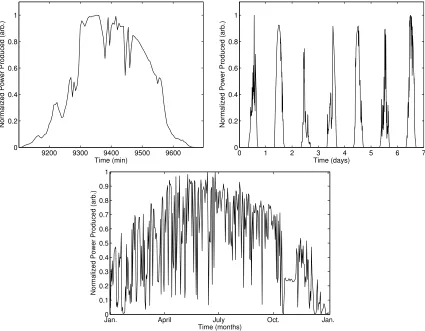
A more important barrier to ubiquitous adoption of photovoltaics is the fact that the solar resource is intermittent. The energy flux of sunlight striking any part of the Earth varies significantly on the timescale of minutes (e.g., due to clouds), hours (due to solar angle), days (due to weather patterns), and months (due to seasons). This variability is illustrated in Figure 1.5, which depicts the daily, weekly, and yearly output of a residential rooftop solar array located in Northfield, MN. Furthermore, as with fossil energy some geographic locations receive significantly more solar energy than others, which is illustrated in the map in Figure 1.6.11
Due to the temporal and spatial intermittency of sunlight, photovoltaics simply cannot be relied upon to provide a significant offset to fossil fuel resources in the ab-sence of massive changes to the electrical grid. One solution to this problem involves only developing such technologies to the limit at which their usage does not disrupt the otherwise continuous supply of energy from conventional, continuous sources. Re-searchers have estimated that this limit lies around 20%,12–14which already represents a 40-fold increase compared to current solar PV supply.1 Thus the current markets for photovoltaics and solar-thermal electriciy will continue expanding at a significant rate in the coming years as production prices decrease. However, current solar cap-ture methods cannot replace conventional power supplies to the extent required to ameliorate problems such as pollution, climate change, and energy security.
1.2.5
Solar Energy Storage
would allow for efficiently capturing photons and then converting their energy into an inexpensive, dense medium that can be transported and the stored energy recovered on demand. The ultimate realization of fully scaled solar energy storage would, in principle, allow solar energy to approach 100% of global electricity usage.14,16Also the ideal solar storage scheme could offset a large proportion of current direct fossil energy usage, as the stored energy could be transported and used in a very similar fashion to hydrocarbons.
Already some solar storage methods are developed and demonstrated.15 For ex-ample, one solar-thermal storage method involves using an array of mirrors to heat a large quantity of a dense material with high heat capacity such as molten salts. These molten salts remain at elevated temperature for hours, and can thus be used to drive turbines at night. However, like all solar thermal technologies, this approach suffers from restrictive land requirements and involves extensive and highly technical planning and engineering.
1.2.6
Artificial Photosynthesis
Yet a third method of solar energy storage is called “artificial photosynthesis,” and it is the subject of this dissertation. Artificial photosynthesis lies intermediate be-tween photovoltaic technologies and natural photosynthetic processes. In artificial photosynthesis, as in photovoltaics, solar photons are incident on human-made light absorbers, resulting in electronic excited states. Then, as in photosynthesis, those excited states are immediately used to drive thermodynamically uphill chemical re-actions, thereby converting electrical energy to stored chemical energy. Ideally these chemical reactions would produce fuel compounds that closely resemble the refined hydrocarbons currently used in the transportation and industrial sectors.
Artificial photosynthesis is quite similar to solar battery storage, except that the fuel species are generally lighter and more reactive, and therefore more energy dense, than those currently used for electricity storage in batteries. Also, the use of artificial photosynthesis to generate fuels could allow for continued usage of the existing fos-sil fuel infrastructure, which would decrease the capital costs of incorporating solar technologies across all energy sectors. Hydrogen has a particularly high gravimmetric energy density, and can be obtained directly by electrolysis of water. But hydrogen suffers from a relatively low volumetric density due to its extremely low boiling point, making storage and transportation difficult. Nevertheless, water electrolysis to yield hydrogen (and oxygen as a byproduct) has been thoroughly studied and serves as a useful approach for demonstrating the possibility of artificial photosynthesis.
1.3
Narrative Summary
1.3.1
CCI Solar
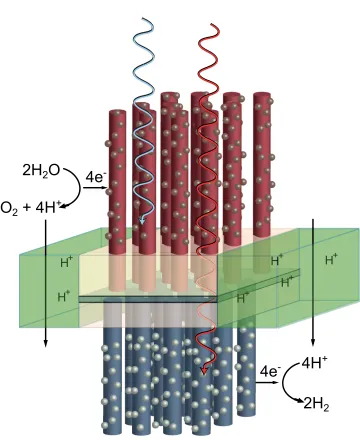
Most of the work contained in this dissertation on photoelectrochemical hydrogen evolution was carried out with support from the NSF-funded Center for Chemical Innovation (CCI Solar) subtitled “Powering the Planet.”26 The second phase of the CCI was funded from 2008 to 2013 at an unprecedented level for the field, and our research efforts have involved a large network of scientists working together to realize fundamental innovations required for demonstrating unassisted solar water splitting. The CCI Solar project coalesced around a proposed composition and architecture for a device that could split water into hydrogen and oxygen using energy input only from sunlight. The design was originally conceived by Nate Lewis and his research group at an annual research retreat. It was adapted into a visual schematic, shown in Figure 1.7, by Elizabeth Santori, a Lewis Group graduate student. It subsequently became the de facto logo for the CCI Solar program.
The CCI Solar device architecture consisted of a set of two semiconductor mate-rials with high aspect-ratio (e.g., rod or wire) geometries, each bound into opposite sides of a membrane. The device would be oriented with the long axis of the wires parallel to the solar illumination vector, such that sunlight would first strike the top layer, then traverse the membrane, and finally strike the bottom layer. The top layer would be constructed of a stable, robust metal oxide material capable of absorbing blue photons and generating oxygen from neutral or acidic water. The bottom layer would be constructed of another stable, robust semiconductor capable of generating hydrogen from protons (or a protonated Brønsted base). The initial material targets for the photoanode and photocathode were WO3 and Si, respectively. These materials were chosen for their earth-abundant composition, acid stability, and well-precedented use in photoelectrochemistry.
H+
H+
2H
24H
+4e
-2H
2O
O
2+ 4H
+4e
-ElSanto.
H+
H+
H+
H+
that would develop between the anode and cathode. We proposed to use for the membrane layer mixtures of various polymeric materials that could be combined to give the desired properties. For example, we expected that composites Nafion® with a conductive polymer would endow the membrane with mixed ionic and electrical conductivity.
The final relevant components for the CCI device were electrocatalysts for the oxygen evolution reaction (OER) and hydrogen evolution reaction (HER), respec-tively. These catalysts were to be either molecules or materials physically attached to the semiconductor surfaces in order to enable efficient generation of oxygen and hydrogen. It was not clear (and indeed is still not clear) whether or not an oxy-gen evolution catalyst would be required for the photoanode, as most metal oxides exhibit reasonable catalytic activity toward the OER. However, we expected that a hydrogen evolution catalyst would be required for the photocathode, as essentially all small-bandgap semiconductors exhibit low activity toward the HER. Although noble metals such as Pt, Ir, and Ru are known to be efficient electrocatalysts for the HER and OER, we targeted development of catalysts incorporating more abundant elements such as Ni, Co, or Fe.
1.3.2
Chronological Research History
I arrived at Caltech during the summer of 2008, which was an active period for work on solar fuels at Caltech and elsewhere. The Nocera group had just published the first of what would be an extensive series of papers on an electrodeposited cobalt oxide water oxidation catalyst that operated in neutral water.28 This result implied the possibility of net water splitting using earth-abundant catalyst materials and mild conditions.
Chapter 2
Earth-Abundant Electrocatalysts
2.1
Introduction and Background
This chapter describes work on synthesis and characterization of earth-abundant elec-trocatalysts for the HER. In these efforts I collaborated closely with Emily Warren as well as two undergraduates, Mateo Martinez and Caroline Werlang. We focused primarily on Ni-based catalysts, especially mixtures of Ni and Mo (broadly referred to hereafter as Ni–Mo). Initial studies centered on reproducing previous results on electrodeposited Ni–Mo alloys. Subsequently we developed Ni–Mo electrodeposition methods that could be carried out under mildly acidic conditions, allowing for the gen-eration of stable and active coatings on Si electrodes. We also developed a chemical synthesis for Ni–Mo nanopowders involving pyrolysis and reduction of homogeneous mixtures of Ni and Mo salts. These nanopowders were significantly more amenable to fundamental study than electrodeposited films, and exhibited high activity and stability toward the HER, especially under alkaline conditions. Finally, I collabo-rated with Eric Popczun and Raymond Schaak at The Pennsylvania State University to characterize the catalytic activity of Ni2P nanoparticles toward the HER under acidic and alkaline conditions. These materials also showed promising activity and stability, especially under acidic conditions.
et al. showed that indeed MoS2 edge sites were catalytically active toward the HER, although the per-atom activity was apparently closer to that of Ni than Pt.64
Nickel-based electrocatalysts are well precedented in electrochemistry literature as non-noble alternatives to Pt for the HER, especially under alkaline conditions.65 Although pure Ni metal is the most active single component, non-noble HER catalyst, it is still approximately three orders of magnitude lower in activity than Pt metal. However, many researchers have reported that mixing Ni with another transition metal results in increased HER activity relative to pure Ni metal. A large number of researchers have reported particularly high activity for composites including Ni and
Mo.66–87 These Ni–Mo or Ni–Mo–X (where X is a third element such as Fe or Cd)
materials, synthesized by a variety of methods, exhibited one or even several orders of magnitude higherj0 values and lower Tafel slopes than pure Ni electrodes.
2.2
Electrodeposited Ni-based Catalysts
Heterogeneous catalyst coatings can be deposited easily onto electrode substrates by the electrodeposition technique, which involves electrochemical oxidation or reduction of solution species so as to generate the active catlayst (or catalyst precursor) as an insoluble film directly on the electrode surface. Many of the most active Ni–Mo HER catalysts were generated by electrodeposition.69,73–78,87 Therefore we sought to use electrodeposition to generate Ni–Mo composites on Si substrates.
Electrodepositions of metallic alloys containing Mo proceed by complex reaction mechanisms.88–90Molybdate salts, which are generally used as the Mo precursor, can-not generate pure Mo metal by cathodic electrodeposition under aqueous conditions. Instead the molybdate is only partially reduced to a solid molybdenum sub-oxide, MoOn2−. When transition metals such as Ni, Co, or Fe are added to molybdate solu-tion, however, cathodic deposition results in formation of a metallic alloy of the two components.
liter-10−4 10−3 10−2 10−1 0
0.1 0.2 0.3 0.4 0.5
Current Density (A cm−2)
HER Overpotential (V)
depositions on silcon
deposition on glassy carbon
0 2 4 6 8 10 12 14 16 18 −4
−3 −2 −1 0
Time (s)
Current (mA)
−0.2 0 0.2 0.4 0.6 0.8 1
0 0.1 0.2 0.3 0.4
Potential vs. SCE (V)
Current (mA)
−0.25 −0.2 −0.15 −0.1 −0.05 0 0.05 −20
−15 −10 −5 0
Potential vs. RHE (V)
Current Density (mA cm
−2
)
1.4 C cm−2
600 mC cm−2
250 mC cm−2
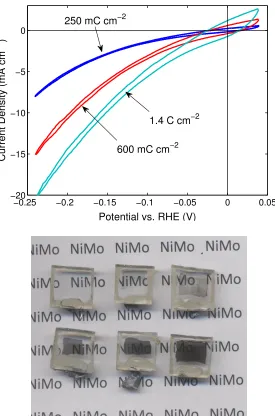
Figure 2.6. Top: j–E data for hydrogen evolution from Ni–Mo films deposited onto FTO substrates from sulfamate solution with the noted total charge density passed during deposition. Data were collected without iR compensation, in a H2-saturated potassium phosphate solution at pH ≈ 6, in a two-chamber cell using a Pt counter electrode in a separate fritted compartment and a SCE reference electrode in the working compartment. Bottom: photograph of Ni–Mo/sulfamate films on FTO sub-strates deposited with increasing charge densities ranging from zero (upper left) to
Initial studies of sulfamate Ni–Mo HER activity were carried out under a variety of conditions, including strongly acidic and nearly neutral aqueous solutions. These ex-periments gave inconsistent results, especially for electrodes that remained submersed in solution between experiments. Initial potentiostatic and galvanostatic experiments implied low stability for the Ni–Mo films under both neutral (potassium phosphate, KPi) and acidic (H2SO4) solutions. Therefore we carried out a simple stability assay, wherein catalyst coatings were deposited onto FTO substrates and then placed in sealed vials containing hydrogen-purged aqueous solutions with various electrolytes. These films were then imaged using a digital camera over a period of several days at consistent intervals to directly observe the relative rates of catalyst corrosion. Results for this experiment are shown in Figure 2.8, which depicts the catalyst films at the beginning of the experiment and approximately 2 days, 16 hours later.
2.4
Catalyst Comparison on Si Substrates
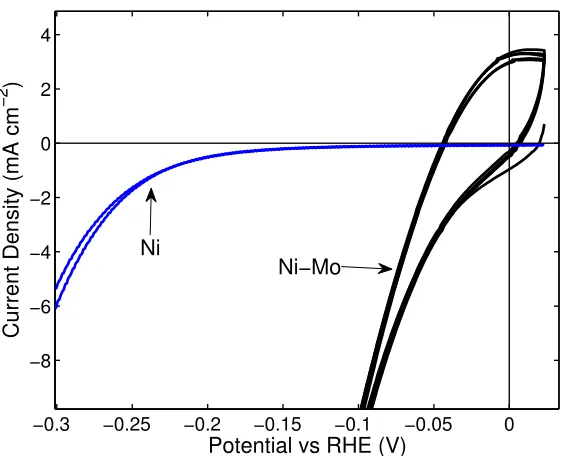
In order to elucidate the viability of electrodeposited Ni–Mo for use in Si-based hy-drogen evolving photocathodes, we carried out a comparative study of its activity alongside pure Ni and Pt films on p+-Si electrodes in both planar and microwire geometries. Pure Ni films could also be deposited from sulfamate solution without any additional Mo, but signficantly shorter deposition times were required in order to generate coatings with a comparable amount of deposited material due to the high DCE for pure Ni. Highly active Pt films were deposited by electron-beam (e-beam) evaporation, the same method we used previously to generate active Pt coatings on Si n+p junctions.46
Figures 2.9 and 2.10 show scanning electron micrographs of Ni and Ni–Mo coat-ings on planar and microwire Si substrates, respectively. Evaporated Pt films were so thin that they could not be clearly imaged in the electron microscope. The mor-phologies of the Ni and Ni–Mo coatings were quite similar, consisting of agglomerates of particles several hundreds of nm in diameter. However, as the deposition thickness was increased, the Ni–Mo coatings remained porous and generated multiple catalyst layers, whereas the pure Ni coatings coalesced into continuous films. On microwires the films were similarly structured, but in some cases the deposits were thicker toward the tops of the microwires compared to the bases.
a
b
c
d
a
b
d
c
under the noted conditions. Therefore the surface-area enhancement afforded by the wire structure did not significantly enhance Pt HER electrocatalytic activity.
Due to the signficant enhancement in catalytic activity for Ni–Mo in transitioning to the microwires, and the small enhancement for Pt, the activities of these two materials on microwires were actually quite similar. We conclude that Ni–Mo films deposited onto high aspect ratio substrates can attain “Pt-like” catalytic activity relative to the projected area of the electrode. Therefore, Ni–Mo is indeed a viable non-noble catalyst for use in a hydrogen evolving photocathode alongside Si light absorbers. In light of these results, we undertook efforts to develop improved syntheses of Ni–Mo materials, as described in the following section, and we also characterized the behavior of Ni–Mo on photoactive Si substrates, as described in Chapter 3.
2.5
Ni–Mo Nanopowder
After extensive efforts using Si substrates, we determined that electrodeposition of non-noble catalysts such as Ni–Mo alloys is not the optimum method for generating composite Si photocathodes. In particular, the Ni sulfamate deposition bath is not amenable to tuning the resulting Ni–Mo composition. Additionally, mass loading of the catalyst is difficult to control and to measure using electrodeposition. Also, only one sample can be prepared at a time, making statistical analysis of the resulting catalytic properties challenging. Finally, we concluded that spatial control over the location of deposited material would be useful, as discussed in Chapter 3. Achieving such control demanded a synthetic method for Ni–Mo that was independent of the substrate on which it was to be deposited.
1
μ
m
500 nm
40 nm
40 nm
a
b
d
c
0 20 40 60 80 100 0
0.1 0.2 0.3 0.4
% Mo
HER Overpotential (V)
active catalyst precursor solution
0.1 1 10
101
102
103
Mass Loading (mg cm−2)
Cathodic Current Density (mA cm
−2
)
η=100
mV
η=200
mV
−0.3 −0.25 −0.2 −0.15 −0.1 −0.05 0 0.05 −1
−0.9 −0.8 −0.7 −0.6 −0.5 −0.4 −0.3 −0.2 −0.1 0 0.1
Potential vs. RHE (V)
Current Density (mA cm
−2
) 0% Mo
1% Mo
4% Mo
12% Mo
demonstrated previously with Cd.69 The fundamental mechanism of Ni–Mo HER electrocatalysis could also be probed using various in situ or in operando spectroscopic probes, such as Raman spectroscopy and photoelectron spectroscopy. Elucidation of the fundamental mechanistic behavior of Ni–Mo catalysts is a worthwhile goal, in that it may allow for generation of significantly more active HER catalysts in the future. Ni–Mo nanopowders as well as metallurgical samples are particularly useful candidates for further study.
2.6
Ni
2P Nanoparticles
Early in 2012, Raymond (Ray) Schaak joined the CCI Solar effort as a new principal investigator. Soon thereafter we initiated a collaboration intended to leverage the nanomaterials synthesis capabilities of the Schaak group with the electrochemistry experience of the Lewis and Gray groups. In less than a year, this collaboration resulted in fruitful results regarding a promising new HER catalyst, Ni2P.
Early in 2012, Ray sent two graduate students, Eric Popczun and Matthew Buck, to Caltech to work with me on electrochemical characterization of several types of nanoparticles that the Schaak group had already been synthesizing.100 We collected HER activity data under alkaline conditions for a series of transition metal sulfides and selenides deposited by drop-casting onto Ti substrates. Results for nanoparticle films that showed significant HER activity above the Ti foil background are shown in Figure 2.21.
Although several Co sulfides gave several orders of magnitude higher HER activity than the Ti substrate, this was still several orders lower in activity than Ni–Mo nanopowders with the same mass loading. We did not pursue these catalyst materials any further. Nevertheless, the collaboration demonstrated that materials synthesized by methods used in the Schaak group could be active electrocatalysts.
Figure 2.23. Pseudo-steady state HERj–E data for Ni2P nanoparticle films deposited at ∼1 mg cm−2 mass loadings on Ti foils, along with the relevant controls. Acid data were collected in a two-compartment cell using a Ru/Ir oxide counter electrode separated by a Nafion membrane and a Ag/AgCl reference electrode in the working compartment. Alkaline data were collected in a single-compartment cell using a Ni mesh counter electrode and a Hg/HgO reference. All solutions were saturated with H2. Contact and solution resistances were compensated using the current-interrupt technique. From Popczun et al.52 Used with permission.
particles in hexanes and drop-casting onto Ti foils. After annealing for 1 hour at 450 ◦C under forming gas, the resulting catalyst films exhibited high activity and good
stability toward the HER under both acidic and alkaline conditions. Representative data for Ni2P HER activity in acid and base are shown in Figure 2.23. Eric also showed, using infrared spectroscopy, that the annealing step removes the organic solubilizing agent from the particle surfaces, as demonstrated in Figure 2.24, allowing for direct access of reactants to the clean catalyst surface.
in Figure 2.5.
Chapter 3
Silicon Hydrogen-Evolving
Photocathodes
3.1
Introduction and Background
This chapter describes work on characterising Si composite photocathodes with Ni, Ni–Mo, and Pt electrocatalysts. Most of the work herein was accomplished close collaboartion with Emily Warren. Emily was broadly responsible for development of Si microwire light absorbers. Details on synthesis and characterization of microwires are available in the published literature and in Emily’s dissertation.36,115,116 I was responsible for development of the catalyst components of Si hydrogen evolving pho-tocathodes; therefore the emphasis of this chapter is on work involving catalysts.
Emily and I extensively characterized the behavior of electrodeposited Ni and Ni– Mo on p-Si substrates in both planar and microwire geometries. We also compared the resulting hydrogen evolution behavior to the performance obtainable by depositing Pt onto p-Si by a wet chemical (electroless) method as well as by e-beam evaporation. We further optimized depositions of Ni–Mo and Pt onto Si microwires that had been processed into n+p homojunctions in attempts to demonstrate high energy conversion efficiencies for PEC hydrogen evolution.
through a new device design that takes advantage of the deposition flexibility afforded by Ni–Mo nanopowder.
The vast majority of previous work on semiconductor-metal composite photo-cathodes for driving the HER under illumination incorporated noble metals as the cocatalyst. The Wrighton group used Pt catalysts to generate hydrogen-evolving photocathodes based on WS2 and p-Si.117–119 The Texas Instruments company also used Pt catalysts for the hydrogen evolution half reaction in their solar energy storage system that accomplished net HBr splitting instead of water splitting.25,120 More re-cently, earth-abundant MoS2 catalysts have also been applied to p-Si light absorbers for photoelectrochemical hydrogen generation,102,121 but conversion efficiencies for these systems remain low.
The most well-known example of PEC hydrogen evolution using a p-type semi-conductor is the work by Heller and coworkers on InP photocathodes.122,123 They reported in a series of papers that very high energy conversion efficiencies could be obtained when p-InP was coated with a thin layer of discontinuous, nanoparticulate noble metal catalysts such as Pt, Pd, Ru, and Rh. Furthermore, Heller et al. found that their semiconductor-catalyst composite electrodes exhibited high light absorp-tion in spite of the high fracabsorp-tional coverage of metal films on their surfaces.124–126
Shannon Boettcher, a Lewis group postdoc, benchmarked the performance of Si n+p-junctions deposited with Pt cocatalysts for the HER under illumination. He was able to generate both planar and microwire array composite photocathodes, and both gave large photovoltages and fast kinetics for the HER under solar-simulated conditions, as shown in Figure 3.1.46 Emily and I expanded significantly on this initial work by undertaking a more elaborate study on the PEC hydrogen evolution properties of several catalysts on Si electrodes of various types.49,50
3.2
Deposition and Characterization
depositions, was the best approach. For microwires, Ni–Mo depositions required significantly higher current densities to obtain active catalysts. We found the best method for Ni–Mo deposition on p-Si microwire substrates was to deposit under galvanostatic conditions at −50 mA cm−2, or under potentiostatic conditions at a potential sufficiently negative to result in cathodic current densities of 50–100 mA cm−2.
Platinum deposition was carried out by an electroless method from H2PtCl6/HF solution or using e-beam evaporation. Electroless Pt proceeds as in Equations 3.1 and 3.2:
H2PtCl6+ Si0+ 2 H2O−→Pt0+ SiO2+ 6 HCl (3.1)
SiO2+ 6 HF−→ H2SiF6+ 2 H2O (3.2)
where Pt(IV) reacts with Si to generate Pt metal and Si oxide. The Si oxide is subsequently etched by HF to give a clean Si surface so that the Pt deposition may continue.127
Deposition of catalysts onto Si photoelectrodes always resulted in dimished pho-tocurrents as a result of blocking incoming photons with the catalyst overlayer. In extreme cases light blocking by the catalyst during deposition resulted in such a large attenution of the incoming light flux that the semiconductor could no longer support sufficient current flow to sustain further catalyst deposition. Under potentiostatic conditions, this resulted in halting of the deposition; but under galvanostatic condi-tions, light attenuation eventually caused the potentiostat to apply a very negative potential in order to “break down” the diode to supply the required current. In such cases we generally found that the photoelectrode energy conversion properties were badly degraded.
96 98
100 102
104 106
Binding Energy (eV)
Counts (arb.)
Si0
a
c
b
Si−O
3.3
Si Homojunctions
To ameliorate problem of low photovoltages, we diffused n+-Si emitters into the outer layers of p-Si microwire arrays using vapor-phase phosphorus precurors, thereby gen-erating n+p-Si homojunctions.128 Shannon Boettcher reported that microwire array homojunctions could generate photovoltages in excess of 500 mV for the HER under illumination.46 We had difficulty producing microwire substrates and doping results that matched Shannon’s initial results, but we were able to produce n+p-microwire arrays with photovoltages of >400 mV.
Additionally, we addressed the challenge of low photocurrents from p-Si microwire arrays by incorporating TiO2 nanoparticles into a silicone polymer matrix deposited at the bases of the microwires prior to catalyst deposition. This TiO2 layer was in-tended to improve photocurrents by latterally scattering photons that passed between the wires, resulting in increased absorption.43 We also optimized Ni–Mo electrode-position and Pt evaporation on these composite photocathodes. The best results for Si microwire homojunctions, along with the optimized previous results from p-Si microwires with Ni–Mo and Pt catalysts, are shown in Figure 3.6. The thermody-namically based energy conversion efficiencies (η) for these n+p-Si electrodes were 2.2% and 3.5% for the Ni–Mo- and Pt-coated samples, respectively.50
There were several notable features from Si microwire n+p-homojunction devices deposited with Ni–Mo catalyst. First, the fill factors remained rather low due to relatively sluggish onset of HER current. Second, the photocurrents also remained rather low, even after incorporation of light scattering elements. Both of these factors stemmed from the same root cause, which was that catalyst deposition still resulted in inevitable loss of absorbed light flux due to blocking.
A
B
7
μ
m
20
μ
m
Figure 3.8. Schematic illustrations of two different modes of catalyst deposition onto Si microwires. (A) Top-down view of a square-packed microwire array, with 2.5 µm wire diameters and 7µm pitch, conformally coated with a 250 nm-thick catalyst layer. One unit cell is contained in the gray square. (B) Side-on view of a microwire array with the same dimensions deposited with 6 µm of catalyst conformally at the base. Assuming the catalyst in (B) is more porous and therefore half as dense as in (A) the total catalyst mass loading per projected area in both cases is equivalent.
The microwire geometry, however, allows for a different approach to photocath-ode design that is not plausible for a planar geometry, and may allow for the use of high catalyst loadings while still retaining high light absorption in the light absorber component. This approach is outlined schematically in Figure 3.8, and involves selec-tive deposition of a relaselec-tively high mass of catalyst at the bases of high aspect ratio structures such as Si microwire arrays. Because of the relatively sparse nature of Si microwire arrays, a conformal catalyst film several hundred nm in thickness around each microwire, which was shown in Chapter 2 to be comparable in HER activity to a planar Pt film, occupies only ∼10% of the total volume of a microwire array. Using this design, it should be possible to achieve Pt-like activity from a relatively high mass of a non-noble catalyst while still retaining optical accessibility of the vast majority of the light absorber component.
Substrate/membrane
Catalyst layer
Light scattering layer
Light absorber
Figure 3.9. Schematic representation of a hydrogen evolving photocathode with the “MEA” device architecture. The base of a high aspect-ratio wire array is deposited with an underlayer of active catalyst material, analogous to an MEA active layer, and an overlayer of light scattering material anlogous to an MEA gas diffusion layer (GDL).
Therefore I proposed the full device structure shown in Figure 3.9, which I call the “MEA” architecture due to its resemblance to a fuel cell or electrolyzer membrane electrode assembly (MEA). It is characterized by a microwire array on the order of 100µm in height, where the base of the array is deposited with two layers of material. The first layer is a relatively thick (5–10 µm) catalyst layer, consisting of a porous non-noble HER catalyst such as Ni–Mo. The second layer is a relatively thin (1–3µm) layer of a light scattering material such as particulate TiO2.
If both layers are made sufficiently porous, reactant species (e.g., water or H3O+) can diffuse through and hydrogen gas diffuse out. Photons, however, when incident on the scattering layer, would be reflected laterally and never “see” the highly absorb-ing catalyst layer. A similar light scatterabsorb-ing approach was proposed for Si microwire photovoltaics, and optical models suggested that very high photocurrents were obtain-able with such a design.43 In principle, the MEA approach allows for simultaneously maximizing catalytic activity and light absorption, even when using a relatively large catalyst mass loading.
Figure 3.10. Scanning electron micrographs of a microwire array deposited with layers of Ni–Mo and TiO2 nanoparticles at the base using a centrifugation method. The detail on the right is of the boxed area on the left. The boundary between the Ni–Mo (bottom) and TiO2 (top) layers is discernible due to the smoother appearance and more regular size dispersity of the TiO2 particles.
−0.6 −0.4 −0.2 0 0.2 0.4 −60
−50 −40 −30 −20 −10 0 10
Potential vs RHE (V)
Current Density (mA cm
−2
)
Dark
100 mW cm−2
∼300 mW cm−2
∼700 mW cm−2
Chapter 4
Tungsten Diselenide
Photocathodes
4.1
Introduction and Background
This chapter details synthesis and electrochemical characterization of p-type WSe2 photocathodes as an alternative to Si in a solar water splitting scheme. The work described herein was carried out in close collaboration with Lewis group graduate student Adam Pieterick. We synthesized highly crystalline p-type WSe2by a chemical vapor transport method, and characterized it as a photocathode using various redox couples, including the hydrogen couple.
Our crystalline p-WSe2 photoelectrodes decorated with noble metal catalysts (Pt and/or Ru) exhibited strikingly high energy conversion efficiencies for hydrogen evolu-tion. These photoelectrodes also showed good stability while carrying out reductions under simulated sunlight in aqueous solution at low and high pH. Using various elec-tochemical and photoelectrochemical techniques, we were able to explain both the strengths and limitations of p-WSe2 as a candidate solar absorber in a solar wa-ter splitting scheme. The chapwa-ter concludes with some further discussion of these strengths and limitations as well as recommendations on paths forward for p-WSe2.
A
B
C
Se6
6-WIV
5d
L π
z2
x2-y2, xy
xz, yz
filled d/p bonding
Figure 4.2. Scanning electron micrograph of an as-grown WS2 crystal exhibiting the characteristic layered hexagonal crystal habit. Full scale of the image is approximately 2 mm.
W. The electronic structure of trigonal prismatic transition metal dithiolenes has been a matter of considerable debate,133,134 but the most recent data suggest that Mo and W trigonal prismatic dithiolenes are best describes as d2 systems with the highest occupied molecular orbital consisting of essentially nonbonding dz2.132 This
is largely in agreement with the consensus for electronic structure of layered MX2 solids.135,136 Figure 4.1C depicts a molecular orbital diagram for a putative WSe6 fragment, illustrating its trigonal prismatic splitting and highly covalent interactions. Figure 4.2 also shows a scanning electron micrograph of a small WS2 crystallite, clearly demonstrating its layered hexagonal crystal habit.
photo-commercial solar cells in favor of, e.g., the cadmiun and copper-based chalcogenides that are used as thin-film PV materials today.147,148 In any case, the success of this class of compounds in efficient, stable aqueous photoelectrochemical energy conversion remains remarkable to this day.
Curiously, in the course of all of the development of layered MX2 materials for photoelectrochemistry, relatively little was done to assess the possibility of synthesis and use of p-type crystals as aqueous or nonaqueous photocathodes. As noted previ-ously, Gerischer et al. briefly studied the HER properties of p-WSe2 coated with thin Pt films under strongly acidic conditions, achieving high photovoltages but low net energy conversion efficiencies.130 Cabrera and Abruña synthesized polycrystalline p-type MX2 films and found that they exhibited reasonably large photovoltages but low photocurrents under monochromatic and white-light illumination.145 The Wrighton group, in collaboration with crystal growers from GTE technologies, successfully syn-thesized p-WS2 single crystals and found that they gave very large photovoltages for hydrogen evolution in strong acid when decorated with Pt cocatalysts.117 This result in particular motivated our work on p-WSe2materials in attempts to achieve similarly high photovoltages and improved η values as compared with Gerischer’s work.
4.2
Synthesis
WSe2(s) WO2Cl2(g) + Se(g) WSe2(s)
T (
o
C)
Position (cm)
1000
970
0 30
Figure 4.3. Reaction scheme (top) and temperature gradient required (bottom) for growth of crystalline MX2 from polycrystalline starting materials in a sealed tube using the CVT method. The position scale on the gradient plot corresponds to the tube diagram above.
growth interval, the ampule is cooled and carefully broken to give access to one or more relatively large single crystals that nucleated and grew within the tube.
During CVT crystallization the transport agent reacts with the polycrystalline powder to generate a low steady state concentration of volatile species, which is in dynamic equilibrium with the solid phase. The temperature gradient provides both convective transport and a small thermodynamic driving force for transfer of the solid material from the “hot” zone toward the “cold” zone. If the kinetics and cleanliness of the system are appropriate, the transport reaction proceeds by spontaneous nucle-ation and slow growth of only one or a limited number of crystal nuclei, resulting in relatively large single crystals with high electronic quality.
Figure 4.4. Photograph of a large WSe2 crystallite grown by CVT using WO2Cl2 transport agent without any extrinsic doping source. Numbered demarcations on the ruler are centimeters.
shows an optical image of one of the largest apparently single-crystalline specimens of undoped WSe2 grown by this method. Addition of Nb to the transport reaction significantly decreased the yield and size of the crystallites grown over the same time period as an undoped growth. However, p-WSe2 crystals gave remarkable efficient and stable photoreductions, as described in the following sections.
4.3
Initial HER Studies
Since many of the favorable properties of WSe2 light absorbers were already under-stood from studies on n-type material, we decided to undertake studies of its hydrogen evolution properties immediately upon sucessfully synthesizing p-type crystals of suf-ficient size for mounting as electrodes. We found that both Ga/In eutectic as well as pure In were able to give ohmic contact to p-WSe2 samples after being rubbed or sol-dered onto the crystal surface, respectively. However, the best quality electrodes were obtained by first generating the ohmic back contact with In solder and then carefully removing one or more layers from the front face of the electrode using adhesive tape, until a surface with minimal texture was revealed.
−0.5 0 0.5 1 −1
−0.8 −0.6 −0.4 −0.2 0 0.2 0.4 0.6 0.8 1
Potential vs RHE (V)
Current Density (mA/cm
2 )
light dark
Figure 4.8. Scanning electron micrograph of a p-WSe2 electrode after Pt deposi-tion and photoelectrochemical HER testing. The Pt film exhibited a nanostructured morphology with preferential deposition of metal along crystal step edges.
−0.2 0 0.2 0.4 0.6 0.8
−30 −25 −20 −15 −10 −5 0 5 10
Potential vs RHE (V)
Current Density (mA cm
−2
)
no catalyst
Ru/Pt Pt Ru
Figure 4.12. Optical micrographs at low (top) and high (bottom) magnification of the electrode used for PEC measurements in Figure 4.11 before stability testing (left), after testing at pH 2 (middle), and after testing at pH 10 (right). Scale bars are 500 µm (top) and 200µm (bottom).
ity under both acidic and alkaline conditions. The cathodic photocurrent degraded by a very small amount during testing in acid, and then degraded from ∼14 to
∼12.5 mA cm−2 over the course of the experiment at pH 10. The associated
mi-crographs show only the emergence of a few small cracks after the acid experiment, and then no further change after testing at pH 10. The cracks appeared to coincide with existing defects in the crystal surface, suggesting some corrosion associated with defects or surface step edges.
−0.2 −0.1 0 0.1 0.2 0.3 0.4 0.5 0.6 −30
−25 −20 −15 −10 −5 0 5
Potential vs Solution (V)
Current Density (mA cm
−2
)
Dark
100 mW cm−2
200 mW cm−2
50 mW cm−2 25 mW cm−2
Figure 4.15. PEC j–E data for a representative p-WSe2 crystal under illumination in RuHex3+/2+ solution. The electrolyte was N
2-purged 50 mM Ru(NH3)6Cl3 with
4.16. For electrodes exhibiting highly pristine surface morphologies, the flat band potential did not significantly shift with pH. For electrodes with considerable density of surface defects and step edges, however, the band edges remained largely fixed from acidic to neutral pH values, but shifted in the negative direction from neutral to alkaline pH.
Statistical data for Mott-Schottky results from 9 different p-WSe2 electrodes are shown in Figure 4.17. The electrodes fell into two distributions, corresponding to whether or not the flat band potentials shifted significantly from neutral to alkaline conditions. These two populations were highly correlated with surface morphology, where electrodes with smoother surfaces uniformly corresponded to the population exhibiting low pH-dependence.
Most classical semiconductors, such as Si and TiO2, exhibit negative shifts in their flat-band potential with increasing pH.162,165 This effect is due to changing the state of protonation or hydroxylation of the semiconductor surfaces in aqueous solution, resulting in static dipoles that shift the band edges in the same direction as the HER and OER (i.e., negative on the electrochemical scale with decreased H+activity). We intepret the absense of such a shift in p-WSe2 to its a highly inert exposed Van der Waals surface resulting in only weak interactions with solution species such as H+and OH−. This also explains why p-WSe2 electrodes with stepped or defective surfaces exhibited some band edge shift, as the steps and defects are much more reactive toward solution species. Our observations are quite similar to those of Lewerenz et al., who also observed essentially no flat-band potential shift for WSe2 electrodes with pristine surfaces, but large shifts for electrodes with stepped surfaces.143
4.6
Complete Picture of p-WSe
2Figure 4.18. Schematic depiction of the pH-dependence of the band edge positions, on an electrochemical scale, for a hypothetical p-type semiconductor analogous to TiO2 (top) and for a p-WSe2 electrode with a pristine surface (bottom). In the case of p-WSe2, unlike TiO2, the band edges do not shift with pH, resulting in progressively increased built-in potentials (red double-headed arrows) with increasing pH.
400 500 600 700 800 900 1000
400 500 600 700 800 900 1000
Figure 4.20. Scanning electron micrograph of the powder that results from heating together tungsten metal with Na2S and pure S under inert gas. Scale bar is 20µm.
generation thin film solar absorbers (CdTe and CIGS).147,148 Access to arrays of mi-croscopic chalcogenide single crystals might enable engineering of their morphology to allow for absorption and charge-carrier separation near basal planes and catalysis on edge sites. Alternatively, arrays of self-similar microcrystals would allow for devel-opment of systematic strategies to passivate recombination or corrosion at exposed edge sites.
Chapter 5
Summary and Conclusions
A decade ago it was not clear whether earth-abundant catalyst could be used for integrated PEC hydrogen evolution. In the last five years we have developed two ca

![Growth and characterisation of terrace graded virtual substrates with Si[subscript 1 x]Ge[subscript x] 0 15 ≤ x ≤ 1](data:image/gif;base64,R0lGODlhAQABAIAAAP///wAAACH5BAEAAAAALAAAAAABAAEAAAICRAEAOw==)