© 2018 IJSRCSEIT | Volume 3 | Issue 3 | ISSN : 2456-3307
Investigation of Lazy Classification in Data Mining using
WEKA tool
Paramjeet Kaur*1, Poonam Rani2
2Department of Computer Science and Applications, Chaudhary Devi Lal University, Sirsa, Haryana, India 1Assistant Professor, Department of Computer Science and Applications, Chaudhary Devi Lal University, Sirsa,
Haryana, India
ABSTRACT
Lazy classification is would allow data domain of complex nature that cannot be properly explained by various learning algorithms. In this research we are getting Correlation coefficient error, mean absolute error, root mean square error, relative absolute error, root relative square error analysis using WEKA. Calculation of mean absolute error, root mean square error, relative absolute error, root relative square error analysis using WEKA would be made for KSTAR, LWL, and IBK. Comparative analysis would be made of all these three lazy classifiers. Here we would take real dataset of advance handsets. In this reading there are mobile name, screen size, CPU speed, number of Sims, Ram size and pixel. It is found from research that there is minimum error in case of KSTAR.
Keywords: Lazy Learning, Data mining, KSTAR, LWL, IBK
I.
INTRODUCTION
Removal of data is not just process that are likely to play out information mining similar incorporates other some procedures like Data Integration, Data Cleaning, Data Mining, Pattern Evaluation, Data Transformation, and Data Presentation.
Purpose of data mining is extracting vital information from huge databases or data warehouses. Many Data mining applications have used for commercial and scientific sides. This kind of study forcefully explains Data Mining system into scientific side. Here Scientific data mining differentiates itself and explores that nature of datasets is various from present market concentrated data mining applications.
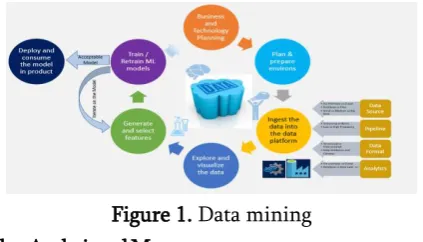
Figure 1. Data mining Market Analysis and Management
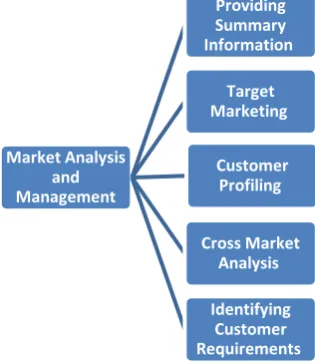
Planned below are many area of market where data mining is used
1. Cross Market Analysis:- Mining performs association / correlations between product sales.
2. Target Marketing:- Data mining helps to find clusters of model customers who share same characteristics such as interests, spending habits, income, etc.
Figure 2. Market Analysis and Management
4. Target Marketing − Data mining helps to find clusters of model customers who share same characteristics such as interests, spending habits, income, etc.
5. It provides us with summary of information- Data mining provides us various multidimensional summary reports.
II.
PROBLEM STATEMENT
Lazy learning is consider as learning processes where process of generalization ahead of training information is belated until a query for processing is sent to system. It is just opposite to eager learning in which system is opting to generalize training information just before queries are received .Case-based reasoning major benefit of lazy learning method is. Its target function is exist locally just like k-nearest neighbour algorithm.
That is why lazy learning systems could solve several problems. It could also deal modification in problem domain.
The limitation in case of lazy learning consists of huge need of space in order to store complete training dataset. Second limitation is that lazy learning methods are slower to calculate. However, it is used in case of a faster training phase.
III.
OBJECTIVES OF RESEARCH
There are several classifiers in existence. In this research discussion for lazy classifier is made. Three classifiers KSTAR, LWL, IBK are considered here and comparisons of efficiency of such classifiers are made. Objective of research is as follow:-
1. To take a dataset of handset in order to make comparative analysis of different lazy classifiers.
2. Apply classifiers KSTAR, LWL, IBK on data set.
3. To Calculate Relative Absolute Error, Absolute Error, Root Mean Square Error and relative square error
4. To make comparative analysis of error in case of different classifiers.
5. To make conclusion of efficient of lazy classifier among them.
IV.
RESULT ANALYSIS
Reading data set from WEKA tool
Here we would take real dataset of advance handsets. In this reading there are mobile name, screen size, CPU speed, number of Sims, Ram size and pixel. Getting mean absolute error, root mean square error, relative absolute error, root relative square error analysis
The calculation of mean absolute error, root mean square error, relative absolute error, root relative square error analysis using WEKA would be made for KSTAR, LWL and IBK. Comparative analysis would be made of all these three lazy classifiers.
Getting mean absolute error, root mean square error, relative absolute error, root relative square error analysis using WEKA (process and screen shot).
Data analysis:-
1. Correlation coefficient error:-
Table 1. Data Set of Correlation coefficient error
Correlation coefficient analysis
INSTANCES KSTAR IBK LWL 10 0.1651 0.3423 0.6366
20
-0.0282
-0.1052 -0.2164
30
-0.0521
-0.1003 -0.2161
Here K-STAR has minimum Correlation coefficient error it is 0.0521 in case of K-STAR 0.1003 in case of ilk and -0.2161 in case of owl.
Figure 3. Comparative analysis of correlation coefficient of lazy classifiers
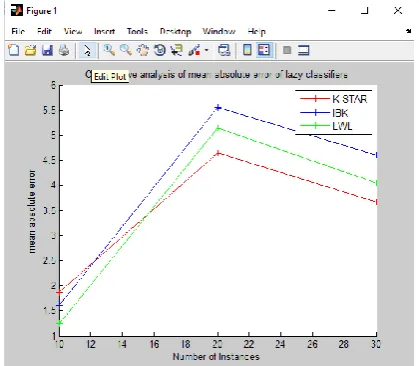
2. Mean absolute error:-
Table 2. Mean absolute error Mean absolute error
INSTANCE KSTAR IBK LWL
10 1.8671 1.6 1.2388
20 4.6405 5.55 5.1444
30 3.6696 4.6 4.0446
Here K-STAR has minimum mean absolute error it is 3.6696 in case of K-STAR 4.6 in case of IBK and 4.0446 in case of LWL.
Figure 4. Comparative analysis of mean absolutes error of lazy classifiers
3. Root mean squared error:- Dataset:-
Table 3. Root Mean squared error Root mean square error
INSTANCES KSTAR IBK LWL
10 1.8671 1.6 1.2388
20 4.6405 5.55 5.1444
30 3.6696 4.6 4.0446
Here K-STAR has minimum root mean squared error it is 3.6696 in case of K-STAR 4.6 in case of IBK and 4.0446 in case of LWL.
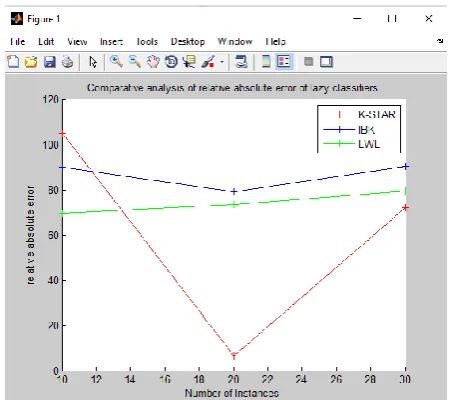
4. Relative absolute error:-
Table 4. Relative absolute error relative absolute error
INSTANCE KSTAR IBK LWL
10 105.03% 9000% 69.68%
20 6.62% 79.16% 73.38%
30 72.01% 90.26% 79.36%
Here K-STAR has minimum relative absolute error it is 72.01 in case of K-STAR 90.26 in case of IBK and 79.36 in case of LWL.
Figure 6. Comparative analysis of Relative absolute error of lazy classifiers
5. Root relative squared error:- Dataset:-
Table 5. Root relative squared error root relative square error
INSTANCE KSTAR IBK LWL
10 111.20% 95.46% 73.86% 20 99.34% 102.60% 98.81% 30 99.97% 103.21% 98.91%
Here K-STAR has minimum root relative squared error it is 99.97 in case of K-STAR 103.21 in case of IBK and 98.91 in case of LWL.
Figure 7. Comparative analysis of Root relative squared error of lazy classifiers
V.
CONCLUSION
Lazy classifiers are case based reasoning technique so they help in reducing redundancy. Case based reasoning techniques are do not store redundant
information in base if test case already existing in base. It simply returns class value of
existing replica case as a solution.
Lazy learning model supports incremental learning procedure. Model is open to new case or addition of knowledge every times. It is according to human mode of learning.
VI.
REFERENCES
[1]. Classification in Data Mining" Volume 12 Issue 2 Version 1.0 January (2012).
[2]. Ms S. Vijayarani, Ms M. Muthulakshmi(2013) "Comparative Analysis of Bayes and Lazy Classification Algorithms" International Journal of Advanced Research in Computer and Communication Engineering Vol. 2, Issue 8, August 2013.
[3]. Solomon Getahun Fentie Abebe Demessie Alemu.(2014) "A Comparative Study on Performance Evalution of Eager versus Lazy Learning Methods" International Journal of Computer Science and Mobile Computing Vol. 3, Issue. 3, March (2014).
[4]. Md. Nurul Amin, Md. Ahsan Habib (2015) Comparison of Different Classification Techniques Using WEKA for Hematological Data American Journal of Engineering Research (AJER) Volume-4, Issue-3(2015). [5]. Vaithiyanathan, V., K. Rajeswari, Kapil Tajane,
and Rahul Pitale. "Comparison of Different Classification Techniques Using Different Datasets."Vol.6, no. 2 (2013).
[6]. Sharma, Narendra, Aman Bajpai, and Mr Ratnesh Litoriya. "Comparison various clustering algorithms of WEKA tools."Volume2, no.5 (2012).
[7]. Salvithal, Nikhil N., and R. B. Kulkarni. "Evaluating Performance of Data Mining Classification Algorithm in WEKA." Vol 2, no. 10 (2013).
[8]. Khan, S. A., J. H. Epstein, K. J. Olival, M. M. Hassan, M. B. Hossain, K. B. M. A. Rahman, M. F. Elahi et al. "Hematology and serum chemistry reference values of stray dogs in Bangladesh." ." Vol. 1: 13-20 (2011).
[9]. Zhang, Wenjing, Donglai Ma, and Wei Yao. "Medical Diagnosis Data Mining Based on Improved Apriori Algorithm." Journal of Networks 9, no. 5: 1339-1345 (2014).
[10]. Nookala, Gopala Krishna Murthy, Bharath Kumar Pottumuthu, Nagaraju Orsu, and Suresh B. Mudunuri. "Performance analysis and evaluation of different data mining algorithms used for cancer classification." International Journal of Advanced Research in Artificial Intelligence (IJARAI) 2, no. 5 (2013).
[11]. Tiwari, Mahendra, Manu Bhai Jha, and OmPrakash Yadav. "Performance analysis of Data Mining algorithms in WEKA." IOSR Journal of Computer Engineering (IOSRJCE) ISSN : 2278-0661, Vol.6, Iss.3 (2012).
[12]. Kaushik H. Raviya, Biren Gajjar "Performance Evaluation of Different Data Mining Classification Algorithm Using WEKA"Vol. 2, Issue. 1. (2013).
[13]. Saichanma, Sarawut, Sucha Chulsomlee, Nonthaya Thangrua, Pornsuri Pongsuchart, and Duangmanee Sanmun. "The Observation Report of Red Blood Cell Morphology in Thailand Teenager by Using Data Mining Technique." Advances in hematology (2014). [14]. Bin Othman, Mohd Fauzi, and Thomas Moh
Shan Yau. "Comparison of different classification techniques using WEKA for breast cancer." 3rd Kuala Lumpur International Conference on Biomedical Engineering 2006. Springer Berlin Heidelberg, (2007).