Original Article
The proliferative state, graft-site and contact-time of
competent chick ectoblast determine the quality and
quantity of neural induction by Hensen’s node
SHARMILA DESHMUKH-BARVE
1, DEEPTI JOSHI-BANKA
1and SOHAN P. MODAK*
,21Department of Zoology, University of Pune and 2Department of Zoology, Karnatak University, Dharwad, India
ABSTRACT We have assessed the type and amount of neural tissue induced in the chick gastrula ectoblast with increasing duration of contact with the Hensen node inducer. At least 4 h contact is necessary to induce the ectoblast in the area pellucida, 9 h in the area opaca and even longer at the margin of overgrowth. In the area pellucida, the inductive response shifts from archencephalic type at 4-6 h contact to deuterencephalic type after 9 h contact. The induced tissue volume and cell number increased as graft-host contact increased from 4-9 h, and then decreased with longer contact. We suggest that in addition to the period of contact and the grafting position on competent ectoblast, the rate of cell proliferation may control the axial specificity and morphological organi-zation of the induced neural tissue.
KEY WORDS:
neural induction, neural competence, cell proliferation, morphometry, chick embryo
0214-6282/2003/$25.00
© UBC Press Printed in Spain
www.ijdb.ehu.es
*Address correspondence to: Prof. Sohan P. Modak. 759/75, Deccan Gymkhana, Pune 411004, India. Fax: +91-20-565-7543. e-mail: spmodak@rediffmail.com
Abbreviations used in this paper: TG, cell population doubling time.
Introduction
Interaction between the host ectoblast and chorda-mesoblast results in induction of neural tissue and establishment of the nervous system in the amphibian (Spemann & Mangold, 1924) and avian (Waddington, 1932) embryos. The neural induction has been suggested to occur in two distinct steps, namely, or evocation-individuation (Waddington,1950) dorsalization-caudalization (Yamada,1950,1958,1990,1994,1995) or activation- transforma-tion (Nieuwkoop,1952). Conceptually, the above 3 sets overlap and are often used interchangeably. The activating and transform-ing signals responsible for antero-posterior patterntransform-ing of the neural tissue have been studied extensively (Bronner-Frazer and Fraser, 1997). Dorsalization occurs at all antero-posterior levels whereas caudalization is restriction to the posterior region in form of a postero-anterior gradient and exerts a negative cell cycle regula-tion (Yamada, 1950, 1994,1995). Addiregula-tion of increasing amount of posterior mesoderm to the chick gastrula shifts the gradient border-line anteriorwards and causes caudalization seen in form of reduced head structures and inhibition of cell population growth (Joshi-Banka et al., 2002) and mimics the effect of teratogens like isonicotininc acid hydrazide, trypan blue, lithium chloride and retinoic acid (Joshi et al., 1990; Ghatpande et al., 1991, 1993; Modak et al., 1993). It was suggested (Yamada, 1950; 1994; 1995) that, in the absence of caudalization, dorsalized ectoderm exhibits anterior or archencephalic differentiation, a weak caudalization of the dorsalized ectoderm leads to deuterencephalic differentiation
while with strong caudalization a spino-caudal differentiation is expressed. Once induced, the neural tissue is organized into a neural tube and undergoes regionalization (Yamada, 1950; Waddington, 1952; Nieukwoop, 1952). The regional inductions are caused by simultaneous actions of neuralizing and mesodermalizing principles distributed in a gradient form (Yamada, 1950 and Nieuwkoop, 1952).
Cell lineage-specific differences in cell proliferation may be relevant to differential growth and development of different organ systems. Chick blastoderm cells proliferate with an average dou-bling time of 6h between stages 1 to 7, i.e., till early neurulation, which then increases to 12 h between stages 8 and 12 (McMaster and Modak, 1977). The cell proliferation rates differ considerably among various cell layers, e.g., Cell population doubling time (TG) of gastrula area pellucida is 18 h while it is 6.1h in the area opaca (Sonawane, Ph.D. thesis. 2000). Thus, during active neural induc-tion the area pellucida ectoblast divide very slowly; proliferative activity of ectoblast increases as one move away towards the margin of overgrowth (Deshmukh et al., 2001).
356 S. Deshmukh-Barve et al.
postulate that the differences in the cell population doubling activity is also correlated with changes in the amount and type of neural tissue induced at different positions in blastoderm with increasing contact with the inducer Hensen’s node graft.
Results
We have transplanted Hensen’s node derived from a stage 4 (Hamburger & Hamilton,1951) donor at the anterior margin of the area pellucida. mid-area opaca or the margin of overgrowth (Fig. 1) of host chick blastoderm of same developmental age cultured in vitro according to Gallera & Castro-Correia (1961). In these experiments, the endodermal side of the graft is placed directly in contact with the undersurface of the ecto-derm after removing the overlying host endoecto-derm. Grafts were surgically scraped off after allowing a contact for 2,4,6 or 9h as before (Deshmukh et al., 2001). In such experiments the graft tissue is completely removed as shown earlier (Joshi-Banka et al., 2001). It is to be noted that the graft ectoblast giving rise to donor neural tissue aligns with the host endoblast/endoderm, graft mesoderm lies between graft ectoblast and induced host ectoblast.
Area Pellucida (Position A)
Morphology
The morphological characteristics of the induced neural tissue were examined. In archencephalic induction, we observe forma-tion of anterior brain-like structure in the absence of underlying notochord. Mid- and hind-brain like structure with underlying notochord exemplify deuterencephalic structures while a well defined small and open neural tube underlined by a notochord and laterally positioned somatic mesoderm is characteristic of spino-caudal induction. In the area pellucida at least 4h-contact is required between the graft and competent host ectoblast to elicit neuralization (Fig. 2) of archencephalic type (Table 1). After a 6h-contact, 3 hosts show archencephalic (Fig. 3) induction and 1 exhibit deuterencephalic induction. A 9h-contact leads to 1 archencephalic and 3 deuterencephalic inductions (Table 1). After 20h-contact the induced neural tube was deuterencephalic in 3 out of 5 hosts and archencephalic in 2 hosts. We conclude that with increased duration of contact, the induction shifts from archencephalic type to deuterencephalic in the area pellucida.
Morphometry
The induced tissue volume is 7.06x10⁻² mm3 after 4h-contact and increases to 7.80x10⁻² and 7.69x10⁻² mm3 after 6 and 9h, respectively, and then decreases to 5.55x10⁻² mm3 when the
HN-Fig. 1. Schematic diagram showing the posi-tion and duraposi-tion of the graft-host contact at the anterior rim of the area pellucida (Position A), middle of area opaca (Position B) and at the margin of overgrowth (Position C). AO, area opaca; AP, area pellucida; HN, Hensen’s node; MOG, margin of overgrowth; PS, primitive streak. Fig. 2. Transplantation of Hensen’s node graft onto full primitive streak stage embryos for varying time of contact between the graft and host ectoblast, in the area pellucida (Position A). The arrow points to in-duced neural tissue. (A) 2 h graft-host contact does not provoke neuralization in the competent ectoblast. (B)4 h contact leads to neuralization in the competent ectoblast. (C) Massive neuralization is observed in the host ecto-blast after a 6 h graft-host contact. (D) 9 h graft-host contact provokes neural in-duction in the host ectoblast. (E) Graft in contact for 20 h with host ectoblast induces it to neuralize and undergoes self-differentiation.
ectoblast contact is continued for 20h (Fig. 3A; Table 1). The induced cell number also increases from 1.824x10⁴ after a 4h-contact to 2.15x10⁴ and 1.69x10⁴ after 6- and 9h-contact, respec-tively, and then decreases to 1.30x10⁴ cells at 20h and the decrease in both tissue volume and cell number between 6-20h are statistically significant (p<0.05) (Fig. 5B, Table 1); the cell population density of induced neural tissue is unchanged regard-less of the contact-duration. Plots of tissue volume or cell num-bers against the time of contact reveal fit curvilinear regressions [volume: r=0.68, p≤0.01; cell numbers: r=0.78, p≤0.01] using a
A
B
C
D
2nd degree polynomial (Fig. 5 A,B). Thus, the induced neural tissue increases between 4 and 9h and decreases thereafter.
Area Opaca (Position B)
Morphology
When the HN was left in contact with host ectoblast for 2, 4 or 6h, none of the embryos exhibit neural inductive response in the area opaca. After 9h-contact and 11h culture in the absence of the graft, the inductive response was first weak medullary (Fig. 6) but improved considerably after a 20h-contact (Fig.7, Table 1).
Morphometry
The induced neural tissue volume (1.16x10⁻² mm3) after 9h-contact increased to 2.6x10⁻² mm3 after 20h-contact (p≤ 0.05). Similarly, induced cell population increased from 0.26x10⁴ after
9h-contact to 0.61x10⁴ after a 20h-contact (p≤ 0.025) although the cell population density was the same.
Margin of Overgrowth (Position C)
Morphology and Morphometry
At the margin of overgrowth transplanted HNs did not induce neuralization despite a contact with host ectoblast for 9h. After a 20h-contact, one host embryo showed medullary type induction (Fig. 8) while weak palisade type neural induction in 4 hosts. The volume and cell populations size of induced tissue were found to be 1.44x10⁻² mm3 and 0.33x10⁴, respectively.
In conclusion, the time of contact between HN graft and compe-tent ectoblast required to induce neuralization increases from 4h in the area pellucida to 9h in area opaca and even longer at the margin of overgrowth [>9h, <20h] with a concomitant weakening of the
Fig. 3. (Above) Serial transverse sections (section numbers indicated at the top left hand corner) of the chick embryo showing archencephalic type of neural induction obtained after 6 h graft-host contact in the area pellucida (Position A). FG, host fore gut; HNT, host neural tube; INT, induced neural tissue; NO, notochord.
358 S. Deshmukh-Barve et al.
A
B
grafts. We now show that the pellucida ectoblast indeed reacts fastest to neuralizing stimulus from HN graft although these cells exhibit a long cell population time (TG=18h). We conclude that due to a longer cell dou-bling time (TG) or lower proliferative activity, area pellucida ectoblast are accessible for longer duration to the inductive stimulus and its processing into the neuralizing re-sponse. In contrast, with shorter TG, the time available for receipt and processing of inductive stimulus is shorter in the ectoblast in the area opaca and the margin of over-growth.
In the area pellucida the inductive signal is transferred during first 1-2h of contact between the graft and host ectoblast (Joshi-Banka et al., 2001) but insufficient to voke neural induction while 4h-contact pro-vokes an archencephalic neural induction (Table 1) that progressively shifts towards more posterior or deuterencephalic type with increasing duration of contact. Con-comitantly, the size and cell number in-crease from 4 to 9 h and thereafter de-crease at 20h without affecting the density of cell population (Table 1). We have plotted the induced tissue volume (Fig. 5A) and cell numbers (Fig. 5B) against the time of con-tact and find that the data fitted best a curvilinear progression using a 2nd degree
Fig. 5. Relationship be-tween (A) the volume and (B) cell population size of the induced neural tissue obtained after 4,5,6,9 and 20 h graft-host contact in the area pellucida (Position A). An increase in the vol-ume and size of the cell population of induced tissue
TABLE 1
QUALITATIVE AND QUANTITATIVE ANALYSIS OF INDUCED NEURAL TISSUE OBTAINED AFTER VARYING DURATION OF GRAFT-HOST CONTACT
Graft Time of Number Type of I Induced Population Position contact (h) of embyros induction Neural Tissue Density
D A M N P Volume Cell no. % Cell no./ (x 10-2 x 10⁴ mitosis tissue
mm3) volume D – Deuterencephalic, A – Archencephalic, M – Medullary, N – Neuroidal, P – Palisade
neural induction in extent of morphological differentiation, tissue volume and cell population.
Discussion
A 4h-contact between the HN and competent host ectoblast of area pellucida is sufficient to obtain neural induction, while the minimum period of contact is 9h in the area opaca (present data) confirming earlier studies (Gallera, 1965, 1970, 1971; Leikola, 1976, Deshmukh et al., 2001). The ectoblast at the margin of overgrowth also exhibits neural competence (Deshmukh et al,. 2001) and we now show, for the first time, that the period of contact
required to elicit neural induction is even longer (<9h, >20h). Furthermore, with increasing duration of contact, the quality of neural induction shifts from archencephalic to deuterencephalic type in both pellucid and opaque areas with a concomitant regula-tion of the induced tissue volume and cell popularegula-tion size. At the margin of overgrowth a longer contact also improves the quality of induction. Comparison of the quality of neural induction at the 3 positions showed (Deshmukh et al., 2001) that ectoblast through-out stage 4 blastoderm is competent to neuralize wherein the relative cell proliferative activity increases with increasing distance from the primitive streak. We postulated that the duration of cell cycle is inversely related with the quality of neural response to HN
Fig. 6. A transverse section of the chick embryo showing a weak medullary type of neural induction obtained after 9 h graft-host contact in the area opaca (Position B). INT, induced neural tissue.
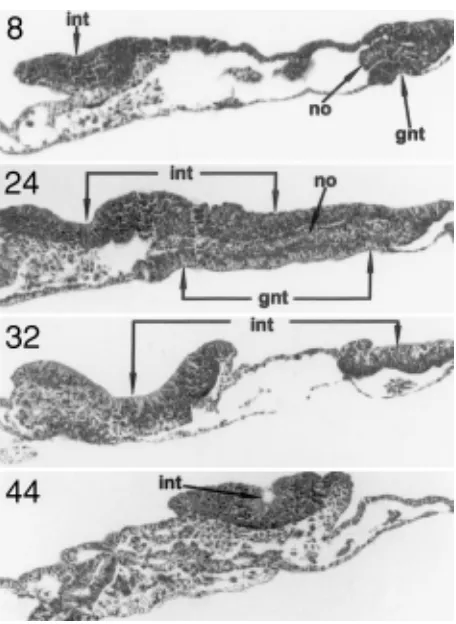
Fig. 7. Serial transverse sections (section numbers indicated at the top left hand corner) of the chick embryo showing an archencephalic type of neural induction obtained after 20 h graft-host contact in the area opaca (Position B). GNT, graft-derived tissue; INT, induced neural tissue; NO, notochord.
Fig. 8. A transverse section of the chick embryo showing a medullary type of neural induction obtained after 20 h graft-ghost contact at the margin of overgrowth (Position C).
polynomial. We postulate that the initial development of nervous system occurs in two phases. During the first phase, i.e., the onset of induction, cell number increases whereas in the second phase the cell proliferation is inhibited. As the neural tissue formed after 4h-contact is of archencephalic type and then shifts to deuterencephalic type, we suggest that, the initial effect of the inductive signal is mitogenic. In the second phase a mitostatic effect is exerted on the neural tissue, which then undergoes regionalization. According to Yamada (1950; 1952; 1990; 1994; 1995) and Yamada & Modak (1998) the axial morphological organization of the induced tissue occurs in two phases, dorsalization and caudalization. During dorsalization, the anterior type of neural tissue is formed, while caudalization leads to formation of posterior type of neural tissue mediated by Convergent Extension (CE) whereby the cell movement dependent on the direction of the cell intercalation, plays an important role in formation of posterior axis. Recently, Joshi-Banka et al. (2002) have shown that addition of exogenous posterior mesoderm of a post-nodal fragment caudalizes chick embryo and suggested that excessive mesodermalization induces caudalization. It is known that in absence of mesoderm the dorsalized ectoderm exhibits anterior or archencephalic differen-tiation (Smith and Harland, 1992; Lamb et al., 1993; Witta et al., 1995). The conversion of presumptive archencephalon to deuterencephalon depends on convergent extension. (Yamada, 1994; 1995). Thus, the shift from primitive archencephalic type of differentiation after a 4h contact to a more posterior type beyond 9h-contact appears to be due to the continued CE of contacting graft-derived mesoderm. When graft-derived mesoderm is left in contact for 4 and 6h and then removed, the host ectoblast responds in form of a archencephalic (fore brain) type of neural structures. As the contact period is increased to 9-20, the graft-derived meso-derm has completed CE and there is a perceptible shift in the differentiation of the neural tube to a more posterior deuterencephalic type. Thus, the neural induction and subsequent morphological reorganization appear to occur in three distinct steps, namely, evocation including initial 1-2h period needed for inductor-transfer (Joshi-Banka et al., 2001), the mitogenic phase (present data, Chatterjee & Modak, 2002, unpublished data) which lasts for 9h, and finally a relatively mitostatic phase beyond 9h (present data). Thus, the induced neural cells are subjected first to a positive cell cycle control and then a negative cell cycle control by the inducer graft.
The organizer involved in induction expresses genes for ecto-dermal dorsalization and mesoecto-dermal caudalization (Yamada, 1995). Dorsalizing genes involved in the early response genes and initiating most anterior type of differentiation include N-CAM (Hemmati-Brivanlou and Melton, 1992, 1994), Noggin (Lamb et al., 1993), Follistatin and Chordin (Sasai et al., 1995). Pintallavis (Ruiz I Altaba and Melton, 1992), XFD (Knochel, 1992) and Xnot (von Dassow et al., 1993) are involved in caudalization of both ectoderm and mesoderm while Xbra (Smith et al., 1993) and Xhox3 (Ruiz I Altaba and Melton, 1989) are responsible for only mesodermal caudalization. Thus, it will be important to test for the chronological hierarchy of gene expression specific for dorsal and caudal struc-tures in relation to the cell proliferative activity.
Materials and Methods
360 S. Deshmukh-Barve et al.
and Castro-Correia, 1960). A square (0.2mmx0.2mm) piece of the Hensen’s node (HN) from stage 4 embryo was excised and placed in the area pellucida (Position A), the area opaca (Position B) and the margin of overgrowth (Position C) of stage 4 blastoderm (Fig. 1). The HN graft was allowed to remain in contact with the host blastoderm for 2,4,6 or 9h and then surgically removed as before (Deshmukh et al., 2001). Blastoderms were then maintained in culture at 37.5±1°C for total period of 20h.
At each position and graft-host contact time, we used 12 hosts. Among these, 5 were fixed for whole mounts and the remaining were histologically processed to estimate cell numbers and morphometric parameters from serial sections. In all 210 host were cultured, drawn to scale on Camera lucida and fixed.
In controls, cultured embryos were allowed to grow for 20h without removal of the graft. The control and experimental cultures were fixed overnight in Bouin’s fixative and stained either as whole mounts, or pro-cessed for histology. Serial sections (6µ) were stained with Harris Haematoxylin or Mayer’s Haemalum. Five embryos were fixed immediately after removing the graft.
Morphometry
The cell morphology, tissue volume and the cell numbers were deter-mined as parameters of the quality of the neural induction. Outlines of induced neural tissue and graft tissue from each section were drawn to scale by Camera Lucida. The area (mm2) was measured using a planimeter and the tissue volume in each section was estimated as “tissue area (mm2) x section thickness x 0.0131 as the magnification factor (Deshmukh et al., 2001).
From the induced and the graft-derived neural tissue in every serial section, diameter of 50 interphase and 25 mitotic nuclei were measured with a micrometer fitted to the eyepiece. All chick cells are mononucleate and estimates of number of nuclei give the cell population size in the induced and graft-derived tissues from each section. These were corrected (Aberchombie, 1946) to avoid repetitive counting in adjacent sections and overestimation of cell numbers. The corrected cell numbers from each section were added to obtain the total cell population size in both induced neural tissue and graft-derived mesoderm. Data were tested for significance by Student’s “t” test (Snedecor and Cochran, 1967).
Acknowledgements
This work was supported by BRNS-DAE and UGC (SPM), The Lady Tata Memorial Trust, Mumbai (SDB) and CSIR-SRF (DJB). We thank Dr. M. Sonawane for help in statistical analyses.
References
ABERCHROMBIE, M. (1946). Estimation of nuclear population from microtome sec-tions. The Anatomical Record 94, 239-247.
BRONNER-FRASER, M. and FRASER, S.E. (1997). Differentiation of vertebrate neural tube. Curr.Opn.Cell Biol. 9, 885-889.
DESHMUKH, S, SONAWANE, M. and MODAK, S. P. (2001). Neural inductive response of competent chick ectoblast decreases away from the host axis and correlates with an increased proliferative activity. Int. J. Dev. Biol. 45, 759-766.
FUJITA, S. (1961). Kinetics of cell proliferation. Exp Cell Res. 28, 52-58.
GALLERA, J. (1959). La facteur “temps” dans l’action inductrice du chordomesoblaste et l’age de l’ectoblaste reagissant. J. Embryol. Exp. Morph. 7, 487-511.
GALLERA, J. (1970). Difference in reactivity to the neurogenic inductor between the ectoblast of the area opaca and that of the area pellucida in chickens. Experentia. 26, 1353-1354.
GALLERA, J. (1971). Primary Embryonic Induction in Birds. Adv. Morphogen. 9, 149-180.
GALLERA, J. and NICOLET, G. (1969). Le povoir inducteur de l’endoblaste presomptif contenu dans la ligne primitive jeune de poulet. J. Embryol. Exp. Morphol. 21, 105-118.
GALLERA, J. and CASTRO-CORREIA, J. (1960). Technique assurant la cicatrisation des excision pratiquées dans l’aire pellucide de jeune blastoderme de Poulet et
la possibilité des induction neurales dans l’ectophylle de l’aire vasculaire. C.R. Soc. Biol.154, 1728.
GALLERA, J. and IVANOV, I. (1964). La compètence neurogène du feuillet externe du blastoderm de Poulet en fonction du facteur ‘temps’. J Embryol Exp. Morph. 12, 693-711.
GHATPANDE, S. K, GUTTIKAR, G., PARANJAPE, S., MULHERKAR, L. and MODAK, S. P. (1990). Cell population growth in chick blastoderms cultivated in vitro. Indian J. Exp. Biol. 28, 526-530.
GHATPANDE, S. K., MULHERKAR, L. and MODAK, S. P. (1991). Cell population growth and area expansion in early chick embryos during normal and abnormal morphogenesis in vitro. Develop Growth and Differ. 33, 605-615.
GHATPANDE, S. K., VAIDYA, P. K., MULHERKAR, L. and MODAK, S. P. (1993). Lithium chloride and trypan blue induce abnormal morphogenesis by suppressing cell population growth. Develop. Growth Differ. 35, 409-419.
HAMBURGER, V. and HAMILTON, H. L. (1951). A series of normal stages in the development of the chick embryo.J. Morph. 88, 49-92.
JOSHI-BANKA, D, DESHMUKH, S. and MODAK, S. P. (2001). The neural inductive signal is transferred to ectoblast in 1-2 h but a continued contact with mesoblast for 2-3 h is essential for neuralization in the chick area pellucida. Int. J. Dev. Biol. 45, 767-770
JOSHI-BANKA, D., PARANJAPE, S., GHASKADBI, S. and MODAK, S. P. (2002). Post-nodal mesoblast caudalizes the host axis and inhibits cell population growth, and induces new primitive streaks in chick embryos. Dev. Growth and Differ. 44, 169-180.
LEIKOLA, A. and McCALLION, D.J. (1967). Time required for heterogenous induction in chick embryo ectoderm. Experientia, 23, 869-870.
LEIKOLA, A. (1976). Hensen’s Node – The ‘Organizer of the amniote embryo.
Experientia, 32, 269-277.
McMASTER, G. and MODAK, S.P. (1977). Cellular and biochemical parameters of growth of chick blastoderm during early morphogenesis. Differentiation, 8, 145-152
MODAK, S.P., GHATPANDE, S.K. RANE, R.K. and MULHERKAR L. (1993). Caudalization by retinoic acid is correlated with inhibition of cell population growth and expansion of chick blastoderm cultured in vitro. Int.J Dev. Biol. 37, 601-607.
NIEUWKOOP, P. D. (1952). Activation and organization of the central nervous system in Amphibians. I. Induction and activation. II. Differentiation and organization. III. Synthesis of new working hypothesis. J. Exp. Zool. 120, 1-106.
RUIZ I ALTABA, A. and MELTON, D.A. (1989). Involvement of homeobox gene Xhox-3 in pattern formation along the anterior-posterior axis. Cell, 106, 173-183. RUIZ I ALTABA, A., CHOI, T. and MELTON, D.A. (1992). Expression of the Xhox-3
homeobox protein in Xenopus embryos. Blocking its early function suggests the requirement of Xhox-3 for normal posterior development of the neural axis. Dev. Growth Differ. 33, 651-660.
SASAI, Y, Ly, B.,STEINBEISSER, H and De ROBERTIS, E.M. (1994). Regulation of neural induction by the Chd and Bmp-4 antagonistic patterning signals in Xenopus.
Nature, 376, 333-336.
SMITH, W.C., KNECT, A.K.WU.A. and HARLAND, M. (1993). Secreted noggin protein mimics the Spemann organizer in dorsalizing Xenopus mesoderm. Nature 361, 547-549.
SNEDECOR, G. W. and COCHRAN, W. G. (1967). In “Statistical Methods”. Oxford and IHB publishing Co., New Delhi.
SONAWANE, M. (2000). Cell population growth kinetics during development growth and differentiation. Ph.D Thesis, pp. 1-81, University of Pune, India.
SPEMANN, H. and MANGOLD, H. (1924). Ueber induction von embryonalanlagen durch implantation artfender organisatoren. Republished in English with corrections in Int. J. Dev. Biol. 45: 13-38 (2001).
WADDINGTON, C. H. (1932). Experiments on the development of chick and duck embryos cultivated in vitro. Phil. Trans. Roy. Soc. B. 221, 179-230.
WADDINGTON, C. H. (1950). Process of induction in the early development of the chick. Année Biol. 26, 711.
WADDINGTON, C.H. (1952). The Epigenetics of Birds. Cambridge university press, London.
YAMADA, T. (1950). Regional differentiation of the isolated ectoderm of the Triturus
gastrula induced through a protein extract. Embryologia 1,1-20.
YAMADA, T. (1990). Regulations in the induction of the organized neural system in amphibian embryos. Development. 110, 653-659.
YAMADA, T. (1994). Caudalization by the amphibian organizer: brachyury, convergent extension and retinoic acid. Development. 120, 3051-3062.
YAMADA, T. (1995). Anteroposterior specification in amphibian embryogenesis: The regulative roles of positive and negative controls of mitogenesis. Dev. Growth. Differ. 37, 365-372.
YAMADA, T. and MODAK, S. P. (1998). Genetic evidence for posterior specification by convergent extension in the Xenopus embryo. Develop. Growth Differ. 40, 125-132.