© 2018 IJSRCSEIT | Volume 3 | Issue 3 | ISSN : 2456-3307
Risk Prediction for Coronary Heart Disease Using C5.0 Decision
Tree Algorithm
M. Nivedhika
Computer Science Department, Pondicherry University, Pondicherry, India
ABSTRACT
Heart Disease is now-a-days one of the most leading causes of death rate in the worlds. Here we aim to explain the CHD predictive model using C5.0 one of the DT algorithm. In a every single day there are huge amount of data were providing in the hospitals. For making a correct decision for the disease some of the hidden information are not mined properly or effectively. So, here we are using some DM techniques which can make a solution to this situation. This work has been developed using the DM techniques namely DT (CART, C5.0) algorithms and classification (Naive Bayes, Neural Network) algorithms. Result shows each technique has its own specific strength in realizing the objective of the defined mining goals. Using attributes (age,sex,cp, trestbps, chol, fbs, restecg, thalach, exang, oldpeak, slope, thal, ca, num) it can predict the likelihood of patients getting heart disease. In this paper we studied and validated the predictive power of DM algorithms by comparing the performance of C5.0 with two classifier algorithm Naive Bayes, Neural Network and one DT algorithms CART. At finally we are comparing it Accuracy, Sensitivity, Specificity with two different types of classification algorithm and one DT algorithm. Contrary to the former study, the C5.0 algorithm performed best than the other two classifiers algorithm and one DT algorithm in predicting CHD, and C5.0 have the highest predictive power. This paper provides an insight about C5.0 DT algorithm used to predict the heart diseases. Keywords: Decision Tree(DT), Data Mining(DM) and C5.0 algorithm
I.
INTRODUCTION
According to the World Health Organization (WHO), the current statistics for the medical research is explained as heart diseases are got extra ordinary deal with working in the medical filed due to its consequence on the human health. Now-a-days Heart disease is one of the bigger reasons for cause of death rate for human being. Some non-modifiable factors, blood pressure, cholesterol, pulse rate are the major reason for the attacks. Artificial Intelligence (AI) techniques it is used as vastly in medical diagnosis. With the promotion of science, the sum of the gathered data in different fields has been enlarged that it is well known as the growth of information. When we are analyzing the
of the classification of heart disease. In all this upper place where mentioned the techniques of patient records are classified and predicted incessantly. The patient state is monitored incessantly, if there is a changes present, then the risk of disease is conversant to the heart patient and the doctor. The doctors are able to classify the heart diseases at an earliest phase because of machine learning algorithms and with the help of computer technology.
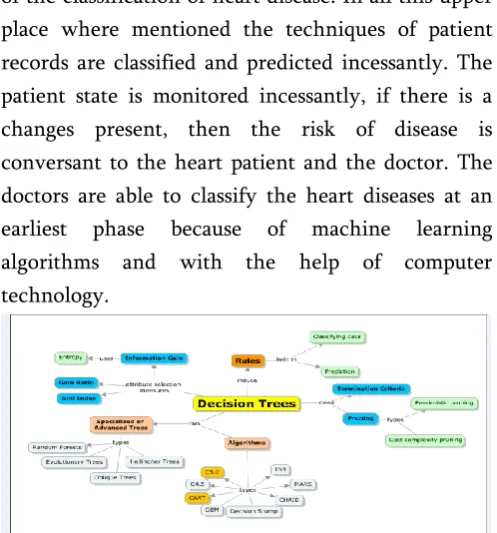
Figure 1. Working Process for DT algorithm
Figure 1 explains about how the DT are exploitation the various types DT algorithms, how the rules are predicting and methods are utilized for choice the measures of the given attributes. Although DM has been approximately for much than two time period, its latent is only being completed now. DM union applied math analysis, machine learning and database technology to excerption of the hidden patterns and relationships from the higher databases. DM were exploitation of two scheme: one is a supervised and another one is the unsupervised learning. In the Supervised learning, a training set is utilized to discover model parameters whereas in unsupervised learning no training set is utilized. Each DM technique service a different intent depending on the model of the objective. The two least ordinary model objectives are classification and prediction. Classification models predict categorical labels (discrete, unordered) while prediction models predict continuous-valued functions. DT and Neural Networks are used for the classification algorithms while Regression, and Navies Bayes algorithms. DT algorithms include CART (Classification and Regression Tree) and C4.5. These algorithms differ in
choice of division, when to stop a node from division, and assigning of class to a non-division node.
II.
LITERATURE SURVEY
Many works has been done connected to heart prediction system by using different kinds of DM algorithms and techniques by so many authors. The aim of all authors is to get a good or better accuracy and to make the method more efficient so that it can pretend the chances of heart attack.
Keyue Ding, Kent R Bailey and Iftikhar J Kullo [1] They have studied the demonstration of using the genotype and create a genetic risk rating and estimating the risk factor of public disease of CHD. Some cross sectional present in the study which is not allow to calculate the accuracy of heart disease risk reclassification. So, in addition they need a improvements in accuracy of CHD risk score.
Daisy JA Janssen, Emiel FM Wouter et al [2] They have the necessary knowledge to optimize attention for the heart disease patients with Chronic Obstructive Pulmonary Disease, Congestive Heart Failure, Chronic Renal Failure. Which growth the details about the patients Symptoms, care needs and describe the possible strength, weakness and clinical consequences is outlined.
Shou-En Lu, Gloria L Beckles, Jesse C Crosson et al [3] Evoluting the heart disease risk equation which is commonly used for pretend the short-term risk level of CHD events frequently used in clinical decision making. The method will be finding the highlight of new refined CHD risk level equation to reason the CHD event risk score.
S. Paredes, T. Rochaa, P. de Carvalho [5] Using the Naive Bayes technique they were experimenting the predictive model for the heart disease. Which is achieved high results comparing with other classifier.
Swati Shilaskar, Ashok Ghatol [6] Using four different type of feature selection method and achieved high accuracy in forward selection algorithm.
Raghunath Nambiar, and AdhiraajSethi et al [7] evaluated the DT techniques such as CART (Classification and Regression Tree), ID3 (Iterative Dichotomized 3) and Decision Table (DT). Different classifiers and research are conduit to find the good classifier for calculating the heart disease Diagnosis for the patients. Among the entire algorithm CART gives more accuracy.
Monika Gandhi, Shailendra Narayan Singh [8] They explaining about the prediction of patients heart disease using the Neural Network, DT or Naive Bayes and their advantages and disadvantage of the methods.
Theresa Princy. R, J. Thomas [9] The author is using K- Nearest Neighbour and ID3 algorithm for analysing the risk factor level for the heart disease. Detecting the accuracy value level for both the algorithm.
P. Sudeshna, S.Bhanumathi et al [10] SVM, DT and Sequential Minimal Optimization are using in this paper which predicts the disease and its probability getting attacks and calculated based there data sets.
III.
METHODSID3 algorithm model was developed by Ross Quinlan in the year 1970’s. This method is evolved into a classification tree model in the year 1980’s and these model is named as C4.5 algorithm. But Quinlan
published less part of this model, because he was continually working on evolving the classification tree method and rule based models into latest incarnation called C5.0 algorithm.
A. C5.0 algorithm
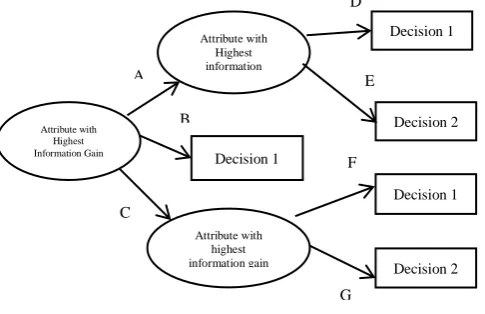
C5.0 is a next part of the C4.5 algorithm. Which is very similar to the C4.5 algorithm [11]. Algorithm C5.0 is used as proposed method in this paper and model will be build either in DT or Rule set based. Figure 2 will explain the model works under the splitting the sample by using condition which provides a maximum information gain. Each sample will be mentioned by root sample and then sample can be divided again until the leaf node or final sample will be getting. Finally, low level values splits are reexamined and unwanted splits will be removed or pruned and the Categorical target which can predicted only by the C5.0 node. In C5.0 algorithm will always like to group the node together with categories of versions, when they analyzing the data with categorical fields.
C5.0 can produce two kinds of models. One is A DT is a DTs which extract the data in the method of human-logical tree- rules. The algorithm DT is fit for several classification problems that can be support to clarify the logic of the model using human-understandable “If.... Then...” rules. It is used in different areas like medical, surveillance fraud detection, marketing, scientific discovery and so on.
related with that set of rule, and the final get prediction is definite by combining the weighted votes of all the set of rules that use to the record in question. If no rule using, a default prediction is allotted to the record. Rule can be produced only from the trees with categorical target fields.
B. Rule–Based Models
The DT which generated by if-then condition it will have a unique way of routing the one terminal node for any other sample set. A rule is fully based on set of it-then statements which will be collapse into a independent condition.
For the example:
if num > = 50 then Class = 1 if num < = 50 then Class = 0
Both C4.5 and C5.0 algorithm are having a choose to change the tree to rules.
Figure 2. Information Gain
C5.0 algorithm was created by Quinlan for (Unix/ Linux and Windows). It has more number of improvements than C4.5 algorithm
C5.0 algorithm is significantly faster than C4.5 algorithm.
Memory usage of C5.0 algorithm is larger than C4.5.
C5.0 algorithm also get the same output as C4.5 algorithm but it will considerably getting small DT. C5.0 algorithm is called weighting.
Algorithm: C5.0 tree, is represent as a class variable.
node = DTNode(ex)
# target attributes will deal with their arbitrary labels dictionaryAtt = summarizeEx(ex, targetAttribute) for key in dictionary:
if dictionaryAtt[key] == total no. of ex node.label1 = key
return node
# testing for the no. of ex to be avoid overfitting if attri is null or no. of ex < min allow single branch: node.label1 = most ordinary value in ex
return node
gbestA = attri with the highest information gain node.DT = gbestA
for single possible value ( v ) of gbestA:
C. Boosting technology
Boosting technology is the topmost improvement in C5.0 algorithm compare to the C4.5 algorithm [11]. It works based on setting weight for each sample. The sample which have higher weight will be have more influence in the DT. At the initial stage every set of sample will have same weight. At each stage a new DT will be constructed. Every set of sample weight will be adjusted, So that the user can focus on miss classified sample set in the DT will be constructed at last trial, which means these samples is having higher weight.Consider as a given samples set (S) correspond to n samples and a acquisition system that build DT from a sample of training sets . Boosting build more DT from the set of a samples. The T is the no. of DT
adjusts weight. We also define indicator function: 1, sample i is wrongly classified
t
)
(i 0, sample i is rightly classified
The independent steps for boosting technology are explained in following steps:
[1] First Determine the variables: fix a value to the no. of T(commonly is 10). set t=1,
1i1/n. according to the error rate, that is
t
ti sample is classified rightly
[8] Finally If t=T, the trails are trails are terminated. Else, set t=T+1and go to step 2 to begin the next trail. Finally, we obtain the boosted tree
C
* This means when classify a testing sample using DT model, first, we classify a this sample byC
t(1tT), and we can get T results. Then we count the final vote of each class according to the weight of Ct(1tT) and select the class, which has the highest
vote as the final result.
By using the Boosting one of the C5.0 algorithm technology and we are showing that the accuracy between the C5.0 algorithm, classification algorithm and one DT algorithm and getting higher accuracy algorithms. A prediction result of classification algorithm is taken as the input for confusion matrix to find the accuracy.
A. Confusion Matrix
Classification algorithm will be using the confusion matrix for the measure of accuracy in the predictive analytic part.
For example,
FP is represented as false positives: Examples which are predicted as the positive will be actually negative
TN is represented as true negatives: Examples which are predicted as the negative will be actually negative
FN is represented as false negatives: Examples which are predicted as the negative will be actually positive
Confusion Matrix if the positive class is taken
a b <-- classified as
actual a=0 TP FP
actual b=1 FP TN (1)
Confusion Matrix if the negative class is taken
a b <-- classified as
actual a=0 TN FP
actual b=1 FN TP (2)
Equation (1) and (2) discuss about the Confusion Matrix. It is usually named as eventuality table. In
the given matrix the more number of values are appropriately classified requests is the amount of the appropriately classified diagonals then all others are incorrectly classified (exactly twice if the class "a" gets into misclassified as "b", and exactly thrice if the class "b" gets into misclassified as "a").
B. Performance Evaluation
For calculate the measure of the operation of each single combination of the sensitivity, specificity and accuracy were calculated. To calculate the order of execution part of the data is separate into two part one is training and another one testing data with the cross validation.
Sensitivity = TP/ Positive
Specificity = TN/ Negative
Accuracy= (TP+ TN)/ (TP +TN)
TABLE I
S.No I.Heart Disease Data Set
Variable Name Variable description Categories values
1 age Patient age -
2 sex Representing the person
is Male or Female
1 represent as Male and 0 represent as Female
3 cp Represent as Chest pain level-2 heading,
level-3 heading, author affiliation
4 restbps Represent as Resting
blood pressure
3 levels(represent as mm Hg)
5 chol Represent as Serum
cholesterol
Represent as mg/dl
6 fbs Represent as Fasting
blood sugar
While Fasting the blood sugar is > 120 mg/dl: then 1 is represent as true or else 0 = false
7 restecg Represent as Resting
electroc If 0 its represent as normal,
If represent 1 its having ST-T wave abnormality and finally it
Estes’criteria
8 thalach Represent as Maximum
heart rate achieved from the pateint
-
9 exang Represent as Exercise
induced angina 2 levels
If it is 1 it represent as yes
Else it represent as no for 0.
10 oldpeak Represent as ST
depression induc. ex.
-
11 slope Represent as slope of
peak exercise ST
3levels If it is 1 it represent as up sloping, If it is 2 it represent as flat and if it is 3 it down sloping
12 ca Represent as number of
major vessel 4levels
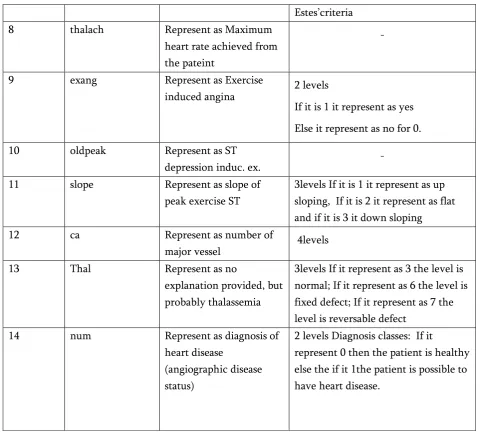
13 Thal Represent as no
explanation provided, but probably thalassemia
3levels If it represent as 3 the level is normal; If it represent as 6 the level is fixed defect; If it represent as 7 the level is reversable defect
14 num Represent as diagnosis of
heart disease
(angiographic disease status)
2 levels Diagnosis classes: If it
represent 0 then the patient is healthy else the if it 1the patient is possible to have heart disease.
Table 1 represent the UCI Heart Disease DataSet which is used for predicting the Heart Disease of the patients."https://archive.ics.uci.edu/ml/machinelearni ngdatabases/heartdisease/processed.cleveland.data".T he num is the variable which we want to predict with if the Value is represented as 0 < 50% then it diameter narrowing and if the Value is represented as 1 > 50% then it diameter narrowing. We are assuming as that all value in the class attribute with 0 means heart it will represent as perfect, and 1,2,3,4 means heart disease is conformed. From the possible values the variables can take, it is evident that the following need to be dummi fied because the distances in the values is random: cp,thal, restecg, slope.
TABLE III
Algorithms II. Performance Measures
Comparison between the Algorithms
Accurac y (%)
Sensitivit y (%)
Specificit y (%)
C5.0 80.9 81.25 80.49
Naive Bayes 79.78 81.25 78.05
Neural Network
79.47 73.61 95.68
CART 77.53 81.25 73.17
we getting the C5.0 algorithm has a high accuracy 80.9%.
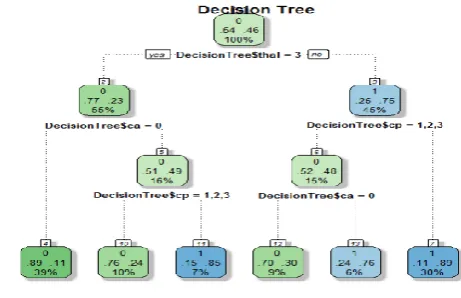
Figure 3. DT for the given Data Set
Figure 3 represent the C5.0 DT for the given UCI Data Set as we have above mentioned in method we using 14 attributes like (age,sex,cp, trestbps, chol, fbs, restecg, thalach, exang, oldpeak, slope, thal, ca, num). Calculating the attributes for the information gain checking for the higher information gain values of the attributes. Here thal attribute which is getting higher information gain value. Thal which has a 3 levels in the attributes and splitting the tree as yes and no with 54 as yes and 46 as no higher than all other attributes. And again the information values in between the other attributes and split into different part of the trees. Finally we will repeat the method until the leaf node is getting for every attribute present in the DT.
V.
CONCLUSION
In this paper we have analyzing two classification algorithm (Naive Bayes, Neural Network) and one CART DT algorithm with the one of the C5.0 DT algorithm that are very useful in DM for detecting the heart disease prediction. From the other classification method have analyzing all the types of heart disease diagnosis. We have also classified some techniques that are useful in DM for detecting heart disease. It has proven that the C5.0 algorithm is providing the high Accuracy, Sensitivity, Specificity
value will compare to the other classification and CART DT algorithm.
VI.
REFERENCES
[1].
Ding K, Bailey KR, Kullo IJ. Genotype-informed estimation of risk of coronary heart disease based on genome-wide association data linked to the electronic medical record. BMC cardiovascular disorders. 2011 Dec;11(1):66.[2].
Janssen DJ, Wouters EF, Schols JM, Spruit MA. Self-perceived symptoms and care needs of patients with severe to very severe chronic obstructive pulmonary disease, congestive heart failure or chronic renal failure and its consequences for their closest relatives: the research protocol. BMC Palliative Care. 2008 Dec;7(1):5.[3].
Lu SE, Beckles GL, Crosson JC, Bilik D, Karter AJ, Gerzoff RB, Lin Y, Ross SV, McEwen LN, Waitzfelder BE, Marrero D. Evaluation of risk equations for prediction of short-term coronary heart disease events in patients with long-standing type 2 diabetes: the Translating Research into Action for Diabetes (TRIAD) study. BMC endocrine disorders. 2012 Dec;12(1):12.[4].
Eom JH, Kim SC, Zhang BT. AptaCDSS-E: A classifier ensemble-based clinical decision support system for cardiovascular disease level prediction. Expert Systems with Applications. 2008 May 1;34(4):2465-79.[5].
Paredes S, Rocha T, De Carvalho P, Henriques J, Harris M, Morais J. Long term cardiovascular risk models’ combination. Computer methods and programs in biomedicine. 2011 Mar 1;101(3):231-42.[6].
Shilaskar S, Ghatol A. Feature selection formedical diagnosis: Evaluation for
cardiovascular diseases. Expert Systems with Applications. 2013 Aug 1;40(10):4146-53.
IEEE International Conference on 2013 Oct 6 (pp. 17-22). IEEE.