Comparing Computer Vision Analysis of Signed
Language Video with Motion Capture Recordings
Matti Karppa
∗, Tommi Jantunen
†, Ville Viitaniemi
∗, Jorma Laaksonen
∗,
Birgitta Burger
‡, Danny De Weerdt
†∗Department of Information and Computer Science,
Aalto University School of Science, Espoo, Finland, [email protected]
†Sign Language Centre, Department of Languages,
University of Jyv¨askyl¨a, Finland, [email protected], [email protected]
‡Department of Music, Finnish Centre of Excellence in Interdisciplinary Music Research,
University of Jyv¨askyl¨a, Finland [email protected]
Abstract
We consider a non-intrusive computer-vision method for measuring the motion of a person performing natural signing in video recordings. The quality and usefulness of the method is compared to a traditional marker-based motion capture set-up. The accuracy of descriptors extracted from video footage is assessed qualitatively in the context of sign language analysis by examining if the shape of the curves produced by the different means resemble one another in sequences where the shape could be a source of valuable linguistic information. Then, quantitative comparison is performed first by correlating the computer-vision-based descriptors with the variables gathered with the motion capture equipment. Finally, multivariate linear and non-linar regression methods are applied for predicting the motion capture variables based on combinations of computer vision descriptors. The results show that even the simple computer vision method evaluated in this paper can produce promisingly good results for assisting researchers working on sign language analysis.
Keywords:Sign language, Motion capture, Computer vision, Multivariate regression analysis
1.
Introduction
When analysing sign language videos, linguists routinely segment the stream of signing into signs and inter-sign tran-sitions (for a discussion, see (Jantunen, 2013)). The seg-mentation has been traditionally done by observing, from the video, the visible changes in the direction of the move-ment of the signer’s active hand, corresponding to the mo-ments when the speed of the hand is at its slowest. Recently, many researchers have started to enhance the segmentation process with quantitative measurement concerning the hand movement (e.g. (Duarte and Gibet, 2010; Jantunen, 2013)). For this task, the most accurate method has always been considered to be motion capturing.
However, because motion capture cannot be used for pre-recorded material and is always tied to laboratory set-tings, we have in our previous work introduced a computer-vision-based method that enables researchers to track and measure the motion of the hand and other articulators on the basis of the video only (Jantunen et al., 2010; Karppa et al., 2011). In this paper, we evaluate the accuracy of this method by comparing its results to the speed measurements obtained through motion capture. The comparison is based on one 52-second-long recording of continuous signing in Finnish Sign Language, collected with the motion capture equipment. During recording of that data, the movements of the signer were also recorded with a digital video camera directly facing him, and our computer-vision-based motion analysis has been applied to this video.
After calculating a number of features describing the mo-tion of the articulators in the video material, these val-ues were qualitatively compared with their motion cap-ture counterparts. Finally, a quantitative analysis was per-formed by calculating correlations between the motion cap-ture measurements and the video-based motion values and their multivariate regression combinations. The results show an encouragingly good agreement between the mo-tion capture and video-based data.
2.
Methods for analysing sign language
material
2.1. Motion capture recordings
The motion capture data used in the experiment was recorded with an eight-camera optical motion capture sys-tem (ProReflex MCU120) at a frame rate of 120 Hz by tracking the three-dimensional positions of 20 small ball-shaped markers attached to the signer’s upper torso, head, and each arm and hand as illustrated in Figure 1f. How-ever, in the present study, only the data derived from the ulnar and radial wrist markers and the index finger marker of the active hand were used in the analysis.
(a) (b) (c)
(d) (e) (f)
Figure 1: (a)–(e) Processing stages in the video analysis: (a) face detection, (b) detection of skin-coloured regions, (c) skin blob detection, (d) fitting of ASM active shape models, (e) KLT interest point tracking. (f) The skeleton model used with the motion capture equipment.
(i.e., the magnitude or Euclidean norm of the velocity data) of the wrist segment. In the present study, the results of the computer-vision-based method were compared to this mag-nitude data, as well as to the speed of the right index finger marker.
2.2. Computer-vision-based analysis
Figure 1 illustrates the main processing stages of our computer-vision-based method that was used for extract-ing motion descriptors from the video in the present study. The signer’s face was first detected (Figure 1a) by using the Viola-Jones cascade face detector (Viola and Jones, 2001). As the next step, skin-coloured regions were located by using a detector based on multiple multivariate Gaussian distributions in the HSV colour space (Figure 1b). From the skin detector output, interconnected skin pixel regions were extracted using elementary image processing opera-tions. Heuristic rules were used for determining whether the regions corresponded to either of the hands or the face region of the signer, or their combinations (Figure 1c). The computer-vision-based analysis extracts two comple-mentary sets of motion descriptors from the video. Firstly, a separate point distribution model (PDM) (Cootes et al., 1992) was constructed for describing each of the three mod-elled body parts (both of the hands and the head). The point distribution models were used as a basis for active shape models (ASM) (Cootes et al., 1995) that track the body part poses and shapes between consecutive frames of video (Figure 1d), giving arise to a set of 18 descriptors for each frame.
As another motion analysis method, local motions in the
detected skin regions were estimated by detecting distinc-tive corner points (Figure 1e) and tracking them with the Kanade-Lucas-Tomasi (KLT) algorithm (Shi and Tomasi, 1994) . For each frame of the video, the movements of the tracked points were summarised with 35 descriptors.
3.
Comparison of video analysis results and
motion capture recordings
3.1. Qualitative observations
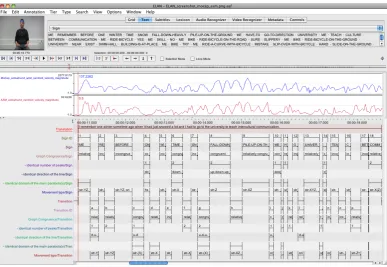
The first step in comparing the velocity estimates produced by the two methods was qualitative inspection of the corre-spondence between the wrist velocity magnitude derived by motion capture and one of the statistics extracted by com-puter analysis: the active hand ASM velocity magnitude. For this purpose, velocity graphs describing both of them were imported into ELAN annotation software1. In ELAN,
the graphs were time-aligned with the video of the sign-ing and manually created annotation cells correspondsign-ing to signs and transitions.
The actual comparison was done by visually observing the degree of congruence of the line graphs during the first eight seconds of the signing, corresponding to the first full sentence of the story as seen in Figure 2. Three features were observed from the graphs for both signs (n=18) and transitions (n=17): the number of peaks, the direction of the line, and the domain of the main parabola(s) of the line. The two lines were treated congruentif all three features were identical,relatively congruent if one or two features
1
Figure 2: ELAN screenshot of the first eight seconds of the video used in the qualitative analysis. The curves show the wrist marker speed W|v|and the ASM centroid speed ASM|v|.
were identical, andincongruentif none of the features were identical.
The main results of the qualitative analysis are given in Ta-ble 1. The results show that, of the total of 35 analysed sequences, two thirds fell into categoriescongruentand rel-atively congruent, and one third was classified as incongru-ent. Reflecting perhaps the qualitative difference between signs and transitions (Jantunen, 2013), the graphs associ-ated with signs included more cases of pure congruence and incongruence whereas graphs associated with transi-tions showed mostly relative congruence. However, for both signs and transitions, incongruent cases were in mi-nority, and the most congruent feature in the graphs was the one describing the overall shape of the main parabola(s).
A more detailed analysis of the data revealed that move-ments along the depth dimension were the primary cause of incongruence in the results; all the incongruent cases— both signs and transitions—included this type of move-ment whereas in the most congruent cases such movemove-ments were not noticeably present (see Figure 2). This was ex-pected (Jantunen et al., 2010; Karppa et al., 2011) as the computer-vision-based method operates in the 2D space lacking the dimension of depth, inherently present in the 3D motion capture.
signs transitions
congruent 5 3
relatively congruent 5 11
incongruent 8 3
Table 1: Graph congruence for signs and transitions.
3.2. Quantitative analysis
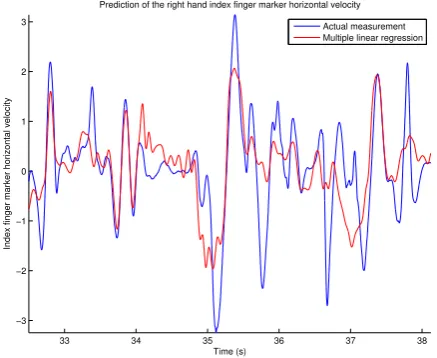
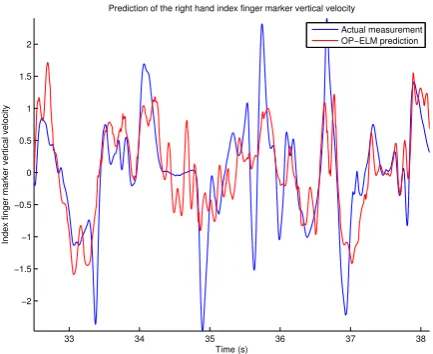
In the quantitative part of the analysis, we first calcu-lated the numerical correlation between the wrist marker speed W|v|and the active hand active shape model veloc-ity ASM|v|, the same quantities that were already studied in the qualitative analysis. Then, we extended the analy-sis to contain all the 53 video-based descriptors, including the horizontal and vertical interest point speed descriptors KLTPv
xand KLTPvy, respectively. From the motion capture measurements we additionally used the active hand index finger marker velocity components Fvxand Fvy. We studied exhaustively the agreement between all pairs of the above-mentioned motion capture measurements and video-based descriptors alone, and also formed multivariate regressors from the descriptors for predicting the values of the motion capture measurements. The level of agreement was measured with energy-normalised correlation and used for assessing the usefulness of the descriptors. To achieve this, all motion capture measurements and predictions were z-normalised by subtracting their average values and nor-malising their variance to unity. As the multivariate regres-sion methods require training samples, the data was divided into training and test parts and the correlations were mea-sured only in the latter half.
3.3. Correlations between individual variables
Here, each computer-vision-based descriptor was corre-lated individually against every motion capture variable. A selection of most relevant correlation coefficients is pre-sented in Table 2.