Testing APSyn against Vector Cosine on
Similarity Estimation
Enrico Santus
[1], Emmanuele Chersoni
[2], Alessandro Lenci
[3], Chu-Ren Huang
[1], Philippe Blache
[2][1] The Hong Kong Polytechnic University, Hong Kong
[2] Aix-Marseille University
[3] University of Pisa
{
esantus, emmanuelechersoni
}
@gmail.com
alessandro.lenci@unipi.it
churen.huang@polyu.edu.hk
blache@lpl-aix.fr
Abstract
In Distributional Semantic Models (DSMs), Vector Cosine is widely used to estimate sim-ilarity between word vectors, although this measure was noticed to suffer from several shortcomings. The recent literature has pro-posed other methods which attempt to miti-gate such biases. In this paper, we intend to in-vestigate APSyn, a measure that computes the extent of the intersection between the most as-sociated contexts of two target words, weight-ing it by context relevance. We evaluated this metric in a similarity estimation task on sev-eral popular test sets, and our results show that APSyn is in fact highly competitive, even with respect to the results reported in the literature for word embeddings. On top of it, APSyn addresses some of the weaknesses of Vector Cosine, performing well also on genuine sim-ilarity estimation.
1
Introduction
Word similarity is one of the most important and most studied problems in Natural Language Pro-cessing (NLP), as it is fundamental for a wide range of tasks, such as Word Sense Disambigua-tion (WSD), Information Extraction (IE), Para-phrase Generation (PG), as well as the automatic creation of semantic resources. Most of the cur-rent approaches to word similarity estimation rely on some version of the Distributional Hypothesis (DH), which claims that words occurring in the same contexts tend to have similar meanings (Har-ris, 1954; Firth, 1957; Sahlgren, 2008). Such hy-pothesis provides the theoretical ground for
Distri-butional Semantic Models (DSMs), which represent word meaning by means of high-dimensional vec-tors encoding corpus-extracted co-occurrences be-tween targets and their linguistic contexts (Turney and Pantel, 2010).
Traditional DSMs initialize vectors with co-occurrence frequencies. Statistical measures, such as Positive Pointwise Mutual Information (PPMI) or its variants (Church and Hanks, 1990; Bulli-naria and Levy, 2012; Levy et al., 2015), have been adopted to normalize these values. Also, these mod-els have exploited the power of dimensionality re-duction techniques, such as Singular Value Decom-position (SVD; Landauer and Dumais, 1997) and Random Indexing (Sahlgren, 2005).
still by far the most popular one (Turney and Pan-tel, 2010). However, in a recent paper of Santus et al. (2016b), the authors have claimed that Vector Cosine is outperformed by APSyn (Average Preci-sion for Synonymy), a metric based on the extent of the intersection between the most salient con-texts of two target words. The measure, tested on a window-based DSM, outperformed Vector Cosine on the ESL and on the TOEFL datasets.
In the present work, we perform a systematic eval-uation of APSyn, testing it on the most popular test sets for similarity estimation - namely WordSim-353 (Finkelstein et al., 2001), MEN (Bruni et al., 2014) and SimLex-999 (Hill et al., 2015). For comparison, Vector Cosine is also calculated on several count-based DSMs. We implement a total of twenty-eight models with different parameters settings, each of which differs according to corpus size, context win-dow width, weighting scheme and SVD application. The new metric is shown to outperform Vector Co-sine in most settings, except when the latter metric is applied on a PPMI-SVD reduced matrix (Bullinaria and Levy, 2012), against which APSyn still obtains competitive performances. The results are also dis-cussed in relation to the state-of-the-art DSMs, as reported in Hill et al. (2015). In such comparison, the best settings of our models outperform the word embeddings in almost all datasets. A pilot study was also carried out to investigate whether APSyn is scalable. Results prove its high performance also when calculated on large corpora, such as those used by Baroni et al. (2014).
On top of the performance, APSyn seems not to be subject to some of the biases that affect Vector Co-sine. Finally, considering the debate about the abil-ity of DSMs to calculate genuine similarabil-ity as op-posed to word relatedness (Turney, 2001; Agirre et al., 2009; Hill et al., 2015), we test the ability of the models to quantify genuine semantic similarity.
Count-based DSMs are built in an unsupervised way. Starting from large preprocessed corpora, a matrixM(m×n)is built, in which each row is a vec-tor representing a target word in a vocabulary of size m, and each column is one of thenpotential contexts (Turney and Pantel, 2010; Levy et al., 2015). The vector dimensions are counters recording how many times the contexts co-occur with the target words. Since raw frequency is highly skewed, most DSMs have adopted more sophisticated association mea-sures, such as Positive PMI (PPMI; Church and Hanks, 1990; Bullinaria and Levy, 2012; Levy et al., 2015) and Local Mutual Information (LMI; Evert, 2005). PPMI compares the observed joint probabil-ity of co-occurrence ofwandcwith their probability of co-occurrence assuming statistical indipendence. It is defined as:
P P MI(w, c) =max(P MI(w, c),0) (1)
P MI(w, c) =log
P(w, c) P(w)P(c)
=log
|w, c|D
|w||c|
MEN (Bruni et al., 2014), SimLex-999 (Hill et al., 2015). These datasets have a different history, but all of them consist in word pairs with an associ-ated score, that should either represent word asso-ciation or word similarity. WordSim-353 (Finkel-stein et al., 2001) was proposed as a word similarity dataset containing 353 pairs annotated with scores between 0 and 10. However, Hill et al. (2015) claimed that the instructions to the annotators were ambiguous with respect to similarity and associa-tion, so that the subjects assigned high similarity scores to entities that are only related by virtue of frequent association (e.g.coffeeandcup;movieand theater). On top of it, WordSim-353 does not pro-vide the POS-tags for the 439 words that it contains, forcing the users to decide which POS to assign to the ambiguous words (e.g. [white,rabbit] and [run, marathon]). An extension of this dataset resulted from the subclassification carried out by Agirre et al. (2009), which discriminated between similar and as-sociated word pairs. Such discrimination was done by asking annotators to classify all pairs according to the semantic relation they hold (i.e. identical, synonymy, antonymy, hypernymy, meronymy and none-of-the-above). The annotation was then used to group the pairs in three categories: similar pairs (those classified as identical, synonyms, antonyms and hypernyms), associated pairs (those classified as meronyms and none-of-the-above, with an aver-age similarity greater than 5), and non-associated pairs (those classified as none-of-the-above, with an average similarity below or equal to 5). Two gold standard were finally produced: i) one for similarity, containing 203 word pairs resulting from the union of similar and non-associated pairs; ii) one for relat-edness, containing 252 word pairs resulting from the union of associated and non-associated pairs. Even though such a classification made a clear distinc-tion between the two types of reladistinc-tions (i.e. simi-larity and association), Hill et al. (2015) argue that these gold standards still carry the scores they had in WordSim-353, which are known to be ambiguous in this regard.
The MEN Test Collection (Bruni et al., 2014)
ining subjects to rate which pair among two of them -was the more related one (i.e. the most associated). Every pairs-couple was proposed only once, and a final score out of 50 was attributed to each pair, ac-cording to how many times it was rated as the most related. According to Hill et al. (2015), the major weakness of this dataset is that it does not encode word similarity, but a more general notion of associ-ation.
SimLex-999 is the dataset introduced by Hill et al. (2015) to address the above mentioned criticisms of confusion between similarity and association. The dataset consists of 999 pairs containing 1,028 words, which were also evaluated in terms of POS-tags and concreteness. The pairs were annotated with a score between 0 and 10, and the instructions were strictly requiring the identification of word similarity, rather than word association. Hill et al. (2015) claim that differently from other datasets, SimLex-999 inter-annotator agreement has not been surpassed by any automatic approach.
2.4 State of the Art Vector Space Models
In order to compare our results with state-of-the-art DSMs, we report the scores for the Vector Cosines calculated on the neural language models (NLM) by Hill et al. (2015), who used the code (or directly the embeddings) shared by the original authors. As we trained our models on almost the same corpora used by Hill and colleagues, the results are perfectly com-parable.
Dataset SimLex-999 WordSim-353 MEN
Window 2 3 2 3 2 3
Cos Freq 0.149 0.133 0.172 0.148 0.089 0.096 Cos LMI 0.248 0.259 0.321 0.32 0.336 0.364 Cos PPMI 0.284 0.267 0.41 0.407 0.424 0.433 Cos SVD-Freq300 0.128 0.127 0.169 0.172 0.076 0.084 Cos SVD-LMI300 0.19 0.21 0.299 0.29 0.275 0.286
Cos SVD-PPMI300 0.386 0.382 0.485 0.47 0.509 0.538
APSynLMI-1000 0.18 0.163 0.254 0.237 0.205 0.196 APSynLMI-500 0.199 0.164 0.283 0.265 0.226 0.214 APSynLMI-100 0.206 0.182 0.304 0.265 0.23 0.209 APSynPPMI-1000 0.254 0.304 0.399 0.453 0.369 0.415
APSynPPMI-500 0.295 0.32 0.455 0.468 0.423 0.478
APSynPPMI-100 0.332 0.328 0.425 0.422 0.481 0.513 State of the Art
Mikolov et al. 0.282 0.442 0.433
Table 1: Spearman correlation scores for our eight models trained on RCV Vol. 1, in the three datasets Simlex-999, WordSim-353 and MEN. In the bottom the performance of the state-of-the-art model of Mikolov et al. (2013), as reported in Hill et al. (2015).
3
Experiments
In this section, we describe our experiments, starting from the training corpora (Section 3.1), to move to the implementation of twenty-eight DSMs (Section 3.2), following with the application and evaluation of the measures (Section 3.3), up to the performance analysis (Section 3.4) and the scalability test (Sec-tion 3.5).
3.1 Corpora and Preprocessing
We used two different corpora for our experiments: RCV vol. 1 (Lewis et al., 2004) and the Wikipedia corpus (Baroni et al., 2009), respectively containing 150 and 820 million words. The RCV Vol. 1 and Wikipedia were automatically tagged, respectively, with the POS tagger described in Dell’Orletta (2009) and with the TreeTagger (Schmid, 1994).
3.2 DSMs
For our experiments, we implemented twenty-eight DSMs, but for reasons of space only sixteen of them are reported in the tables. All of them include the pos-tagged target words used in the three datasets (i.e. MEN, WordSim-353 and SimLex-999) and the pos-tagged contexts having frequency above 100 in the two corpora. We considered as contexts the
content words (i.e. nouns, verbs and adjectives) within a window of 2, 3 and 5, even though the latter was given up for its poor performances. As for SVD factorization, we found out that the best results were always achieved when the number of latent dimensions was between 300 and 500. We report here only the scores fork= 300, since 300 is one of the most common choices for the dimension-ality of SVD-reduced spaces and it is always close to be an optimal value for the parameter.
Fourteen out of twenty-eight models were devel-oped for RCV1, while the others were develdevel-oped for Wikipedia. For each corpus, the models differed according to the window size (i.e. 2 and 3), to the statistical association measure used as a weighting scheme (i.e. none, PPMI and LMI) and to the application of SVD to the previous combinations.
3.3 Measuring Word Similarity and Relatedness
Given the twenty-eight DSMs, for each dataset we have measured the Vector Cosine and APSyn be-tween the words in the test pairs.
Cos PPMI 0.395 0.364 0.605 0.622 0.733 0.74 Cos SVD-Freq300 0.157 0.184 0.159 0.172 0.197 0.226 Cos SVD-LMI300 0.327 0.329 0.368 0.408 0.524 0.563
Cos SVD-PPMI300 0.477 0.464 0.533 0.562 0.769 0.779
APSynLMI-1000 0.343 0.344 0.449 0.477 0.586 0.597 APSynLMI-500 0.339 0.342 0.438 0.47 0.58 0.588 APSynLMI-100 0.303 0.31 0.392 0.428 0.48 0.498 APSynPPMI-1000 0.434 0.419 0.599 0.643 0.749 0.772
APSynPPMI-500 0.442 0.423 0.602 0.653 0.757 0.773
APSynPPMI-100 0.316 0.281 0.58 0.608 0.703 0.722
State of the Art
Huang et al. 0.098 0.3 0.433
Collobert & Weston 0.268 0.494 0.575 Mikolov et al. 0.414 0.655 0.699
Table 2: Spearman correlation scores for our eight models trained on Wikipedia, in the three datasets Simlex-999, WordSim-353 and MEN. In the bottom the performance of the state-of-the-art models of Collobert and Weston (2008), Huang et al. (2012), Mikolov et al. (2013), as reported in Hill et al. (2015).
The Spearman correlation between our scores and the gold standard was then computed for every model and it is reported in Table 1 and Table 2. In particular, Table 1 describes the performances on SimLex-999, WordSim-353 and MEN for the mea-sures applied on RCV Vol. 1 models. Table 2, in-stead, describes the performances of the measures on the three datasets for the Wikipedia models. Con-currently, Table 3 and Table 4 describe the perfor-mances of the measures respectively on the RCV Vol. 1 and Wikipedia models, tested on the subsets of WordSim-353 extracted by Agirre et al. (2009).
3.4 Performance Analysis
Table 1 shows the Spearman correlation scores for Vector Cosine and APSyn on the three datasets for the eight most representative DSMs built using RCV Vol. 1. Table 2 does the same for the DSMs built using Wikipedia. For the sake of comparison, we also report the results of the state-of-the-art DSMs mentioned in Hill et al. (2015) (see Section 2.5).
With a glance at the tables, it can be easily noticed that the measures perform particularly
well in two models: i) APSyn, when applied on the PPMI-weighted DSM (henceforth, AP-SynPPMI); ii) Vector Cosine, when applied on the SVD-reduced PPMI-weighted matrix (henceforth, CosSVDPPMI). These two models perform consis-tently and in a comparable way across the datasets, generally outperforming the state-of-the-art DSMs, with an exception for the Wikipedia-trained models in WordSim-353.
Some further observations are: i) corpus size strongly affects the results; ii) PPMI strongly out-performs LMI for both Vector Cosine and APSyn; iii) SVD boosts the Vector Cosine, especially when it is combined with PPMI; iv) N has some impact on the performance of APSyn, which generally achieves the best results forN=500. As a note about iii), the results of using SVD jointly with LMI spaces are less predictable than when combining it with PPMI.
Dataset WSim (SIM) WSim (REL)
Window 2 3 2 3
Cos Freq 0.208 0.158 0.167 0.175 Cos LMI 0.416 0.395 0.251 0.269 Cos PPMI 0.52 0.496 0.378 0.396 Cos SVD-Freq300 0.240 0.214 0.051 0.084 Cos SVD-LMI300 0.418 0.393 0.141 0.151
Cos SVD-PPMI300 0.550 0.522 0.325 0.323
APSynLMI-1000 0.32 0.29 0.259 0.241 APSynLMI-500 0.355 0.319 0.261 0.284 APSynLMI-100 0.388 0.335 0.233 0.27
APSynPPMI-1000 0.519 0.525 0.337 0.397 APSynPPMI-500 0.564 0.546 0.361 0.382 PMI APSynPPMI-100 0.562 0.553 0.287 0.309
Table 3: Spearman correlation scores for our eight models trained on RCV1, in the two subsets of WordSim-353.
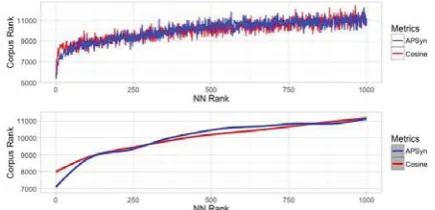
might depend on the different type of similarity encoded in SimLex-999 (i.e. genuine similarity). On top of it, despite Hill et al. (2015)’s claim that no evidence supports the hypothesis that smaller context windows improve the ability of models to capture similarity (Agirre et al., 2009; Kiela and Clark, 2014), we need to mention that window 5 was abandoned because of its low performance. With reference to the hubness effect, we have conducted a pilot study inspired to the one carried out by Schnabel et al. (2015), using the words of the SimLex-999 dataset as query words and collecting for each of them the top 1000 nearest neighbors. Given all the neighbors at rankr, we have checked their rank in the frequency list extracted from our corpora. Figure 1 shows the relation between the rank in the nearest neighbor list and the rank in the frequency list. It can be easily noticed that the highest ranked nearest neighbors tend to have higher rank also in the frequency list, supporting the idea that frequent words are more likely to be nearest neighbors. APSyn does not seem to be able to overcome such bias, which seems to be in fact an inherent property of the DSMs (Radovanovic et al., 2010). Further investigation is needed to see whether variations of APSyn can tackle this problem.
Figure 1: Rank in the corpus-derived frequency list for the top 1000 nearest neighbors of the terms in SimLex-999, computed with Cosine (red) and AP-Syn (blue). The smoothing chart in the bottom uses the Generalized Additive Model (GAM) from the mgcvpackage inR.
Finally, few words need to be spent with regard to the ability of calculating genuine similarity, as distinguished from word relatedness (Turney, 2001; Agirre et al., 2009; Hill et al., 2015). Table 3 and Table 4 show the Spearman correlation scores for the two measures calculated on the models respec-tively trained on RCV1 and Wikipedia, tested on the subsets of WordSim-353 extracted by Agirre et al. (2009). It can be easily noticed that our best models work better on the similarity subset. In par-ticular, APSynPPMI performs about 20-30% bet-ter for the similarity subset than for the relatedness one (see Table 3), as well as both APSynPPMI and CosSVDPPMI do in Wikipedia (see Table 4).
Cos PPMI 0.672 0.675 0.441 0.446 Cos SVD-Freq300 0.35 0.363 -0.013 0.001 Cos SVD-LMI300 0.604 0.626 0.222 0.286
Cos SVD-PPMI300 0.72 0.725 0.444 0.486
APSynLMI-1000 0.609 0.609 0.317 0.36 APSynLMI-500 0.599 0.601 0.289 0.344 APSynLMI-100 0.566 0.574 0.215 0.271 APSynPPMI-1000 0.692 0.726 0.507 0.568
APSynPPMI-500 0.699 0.742 0.508 0.571
APSynPPMI-100 0.66 0.692 0.482 0.516
Table 4: Spearman correlation results for our eight models trained on Wikipedia, in the subsets of WordSim-353.
3.5 Scalability
In order to evaluate the scalability of APSyn, we have performed a pilot test on WordSim-353 and MEN with the same corpus used by Baroni et al. (2014), which consists of about 2.8B words (i.e. about 3 times Wikipedia and almost 20 times RCV1). The best scores were obtained with APSyn, N=1000, on a 2-window PPMI-weighted DSM. In such setting, we obtain a Spearman correlation of 0.72 on WordSim and 0.77 on MEN. These results are much higher than those reported by Baroni et al. (2014) for the count-based models (i.e. 0.62 on WordSim and 0.72 on MEN) and slightly lower than those reported for the predicting ones (i.e. 0.75 on WordSim and 0.80 on MEN).
4
Conclusions
In this paper, we have presented the first systematic evaluation of APSyn, comparing it to Vector Co-sine in the task of word similarity identification. We developed twenty-eight count-based DSMs, each of which implementing different hyperparameters. PPMI emerged as the most efficient association mea-sure: it works particularly well with Vector Cosine, when combined with SVD, and it boosts APSyn. APSyn showed extremely promising results, despite its conceptual simplicity. It outperforms the Vector Cosine in almost all settings, except when the
Thomas K Landauer, Peter W Foltz, and Darrell Laham. 1998. An introduction to latent semantic analysis. Discourse processes, 25(2-3):259–284.
Omer Levy, Yoav Goldberg, and Ido Dagan. 2015. Im-proving distributional similarity with lessons learned from word embeddings. Transactions of the Associa-tion for ComputaAssocia-tional Linguistics, 3:211–225. David D Lewis, Yiming Yang, Tony G Rose, and Fan Li.
2004. Rcv1: A new benchmark collection for text cat-egorization research. The Journal of Machine Learn-ing Research, 5:361–397.
Baoli Li and Liping Han. 2013. Distance weighted cosine similarity measure for text classification.. In-telligent Data Engineering and Automated Learning -IDEAL 2013: 611-618.
Tomas Mikolov, Kai Chen, Greg Corrado, and Jeffrey Dean. 2013. Efficient estimation of word representa-tions in vector space.arXiv preprint arXiv:1301.3781. Milos Radovanovic, Alexandros Nanopoulos and Mir-jana Ivanovic. 2010. On the existence of obsti-nate results in vector space models. Proceedings of SIGIR:186-193.
Magnus Sahlgren. 2005. An introduction to random in-dexing. InMethods and applications of semantic in-dexing workshop at the 7th international conference on terminology and knowledge engineering, TKE, vol-ume 5.
Magnus Sahlgren. 2008. The distributional hypothesis. Italian Journal of Linguistics, 20(1):33–54.
Enrico Santus, Tin-Shing Chiu, Qin Lu, Alessandro Lenci, and Chu-ren Huang. 2016. Unsupervised Measure of Word Similarity: How to Outperform Co-Occurrence and Vector Cosine in VSMs. arXiv preprint arXiv:1603.09054.
Enrico Santus, Tin-Shing Chiu, Qin Lu, Alessandro Lenci, and Chu-ren Huang. 2016. What a Nerd! Beat-ing Students and Vector Cosine in the ESL and TOEFL Datasets. InProceedings of LREC.
Helmut Schmid. 1994. Probabilistic part-of-speech tag-ging using decision trees. InProceedings of the inter-national conference on new methods in language pro-cessing, volume 12, pages 44–49. Citeseer.
Tobias Schnabel, Igor Labutov, David Mimmo and Thorsten Joachims. 2015. Evaluation methods for unsupervised word embeddings. In Proceedings of EMNLP.
Edward Smith, Edward Shoben and Lance Rips. 1974. Structure and process in semantic memory: A featural model for semantic decisions. Psychological Review, 81(3).
linguistics, pages 384–394. Association for Computa-tional Linguistics.
Peter D Turney and Patrick Pantel. 2010. From fre-quency to meaning: Vector space models of semantics. Journal of artificial intelligence research, 37(1):141– 188.