Article
1
What do users really want? Participatory
2
development of decision support tools for
3
environmental management based on outcomes.
4
Richard J. Hewitt1, 2* and Kit (C.J.A.) Macleod1
5
1 Information and Computational Sciences Group, Craigiebuckler, Aberdeen AB15 8QH, Scotland UK;
6
richard.hewitt@hutton.ac.uk (RH); Kit.Macleod@hutton.ac.uk (KM)
7
2 Observatorio para una Cultura del Territorio; richard.hewitt@observatorioculturayterritorio.org
8
* Correspondence: richard.hewitt@hutton.ac.uk; Tel.: +44-1224-395436
9
10
11
Abstract: There is increasing demand from stakeholders for tools to support outcome-based
12
approaches in environmental management. For such tools to be useful, understanding user
13
requirements is key. In Scotland, UK, stakeholders were engaged in the development of an
14
Environmental Decision Support System (EDSS) to support the management of land and
15
freshwater resources for multiple policy outcomes. A structured participatory engagement process
16
was employed to determine stakeholder requirements, establish development principles to fulfil
17
these requirements and road-test prototypes. The EDSS specification that emerged from this
18
bottom-up process was spatially-explicit, free at the point of use, and touch and mobile device
19
compatible. This application, which is under development, does not closely resemble most existing
20
published EDSS. We suggest that there is a mismatch between the way scientists typically
21
conceptualise EDSS and the kinds of applications that are likely to be useful to decision-makers on
22
the ground. Interactive mobile and web-based geospatial information services have become
23
ubiquitous in our daily lives, but their importance is not reflected in current literature on EDSS. The
24
current focus in environmental management on adaptive, stakeholder-centred strategies based on
25
outcomes offers an opportunity to make better use of these new technologies to aid
26
decision-making processes.
27
Keywords: Environmental decision support systems; applications; outcome-based approach;
28
adaptive management; user requirements; environmental management; participatory land
29
planning
30
31
1. Introduction
32
Research in environmental science is often undertaken under the premise that scientific
33
information and knowledge is necessary to inform environmental policy and management. This has
34
led to the widespread development of computerized tools to bridge the divide between scientific
35
analysis of the state of the environment (e.g. water quality, biodiversity, land use change) and
36
environmental policy (e.g. European directives on freshwater quality and terrestrial biodiversity
37
conservation measures). These tools fall approximately into two types, though in practice there is a
38
great deal of overlap. Decision Support Systems (DSS) are typically targeted at supporting policy
39
implementation in a specific context, while Policy Support Systems or (PoSS) have broader aims,
40
including policy formulation and strategy [1]. In the context of environmental management, we
41
follow [2], and refer to both of these two types as Environmental Decision Support Systems (EDSS).
42
Preprints (www.preprints.org) | NOT PEER-REVIEWED | Posted: 6 October 2017 doi:10.20944/preprints201710.0032.v1
© 2017 by the author(s). Distributed under a Creative Commons CC BY license.
2 of 21 In theory, the relationship between science and policy is close and direct [3]. In practice, this is not
43
always the case, especially when science throws up wicked problems [4] to which policy makers or
44
environmental managers are unable to respond in conventional normative ways. Consensus is
45
beginning to emerge around the need for integrative, adaptive approaches to environmental
46
management as a means to tackle these kinds of intractable problems [5, 6]. Adaptive environmental
47
management seeks to integrate project design, management, and monitoring, to provide a
48
framework to systematically test assumptions, promote learning, and supply timely information for
49
management decisions (e.g. [7]). Involvement of stakeholders is essential to facilitate the processes of
50
generating and sharing knowledge to improve understanding of the effectiveness of management
51
actions. Policy makers and land managers require better access to the results of scientific analysis,
52
while scientific stakeholders need to better understand other stakeholders’ needs in order to
53
structure and focus their studies (e.g. [8]). Private sector stakeholders, like land-based businesses,
54
are increasingly interested in easy to use web-based dashboard ‘business intelligence’ tools to better
55
manage their holdings, creating new demands and opportunities to bridge the relationship between
56
policy and management, and the supply and provision of scientific analysis. A need is therefore
57
emerging for new software tools and applications to respond to these demands, bringing new ways
58
of working. Modellers can play a key role in structuring integrative projects to meet these needs
59
whilst overcoming technical, knowledge and team-related challenges [9].
60
In this paper, we discuss our recent progress in responding to the challenge of providing
61
web-based digital tools that meet user needs for their adaptive management of natural resources.
62
The paper is structured as follows. In the next section, we describe some of the most important
63
limitations of EDSS as currently conceived from an adaptive management perspective.
64
Subsequently, we show how we have tried to address these issues by engaging policy stakeholders,
65
regulators and resource managers to co-develop an environmental decision-support application for
66
understanding the effectiveness of environmental policy interventions in river catchments in
67
Scotland. We present the results of this process and finish with a general discussion summarizing
68
key points, lessons learnt. Finally we offer some brief recommendations for future development of
69
EDSS.
70
2. Background
71
The work presented here forms part of a long-term Scottish Government Strategic Research
72
Programme (SRP) project which aims to understand and improve the management of Scotland’s
73
land and freshwater resources for multiple policy and management outcomes. In Scotland, the Land
74
Use Strategy aims to take a more integrated approach to management of natural capital to deliver
75
multiple benefits [10]. Since 2007 Scottish Government policy objectives have been framed as a set of
76
national level outcomes to guide all policy, management and applied research [11]. This emphasis
77
on outcomes stems from the increasing interest across research, policy and management
78
communities to improve not only how we plan individual and multiple landscape management
79
actions, but also how we evaluate and learn from their successes and failures (see e.g. [12]). In
80
Scotland, as elsewhere in Europe, land managers are eligible for grants in return for implementing
81
environmental improvement measures under Pillar 2 of the Common Agricultural Policy (CAP). A
82
wide range of options are available relating to livestock, croplands and vegetation, among others
83
(see, e.g.
84
https://www.ruralpayments.org/publicsite/futures/topics/all-schemes/agri-environment-climate-sch
85
eme/management-options-and-capital-items/#32412). Choosing the most appropriate measure for a
86
given land holding is a complex problem involving multiple choices, actors and possible outcomes.
87
The application of computerized tools to these kinds of problems has a long history (see e.g. [13,
88
14, 15]). The use of computer modelling to facilitate adaptive environmental management was
89
advocated by [16]. Early DSS (see e.g. [17, 18]) were conceived as computerized tools to manage
90
operational decisions where either the decision formulation or the solution, or both, were arguable
91
Preprints (www.preprints.org) | NOT PEER-REVIEWED | Posted: 6 October 2017 doi:10.20944/preprints201710.0032.v1
3 of 21 or directly contested [2]. While the involvement of end-users is clearly a key aspect of such a system,
92
this does not necessarily imply the democratisation of knowledge and decision-making that lies at
93
the heart of stakeholder-centred approaches to environmental management, i.e. in participatory,
94
collaborative or mediated modelling (e.g. [19, 20, 21]). An EDSS designed under the conventional
95
paradigm of DSS is a tool to help the competent authorities solve environmental problems, but does
96
not necessarily emphasise sharing and co-construction of knowledge with stakeholders or social
97
learning (sensu [22]) as a strategy for managing disagreement resulting from the diverse perspectives
98
and requirements of multiple stakeholders. This means that frequently, such systems are not
99
targeted at stakeholder needs [23]. From an adaptive management point of view, in which it is often
100
desirable or even essential to share knowledge effectively amongst diverse stakeholder groups, this
101
is problematic. Recently, digital catchment observatories have been suggested as a means to improve
102
knowledge sharing and co-construction with stakeholders [24].
103
At the same time, many EDSS, ostensibly intended for non-scientific stakeholders to pick up
104
and apply to their specific problems or needs, do not end up being used for that purpose [25], [2].
105
While the reasons for the lack of uptake by intended end users are diverse [2], lack of stakeholder
106
involvement at the design stage is clearly a significant factor. [23], in their analysis of four EDSS in
107
landscape and catchment management contexts, concluded that “the appropriate and
108
methodological stakeholder interaction and the definition of ‘what end-users really need and want’
109
have been documented as general shortcomings of all four examples of DSS.” Understanding and
110
managing the diverse requirements a software application needs to meet – the requirements
111
problem - is recognised as a major challenge in software development generally [26]. Responding to
112
this challenge by improving the integration of the end user in the development process is a key
113
underlying motivation of the User-Centred Systems Design (UCSD) paradigm [27,28]. However,
114
while user-centred approaches have become mainstream in software development circles, they still
115
lack general application in an EDSS context.
116
Further, since publication of [2], the role of software in supporting decisions of various kinds in
117
everyday life has grown substantially. Mobile and web-based applications have become ubiquitous
118
in all kinds of contexts, e.g. purchasing or contracting goods and services, banking, navigation,
119
social networking etc. Typically these tools are web based, designed for mobile devices, built on Free
120
and Open Source Software (FOSS), and optimised for touch-based interactions. Yet EDSS for the
121
most part, remain some way behind the innovation curve. Most EDSS are still stand-alone systems,
122
many require expensive proprietary software and frequently are not optimised or not available, or
123
not optimised, for touch screens. In agriculture, a new generation of decision-support tools has
124
begun to emerge, in the form of Farm Management Information Systems [29, 20, 31], allowing farm
125
managers to adapt their operations to variables like temperature and precipitation, market prices or
126
policy measures. However, there remains a substantial mismatch between the computationally
127
intensive and conceptually challenging modelling approaches typically used by the scientific
128
community (e.g. [1. 32]), and the lightweight, web and mobile-based and touch-screen-friendly
129
applications for smart devices that we all use in our daily lives.
130
Finally, a key limitation of conventional EDSS from our point of view relates to the difficulty of
131
applying them in the context of outcomes-based approaches. The likely result, in terms of
132
environmental improvement or otherwise of a particular measure, should be a determining factor in
133
the choice of measure. This requires us to understand not only the potential spatial distribution of
134
particular environmental variables in the landscape, in order to suggest locations for management
135
measures and interventions, but also the causal logic that connects these measures to the desired
136
outcomes. Conventional EDSS approaches have emphasised the former, while approaches like logic
137
modelling (also known as results chain logic modelling) are frequently applied to the latter [33, 34].
138
Logic modelling, which has its origins in program theory [35] is widely used for planning and
139
evaluation of environmental and agricultural policy measures in the UK and elsewhere [36]. At
140
present, however, we are unaware of any EDSS software or framework that successfully integrates
141
Preprints (www.preprints.org) | NOT PEER-REVIEWED | Posted: 6 October 2017 doi:10.20944/preprints201710.0032.v1
4 of 21 the aspatial process-based approaches found in logic modelling software like Miradi with the
142
spatial, Geographical Information Systems (GIS)-type approach found in EDSS for rural planning at
143
the level of the management unit (e.g. [14].)
144
In the following paper, we argue that a reappraisal of the process of development of software for
145
EDSS is necessary in the light of the need for adaptive management and outcome–based approaches
146
to environmental decision-making and the wide range of new smart applications. To this end, we
147
address the following three key research questions (RQs):
148
1. How can we develop decision-support tools that align better with adaptive management and
149
outcome-based approaches to environmental management: what are the key requirements of such a
150
system?
151
2. How can we make better use of well-established mobile and touch-based devices and software
152
for supporting environmental decisions?
153
3. How can we involve key stakeholders like scientists, regulators and land managers to better
154
understand these requirements?
155
3. Methods
156
In order to respond to these three RQs, we conducted research and stakeholder engagement
157
activities in two phases where Phase 1 addressed RQ 1 and RQ2 and Phase 2 addressed RQ3. The
158
conceptual design of the process is shown in Figure 1.
159
160
161
162
Figure 1. Conceptual process design for stakeholder-driven development of an outcome-based
163
EDSS.
164
165
166
167
3.1 Ethical statement
168
169
All stakeholders gave their informed consent for inclusion before they participated in the study.
170
The study was conducted in accordance with the Declaration of Helsinki, and the protocol was
171
approved by the Scottish government rural and environment science and analytical services division
172
(RESAS).
173
174
Preprints (www.preprints.org) | NOT PEER-REVIEWED | Posted: 6 October 2017 doi:10.20944/preprints201710.0032.v1
5 of 21
3.2 Phase 1: Stakeholder engagement and review of software options
175
176
Following production of a review of outcome-based logic modelling [34], meetings were held
177
with policy stakeholders in Scottish Government to discuss how logic modelling could support their
178
outcome-based approach in the National Performance Framework [11]. To start the co-construction
179
of an outcome-based logic modelling approach to aid decisions about landscape interventions to
180
deliver multiple benefits e.g. water quality, terrestrial biodiversity and land manager income, a
181
series of interviews were carried out with 13 national and regional level stakeholders about adaptive
182
management and outcome-based approaches [37]. The results of this work are extensive and lie
183
beyond the scope of this paper, but provided a useful starting point for understanding the rationales
184
behind the outcome-based approach.
185
186
Using initial insights from stakeholders of their needs to be addressed, experiences from
187
colleagues involved in participatory GIS projects and our expertise in integrative modelling with
188
stakeholders we started to narrow down the wide range of software options. Potential software
189
options were selected for their potential to meet seven initial requirements which formed our
190
screening criteria (Table 1). Review of existing software options for supporting outcome-based
191
environmental management was undertaken from published, unpublished and internet sources.
192
Where possible, we downloaded software and experimented with it in order to better inform our
193
review. A short list of software options was then explored with the aim of developing an interactive
194
prototype. A set of additional requirements were used to guide this development. One aim was to
195
develop a prototype to be demonstrated to stakeholders in the second phase.
196
197
3.3 Phase 2: Participatory workshop
198
199
In Phase 2, we organised a half-day workshop with stakeholders with expertise in
200
outcome-based environmental management, in order to deepen understanding of requirements and
201
begin a process of co-development. The workshop was attended by six participants representing key
202
domains in land and water management in Scotland, comprising representatives from the
203
Cairngorm National Park Authority, Scottish Natural Heritage and Scottish Environmental
204
Protection Agency and three researchers with >50 years collective experience of developing practical
205
tools to support land and water management for multiple benefits.
206
The workshop was based around a series of linked activities. In the first activity the participants
207
were asked to rate a list of 17 “needs” identified during the earlier interviews and were given an
208
opportunity to add their own perspectives on the needs we are addressing The second activity
209
involved working in pairs, of researcher and a practitioner, the participants were invited to provide
210
suggestions for the key principles that our approach would use to address the identified needs. The
211
idea of “principles” is central to UCSD (see e.g. [38, 28]) and is distinct from user requirements or
212
needs in that it specifies how a system should be developed, not what the system aims to do.
213
A sheet of existing principles from related approaches or applications was provided to the
214
participants as a guide. As we were interested to see what principles the participants would come up
215
with independently, we did not share our draft list. Principles suggested by the participants were
216
discussed by the whole group, and at the end of the activity, the participants were invited to
217
comment on the draft list of principles we had developed ourselves prior to the workshop.
218
The third activity included an overview of hands-on advanced testing of software options,
219
development of an interactive digital prototype, and facilitated discussion around an interactive
220
prototype on a large touch table.
221
4. Results
222
4.1 Phase 1
223
224
Preprints (www.preprints.org) | NOT PEER-REVIEWED | Posted: 6 October 2017 doi:10.20944/preprints201710.0032.v1
6 of 21 The stakeholder interviews confirmed the need for tools that supported an outcome-based
225
approach with a central role for facilitation in place based studies. There is a wide range of software
226
tools and applications that are or could be used to aid facilitated discussions of place based studies.
227
Using the list of screening criteria (Table 1) we reduced a long list of 19 software options to seven
228
options for further hands-on testing and development. The long list of software options were
229
classified into four broad groups. These were: existing adaptive management logic modelling
230
applications e.g. Miradi1, existing desktop participatory modelling applications e.g. QUICKScan2,
231
GIS applications e.g. QGIS3, and a range of software packages for developing web based
232
applications e.g. R Shinydashboard4. In order to review these options in a structured way, we
233
developed a set of seven criteria. These criteria were informed by our own previous work in this
234
area, the interviews with stakeholders [37] and conversations with colleagues. These criteria were as
235
follows:
236
237
The tool/software:
238
239
1. Should be free at the point of use. This is an essential pre-requisite of the outcome-based approach,
240
which requires transparency and effective exchange of knowledge and data between stakeholders at
241
all points in the process chain. Commercially licensed software is typically not free to use or share
242
and thus cannot meet this basic requirement.
243
244
2. Should work on touch devices like mobile phones, tablets and larger touch tables since touch-enabled
245
devices are now widely used. Many applications that have potential for use as EDSS (e.g. QGIS) are not
246
designed for touch screen use. Again, to ensure that any application can be widely shared, it should
247
function on a range of devices, not just on standard desk-based PCs. Outdoor workers, e.g. in
248
forestry or agriculture, are likely to prefer an application which can run on portable devices like
249
smartphones or tablets.
250
251
3. Should have map-based functionality for users to interact with spatial information e.g. information on
252
fields and other features related to land and water management. The focus on spatial information is crucial,
253
since nearly all environmental decision-makers use maps as a means of communicating information
254
about interventions in the landscape. At the same time, to establish a genuine process of knowledge
255
exchange, information needs to flow in both directions, so some form of user interaction is
256
necessary, either in terms of allowing the user to pull data from the system, or in actually offering
257
the possibility to upload and work with users’ own data.
258
259
4. Should include functionality for outcome-based logic models i.e. linking land management to a range of
260
outcomes. This apparently very specific requirement can be seen to have broader implications for
261
environmental decision-support. The software needs to be able to link the information provided to
262
the user to desirable or required outcomes in a dynamic way. In this way it is possible to understand
263
the implications of different interventions – e.g. for example, by adding a connection between land
264
use type in a holding and sediment or nutrient run-off, a user would potentially be able to evaluate
265
the likely outcomes of land use changes in terms of water quality and other policy and management
266
objectives.
267
268
5. Should allow developers and end-users to develop and extend the software/existing application. The
269
ability to modify and extend the software to add or change functionality was thought to be
270
1 https://www.miradi.org/
2http://www.quickscan.pro/
3http://www.qgis.org/en/site/
4https://rstudio.github.io/shinydashboard/
Preprints (www.preprints.org) | NOT PEER-REVIEWED | Posted: 6 October 2017 doi:10.20944/preprints201710.0032.v1
7 of 21 important, since environmental management is a dynamic sphere of action in which new datasets,
271
plans and policies and strategies are frequently emerging. It should be clarified that we did not
272
anticipate that all users should want or need to do this, but that it should in principle be possible for
273
the development team.
274
275
6. Should have potential for scientific innovation. This is a constraint that may have little interest from
276
the point of view of an end-user, but is important for researchers in today’s competitive science
277
environment. A tool or approach that cannot show some potential to advance scientific practice or
278
understanding cannot be expected to hold the interest of the scientific community, and makes it
279
more difficult to obtain funding. It should be emphasized that we are not necessarily talking about
280
technological innovation - finding new ways for stakeholder groups to interact around a problem
281
would also be a worthwhile scientific innovation.
282
283
7. Should be actively maintained, preferably through a large, open user community. Given the previously
284
mentioned interest in software that is free (at least at the point of use), it is important to distinguish
285
between projects that are no longer actively maintained and those that are, preferable with a large or
286
active user community. This is an important factor in ensuring the ability to modify or extend the
287
software in the future – changes in PC hardware or software over time mean that software needs to
288
be actively maintained. The multi-purpose software environment R and the popular free GIS
289
package QGIS, for example, are actively maintained, with vibrant user communities, whereas the
290
GIS software ILWIS, while still maintained, seems to be less actively developed and the user
291
community, by comparison, is small.
292
293
Using these screening criteria we selected seven potential software options for more detailed
294
hands on testing (see Table 1). Six of these seven options were software packages and applications
295
for developing web-based applications. The other option was ROAM which is QGIS application
296
designed to aid field-based collection of data using touch devices. Our proposed principles for
297
development of a digital application meeting these seven criteria are shown in Figure 2.
298
299
300
301
Figure 2. Draft principles produced by the workshop organisers.
302
Software options were classified in four broad groups (Table 1), which are discussed as follows.
303
304
4.1.1. Existing adaptive management logic model applications
305
306
The only software known to the authors in this group is Miradi, a software application intended
307
to help adaptive management of conservation projects. This was included as the only software
308
explicitly designed to facilitate the logic modelling outcome-based approach. Logic chain modelling
309
is explicitly implemented through a flowchart view, and other functionality to assist work planning
310
and budgeting and assessment of viability of targets. At present the software has no spatial
311
Preprints (www.preprints.org) | NOT PEER-REVIEWED | Posted: 6 October 2017 doi:10.20944/preprints201710.0032.v1
8 of 21 component, but stated future plans for the software include development of a spatial mapping
312
capability. But as at presently non-spatial, proprietary, and non-modifiable software this was not
313
included in our selection.
314
315
316
4.1.2. Existing standalone participatory modelling applications
317
318
This group comprises a small selection from the large range of modelling applications currently
319
in existence that include explicit participatory modelling functionality or that have been used in
320
participatory processes and is not intended to be representative or comprehensive (see e.g. [39, 40]
321
for more detailed reviews of participatory modelling software options and approaches). QUICKScan
322
is a well-known commercial software application developed by Alterra, at Wageningen
323
Netherlands, which is widely applied, including in Scottish cases [41]. It offers a rule-based
324
approach to help stakeholders negotiate trade-offs in resource management contexts, and is
325
explicitly spatial. This seemed quite appropriate for our case, but as a non-modifiable and non-free
326
software, could not be included in our selection. Metronamica is another software application with
327
20 years + development behind it, very popular in the land-use modelling community. Though it
328
does not offer specific participatory functionality, it is frequently used in decision-support contexts
329
(e.g. [1]), and for working with stakeholders [42, 32], even if its complexity means that stakeholders
330
rarely use the model themselves.
331
332
4.1.3. GIS modelling applications
333
334
This group includes very well-known commercial applications like ArcMap as well as the
335
popular open source application QGIS. These have been included because there are many spatial
336
decision support applications built around these platforms, see e.g. for ArcMap [43, 44] and for QGIS
337
[45,46], but unfortunately, we found both of these to be poorly adapted to touchscreen
338
environments, both in terms of operation (sluggish and buggy) and in terms of the user interface
339
(tiny buttons, missing right mouse button functionality). The 3D Community Viz Public
340
Participation GIS plugin for ArcMap was unusable on our touch table. The ROAM application,
341
which provided a touch-screen friendly interface for QGIS was much more promising, and was
342
selected for further investigation.
343
344
4.1.4. Software packages and applications for developing web-based applications
345
346
This last group stood apart from the other three software groups in that all of the tools reviewed
347
in this group were web-based. Though these tools have the potential disadvantage of requiring
348
adequate internet and mobile coverage, they can be designed to work off-line. They represent a
349
significant innovation in terms of user interaction and inter-platform flexibility. For all of the other
350
groups, non-windows operating system users are disadvantaged (with the notable exception of
351
QGIS), and mobile device support is nearly non-existent. This group of applications stood out as
352
addressing much more closely stakeholder needs, e.g. mobile, touch-enabled and Free-and-Open
353
source (FOSS). With these applications a clear trade-off could be identified between being able to use
354
“as-is” and customizability – in many cases there seemed to be good potential to flexibly incorporate
355
and link maps, tables and charts, but we lacked the programming skill to do this effectively. One
356
application in particular, Rshiny, and its dashboard extension, Rshinydashboard, was very
357
promising in this regard, since these tools are part of the well-known FOSS environment “R”, which
358
is very popular with scientific users and has a large and active user community. For this reason, the
359
advanced prototype was developed in Rshiny.
360
Preprints (www.preprints.org) | NOT PEER-REVIEWED | Posted: 6 October 2017 doi:10.20944/preprints201710.0032.v1
9 of 21
Table 1. Assessment of software options for tool development.
361
362
Options Criteria
Free to
use1
Use on touch devices2
Interact spatially3
Logic model4
Develop/ extend5
Innovation6 Status7 Selected: yes or no
Links/notes
Existing adaptive management logic model applications
Miradi 100-999 No No Yes No Low Active No https://www.miradi.org/
Mobile version Maybe8 Yes Maybe Yes Maybe Maybe Active No Not available.
Existing standalone participatory modelling applications
Quickscan 100-999 No Yes Maybe No Low-med Active No http://www.quickscan.pro/products
Metronamica >10000 No Yes Maybe No Low-med Active No http://www.metronamica.nl/
Geodesign 0 Maybe Yes Maybe Maybe Med-high Active No https://www.geodesignhub.com/,
Limited to the existing geodesign process.
GIS modelling applications Community Viz
ArcMap plugin
100-999 No Yes No Yes Med Active No http://placeways.com/communityvi
z/index.html
MCDA4ArcMap 09 Maybe Yes No Yes Med Active No https://mcda4arcmap.codeplex.com/
EMDS (US EPA) 0 Maybe Yes Maybe Maybe Low-med Active No http://1726-4482.el-alt.com/aboutem
ds
Not freely available.
Standard ArcMap 100-999 No Yes No Yes Low-med Active No http://www.arcgis.com/
Standard QGIS 0 Yes with
plugin
Yes Yes Yes Med Active No http://www.qgis.org/en/site/
Issue about large move from version 2 to 3.
ROAM (QGIS app)
0 Yes Yes Maybe Yes Med-high Active Yes https://github.com/DMS-Aus/Roam
Software packages and applications for developing web-based applications
Python back-end 0 Yes Yes Yes Yes High Active Yes Meets many criteria, will take more
Preprints
(www.preprints.org) | NOT PEER-REVIEWED | Posted: 6 October 2017
doi:10.20944/preprints201710.0032.v1
Peer-reviewed version available at
Environments
2017
,
4
, 88;
10 of 21
Options Criteria
Free to
use1
Use on touch devices2
Interact spatially3
Logic model4
Develop/ extend5
Innovation6 Status7 Selected: yes or no
Links/notes
based Leaflet applications e.g. Django or Flask
effort to develop
https://www.djangoproject.com/ http://flask.pocoo.org/
Javascript back-end based Leaflet
applications using Node
0 Yes Yes Yes Yes High Active Yes https://nodejs.org/en/
Kivy 0 No10 Yes Yes Yes High Active No https://kivy.org/#home
RShiny,
RShinydashboard
0 Yes Yes Yes Yes High Active Yes https://shiny.rstudio.com/
https://rstudio.github.io/shinydashb oard/
Jupyter dashboard
0 Maybe Yes Yes Yes High Active Yes https://github.com/jupyter/dashboa
rds
Tableau 0 Yes Yes Yes Yes Med-high Active Yes https://www.tableau.com/
Not sure if it can be used off line. Spotfire 1000-999
9
Yes Yes Yes Yes Med-high Active No http://spotfire.tibco.com/
Plotly (Dash) 0 Yes Yes Yes Yes Med-high Active Yes https://plot.ly/products/dash/
363
1 Approximate cost (£): 0, 1-99, 100-999, 1000-9999, and >10000; 2 Is the user interface designed for non-expert/group touch screen i.e. is the navigation easy to
364
use: yes or no; 3 Is there part of the screen that includes a map: yes or no; 4 Can logic models potentially be viewed and edited: yes or no; 5 Can the project team
365
with their Python, R and JavaScript expertise develop the application and extend it: yes or no; 6 What is the potential for scientific innovation: low=old
366
application and widely used, med=established application but not widely used, high=new application; 7 Is it still being supported: inactive= little evidence of
367
activity over the past year, active= evidence of activity over the past year; 8 A ‘maybe’ indicates that information was not available to judge against these
368
criteria; 9 ArcMap not free to use; 10 Not on Windows devices.
369
370
Preprints
(www.preprints.org) | NOT PEER-REVIEWED | Posted: 6 October 2017
doi:10.20944/preprints201710.0032.v1
Peer-reviewed version available at
Environments
2017
,
4
, 88;
11 of 21
Table 2. Workshop participants’ 12 principles related to stakeholder requirements (centre) and our own list of 7 proposed criteria (right). The number in superscript
371
in the middle column denotes the number of times this requirement was listed. In some cases the same requirement appears more than once for a single principle,
372
because this requirement was selected by more than one of the three groups.
373
374
No. Principle What stakeholder requirement does this relate to? Which of the seven criteria does this relate to?
1 Updateability None 2. Work on touch devices
5. Allow users to develop and extend 6. Potential for scientific innovation 7. Actively maintained
2 Agile development. Multiple
versions
• Dashboard format
• Support/ incentives and regulation
1. Free at the point of use.
5. Allow users to develop and extend 7. Actively maintained
3 Provides cost-benefits of options
• Helps indicate areas to 'invest' in interventions 3. Map-based functionality for users to interact with spatial information
4. Include functionality for outcome-based logic models i.e. linking land management to a range of outcomes 4 Clarity of objective: public
interest, land manager, community
• Policy and on the ground connections 3. Map-based functionality for users to interact with
spatial information.
4. Include functionality for outcome-based logic models i.e. linking land management to a range of outcomes 5 Iterative: exploration of
multiple scenarios and consequences
• Iterative evaluation of options 4. Should include functionality for outcome-based logic
models i.e. linking land management to a range of outcomes
6 Credible/transparent • Provide evidence of benefits
• Information needs to be provided in a digestible format
1. Free at the point of use. 2. Work on touch devices
3. Map-based functionality for users to interact with spatial information.
7 Credible and trustworthy • Information needs to be provided in a digestible format2
4. Should include functionality for outcome-based logic models i.e. linking land management to a range of outcomes
8 Practical - relates to users experience and needs
• Provide evidence of benefits2 • Spatial location of interventions
3. Map-based functionality for users to interact with spatial information.
Preprints
(www.preprints.org) | NOT PEER-REVIEWED | Posted: 6 October 2017
doi:10.20944/preprints201710.0032.v1
Peer-reviewed version available at
Environments
2017
,
4
, 88;
12 of 21
4. Include functionality for outcome-based logic models i.e. linking land management to a range of outcomes
9 Accessible/easy to use • Information needs to be provided in a digestible
format3 • Place-based
• Information needs to be provided in a digestible format4
• Spatial location of interventions2
1. Free at the point of use. 2. Work on touch devices
3. Map-based functionality for users to interact with spatial information.
10 Clear on operational scale • Integrated approach for incentives, regulation and voluntary measures/ balance is key
3. Map-based functionality for users to interact with spatial information.
11 Dealing honestly with uncertainty: avoid large-scale uniformity of outcome, diversity manage via incentives/regulations
• Tools should promote diverse outcomes, even to similar places and objectives
4. Should include functionality for outcome-based logic models i.e. linking land management to a range of outcomes
5. Allow users to develop and extend
12 Limited need for
time-consuming tool. Must not take ages to develop
• Spatial location of interventions3
• Information needs to be provided in a digestible format5
• Tools should promote diverse outcomes, even to similar places and objectives2
• Information needs to be provided in a digestible format6
2. Work on touch devices
3. Map-based functionality for users to interact with spatial information.
5. Allow users to develop and extend
Preprints
(www.preprints.org) | NOT PEER-REVIEWED | Posted: 6 October 2017
doi:10.20944/preprints201710.0032.v1
Peer-reviewed version available at
Environments
2017
,
4
, 88;
4.2 Phase 2
375
376
4.2.1. Stakeholders’ principles for EDSS
377
378
Workshop participants identified 12 principles for development of a software application for
379
supporting environmental decision-making to improve the management of land and freshwater
380
resources in Scotland. These are shown in Table 2. The key points that emerged from this activity
381
and the subsequent discussion are described as follows.
382
383
4.2.1.1. Updateability: This was regarded as very important due to the rapidly evolving nature of
384
environmental policy and the need to be adaptable and responsive. Participants emphasized the
385
highly changeable nature of both the policy context and the data (Principle 1, Table 2).
386
387
4.2.1.2. Practicability and usefulness: It was agreed that the tool should be both practical and
388
useful. Since usefulness is subjective and therefore dependent on the end-user, involving end-users
389
in the development process seemed like a good way to achieve this, e.g. through AGILE
390
development principles [47] (Principle 2, Table 2).
391
392
4.2.1.3. Clarity of purpose and objectives: Participants highlighted the need for clarity about the
393
intended purpose and objective of the application. This is likely to depend on specific end users,
394
further highlighting the need for a flexible, AGILE-type approach (see above)
395
396
4.1.2.4. Uncertainty, credibility and trustworthiness: Participants emphasized the need to deal
397
honestly with uncertainty, both of data and of model/application outputs. This was regarded as
398
having important implications for the credibility and trustworthiness of the information provided
399
by the decision-support application (Principle no. 6, Table 2). It was suggested that data should be
400
filtered before providing it, since users may lack the knowledge to appreciate uncertainty. However,
401
it was also appreciated that absolute certainty was not attainable, since scientists themselves
402
frequently disagree about the trustworthiness of data or the reliability of the results. However, this
403
was regarded as an important development principle even if it is not achievable in practice.
404
405
4.1.2.5. Openness about limitations/transparency: It was regarded as important to be transparent
406
about what a tool can and cannot do. Transparency of the tool and of the decision-making process
407
was a key principle (Principle no. 6, Table 2). This is somewhat related to the issue of trust and
408
credibility (above).
409
410
4.1.2.6. Specify intended scale of data and operation: In an issue related to the need for openness
411
about uncertainty, participants raised the need to be clear about the intended cartographic scale of
412
operation for the application. This can be partially addressed in practice by ensuring that datasets do
413
not display at zoom levels that exceed their nominal scale.
414
415
4.1.2.7. Cost-benefit estimates for policy interventions: The need to provide cost-benefit
416
information was highlighted by one of the participants, but others disagreed. One argument that
417
was made against this idea was that it would be difficult to determine which actors would be best
418
placed to make the cost-benefit assessment, since each actor would require a different cost-benefit
419
analysis to suit their land/circumstances.
420
421
4.1.2.8. Diversity vs commonality: Although there was a high level of agreement about some
422
aspects, for example, the importance of credibility (Principles 6 and 7; Table 2) and accessibility
423
(Principle 9; Table 2), there was disagreement about others, e.g. appropriateness of cost-benefit
424
Preprints (www.preprints.org) | NOT PEER-REVIEWED | Posted: 6 October 2017 doi:10.20944/preprints201710.0032.v1
2 of 21 analysis. This reminds us that end users are likely to have widely varying objectives in mind, and
425
that it will be difficult to please all of them with a single application.
426
427
4.1.2.9. Decision support, not decision automation: Participants were keen to emphasise the need
428
to be clear that the tool supports decisions, but does not actually make them.
429
430
In discussion, our own, more generalized principles (Figure 2) found general agreement.
431
Several of our own suggested principles were also included by the participants, e.g. transparent,
432
accessible and practical. However, participants observed that more clarity could be provided by
433
setting them out as sentences (rather than single words). Following the workshop, we drew up a
434
revised set of general principles incorporating the principles suggested by stakeholders and
435
following their advice (Table 3). This is intended as a synthesis, not a replacement, of the detailed
436
principles set down in Table 2.
437
Table 3. Integrated general principles for application development.
438
Approach
The approach will help facilitate decisions about land and water resources.
It will aim to be integrative through considering a range of environmental and financial outcomes. It will aim to support adaptive management though clarity of objectives/outcomes, and linking with evidence that supports exploration of those options to achieve those objectives/outcomes.
The approach will be designed to be easy to use and efficient.
Digital application
It will be accessible for anyone to use.
It will be relevant and practical for land managers.
It will aim to be credible, with transparency in the information and methods used.
It will be designed to be updateable with new information as it comes available.
439
4.2.2. Facilitated discussion around the prototype application
440
441
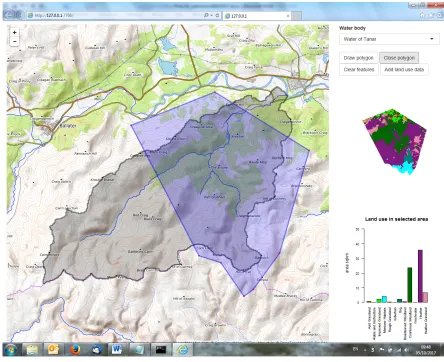
The prototype application (Figure 3), as we had hoped, since we had developed it in response to
442
stakeholder criteria, was well-received. Though the application meets many of these requirements,
443
being FOSS, optimised for touch-table use and multi-platform, it does depend on the R software
444
environment, which is not currently supported as standard on mobile phones, though it does appear
445
to be possible to run it5. Stakeholders particularly appreciated the smooth map scrolling provided by
446
the leaflet application, a GIS map server package available under R. The users appreciated the
447
dashboard format, with a large map window occupying most of the screen and user controls and a
448
linked chart output in a box to the right. The application was tested with land use data (Land Cover
449
Map 20076), which it allowed users to interact with (enquiry of land use type, clipping out a polygon
450
and querying land use area in the polygon area). The land use data generated an interesting
451
discussion, and stakeholders highlighted the importance of providing scale information, clearly
452
naming the source of the land use data, and adequately informing about its known limitations.
453
Participants were not widely agreed about the reliability of the land use dataset, which led to a
454
detailed discussion around reliability and trustworthiness of information presented.
455
456
457
458
5 http://tteoh.com/technology/2016/10/20/r-rstudio-mobile-android/
6 https://www.ceh.ac.uk/services/land-cover-map-2007
Preprints (www.preprints.org) | NOT PEER-REVIEWED | Posted: 6 October 2017 doi:10.20944/preprints201710.0032.v1
3 of 21
459
460
461
Figure 1. Prototype application running on Windows. The screen capture shows the Water of Tanar
462
sub-catchment of the river Dee in Aberdeenshire, Scotland. The user has drawn a polygon, which has
463
been clipped out of the land use base map (LCM2007) and is displayed in the box to the right of the
464
map window. Below it, the area of each land use in the polygon is displayed as a histogram.
465
5. Discussion
466
5.1. Outcome-based environmental management: what do users really want?
467
There is an increased need from stakeholders for integrative approaches and tools to address
468
outcome-based approaches in environmental management. The new breed of web-based tools offers
469
new opportunities for application development, but at the same time, to develop software systems
470
effectively it is necessary to understand user requirements. This lies at the heart of producing useful
471
software and is an established principle in software development that developers of EDSS could
472
learn from. In order to understand user requirements, structured participatory processes like the one
473
we have presented in this paper are necessary. The process of co-construction of an application
474
typically passes through a series of key steps relating to facilitated participatory activities.
475
Stakeholders can analyse their needs as environmental decision-makers, identify key development
476
principles for a software application designed to address them and road–test an advanced prototype
477
application.
478
We discovered that the tool our stakeholders wanted does not much resemble most published
479
examples of EDSS used by the scientific community (see, e.g. [48]). Our application should be free to
480
use, touch and mobile-device enabled, part of an existing active development chain or community
481
Preprints (www.preprints.org) | NOT PEER-REVIEWED | Posted: 6 October 2017 doi:10.20944/preprints201710.0032.v1
4 of 21 and be clearly oriented to understanding and evaluating environmental policy options in terms of
482
outcomes, e.g. showing how a riparian buffer strip can improve water quality in a given location, or
483
showing how land use change may influence diffuse pollution. It will be intended for use, probably
484
in the field, by land managers and regulators, e.g. farmers, protected area managers or utilities
485
operators.
486
One possible reason why the EDSS that has been conceptualised by our stakeholder group is so
487
different to existing EDSS found in the literature is because of the specific requirements of our study
488
and its context, e.g. catchment management in Scotland, adaptive management framework, and
489
emphasis on understanding effectiveness of interventions through outcomes. But since these aspects
490
are also recognised as important in environmental management further afield; though adaptive
491
management has some well-recognised limitations (see, e.g. [49]) it is still widely regarded, at least
492
in modified guise of adaptive co-management (ACM) as a playing a valuable role in good
493
environmental governance [50]. At the same time, outcome-based approaches are increasingly seen
494
as best practice in environmental assessment, decision-making and stakeholder engagement [51].
495
Therefore the apparent absence of appropriate tools probably does indicate a real need.
496
In fact, there seems to be a genuine mismatch between what environmental decision-makers
497
like our stakeholders want, and what EDSS developers, who are typically scientists, tend to produce
498
(Table 4).
499
Table 4. The mismatch between EDSS that scientists have tended to develop, and EDSS that
500
environmental decision-makers typically want.
501
EDSS that scientists have tended to develop EDSS that decision-makers want
Platform
Micro-computer oriented, Windows operating
system
Mobile device oriented, multi-platform
Cost model
Proprietary Free and Open-Source
Application type
Stand-alone, out of the box solution that the user
cannot easily modify
Flexible, integrated (web-based), easily
customizable
Purpose
Understanding a complex problem Deciding from a range of options
Exploring future scenarios Evaluating cost-benefit
Predicting tendencies Linking science and policy to show clear
outcomes
Synthesizing complex information into a digestible message
Implicit role of scientist
Selling knowledge systems Facilitator and provider of free, open advice
External expert Participant and stakeholder
502
503
504
Preprints (www.preprints.org) | NOT PEER-REVIEWED | Posted: 6 October 2017 doi:10.20944/preprints201710.0032.v1
5 of 21 There are four key reasons for this mismatch in general terms
505
1. Problem-solving stage. The kinds of EDSS that help stakeholders understand complex
506
interactions, explore future scenarios, or predict existing tendencies are generally not suitable, or
507
really intended, for use directly by practitioners, but are rather intended to supply information to
508
them in the form of reports and briefings based on model results. Generally, practitioners do not
509
need or want to run land use simulations for 2050 or experiment with the effect of different types of
510
forcing mechanisms on climate. An EDSS that a farmer might hold in their hand to allow them to
511
explore a range of options for managing a river catchment belongs to a different part of the process
512
at a later stage in the chain. This kind of EDSS operates under the assumption that first type
513
described is already embedded in the policy-making process. This type of EDSS belongs to a
514
different problem-solving stage, where, in the words of [52], “we agree to stop worrying about
515
generalities and focus instead on impacts, mitigation, compensation, and accommodation”. There is
516
a fundamental need to better understand the requirements of users at the policy implementation
517
stage.
518
2. Type of decision-maker and level of action. A related question is the type of decision-maker and the
519
level of action at which they are typically operating. The hypothetical farmer referred to above is
520
making decisions at the scale of the land parcel, unlike, say, an agriculture minister, who is
521
interested to know, in broader terms, about land use in general to inform land use policy more
522
broadly. Many EDSS found in the scientific literature are concerned with these higher level decisions
523
and EDSS directed at the scale of the land parcel tend to be under-represented in the scientific
524
literature (though see, e.g. [14]). One of the most important priorities for our stakeholder group was
525
the provision of reliable scientific information in an accessible and digestible format, rather than
526
solution of complex analytical problems, or estimations of long-term tendencies.
527
3. Technological development time-lag. The significant time lag between submitting research
528
proposals and the award of funding, and between development of a model or system and
529
publishing it in a journal means that the most recently published EDSS are based on
530
conceptualisations of technology (if not actual availability) from 3 or 4 years ago. Given the pace of
531
change in information systems development, there is a significant likelihood that EDSS of the kind
532
that emerged from our participatory process are currently being developed but are poorly
533
represented in literature. An interesting review of this topic in the context of rural development can
534
be found in [53].
535
4. Change in the role of the scientist. As can be appreciated from Table 4, the type of EDSS
536
conceptualised on the right requires the scientist to play a different, perhaps less glamorous role,
537
than that of aloof, objective expert of popular imagination. To help achieve sustainability objectives
538
in land and water management scientific stakeholders should focus on facilitation and knowledge
539
transfer at the level of implementation of concrete actions, as well as knowledge production
540
activities higher up the chain.
541
Designers of EDSS need to move away from developing tools for standard desktop software
542
and systems and make full use of mobile and touch-based technologies which people are becoming
543
increasingly familiar. Web dashboards, already popular as ‘business intelligence’ tools, provide the
544
user with a range of integrated graphical outputs, e.g. a map, a histogram and a data table and offer
545
an idea of how such applications might look. FOSS tools like Rshiny and Rshiny dashboard which
546
facilitate web-development from inside widely supported scientific software environments with
547
active user communities (in this case, R), seems like a promising direction of travel.
548
Providing complex information under high uncertainty in an easily digestible format is a major
549
challenge. Our stakeholders were clear that the limitations and level of uncertainty in complex
550
Preprints (www.preprints.org) | NOT PEER-REVIEWED | Posted: 6 October 2017 doi:10.20944/preprints201710.0032.v1
6 of 21 scientific information needed to be clearly explained in any application, and that great care should
551
be taken not to provide information out of context or at inappropriate spatial scales.
552
6. Conclusions
553
Developing software applications to support land managers decisions under outcomes-based
554
approaches to adaptive environmental management requires better stakeholder engagement
555
practices to understand their needs and development requirements, and a stronger focus on new
556
digital tools and open software and data. We have presented an example of a stakeholder-centred
557
process to develop one such tool. By focussing on understanding and managing outcomes of
558
environmental improvement measures, a preliminary review based on initial requirements led to
559
the rejection of a large range of currently available tools and software as unsuitable. Many do not
560
run effectively on the mobile and touch-based devices that land managers typically use, and most
561
are proprietary systems that require an upfront financial outlay and do not allow users to modify the
562
source code or customize the application to suit their own needs. These aspects restrict their use to
563
mostly scientific stakeholders and do little to facilitate environmental decision-making at the scale of
564
the land parcel. What stakeholders really need are mobile, web-based, touch devices that are free at
565
the point of use and flexible enough to be easily adapted to meet changing requirements and
566
different user needs.
567
Under the late nineties and early noughties “out-of-the-box toolkit” paradigm, scientists sought
568
to package their knowledge into marketable products and systems under the assumption that clients
569
would materialize with fully-formed problems requiring solutions. Since then, the world has moved
570
on. Scientists now understand that this kind of hands-off back-office knowledge delivery is
571
ineffective; these kinds of tools are rarely used. Not only do land-managers not want to use a
572
complex computational model, they need software that answers specific questions like “how much
573
will it cost to build a riparian buffer strip along the river that bounds my land, and to what extent
574
will this reduce surface run-off from my arable fields?”, or “what specific interventions would be
575
most appropriate in this part of the catchment, and what incentives and regulations are likely to be
576
relevant?” To provide better answers to these questions, scientific stakeholders need to play strong
577
facilitation roles at all points in the development process, including problem-framing, stakeholder
578
engagement, application development and use.
579
580
Acknowledgments: The research described was funded by the Rural & Environment Science & Analytical
581
Services Division of the Scottish Government. We are very grateful to all of the stakeholders who participated
582
as part of this process.
583
Author Contributions: RH and KM carried out the research described and wrote the paper.
584
Conflicts of Interest: The authors declare no conflict of interest.
585
References
586
1. Kok, K., & van Delden, H. (2009). Combining two approaches of integrated scenario development to combat
587
desertification in the Guadalentin watershed, Spain. Environment and Planning B: Planning and Design, 36(1),
588
49-66.
589
2. McIntosh, B. S., Ascough, J. C., Twery, M., Chew, J., Elmahdi, A., Haase, D., ... & Chen, S. (2011).
590
Environmental decision support systems (EDSS) development–challenges and best practices. Environmental
591
Modelling & Software, 26(12), 1389-1402.
592
3. Holmes, J., & Clark, R. (2008). Enhancing the use of science in environmental policy-making and regulation.
593
Environmental Science & Policy, 11(8), 702-711.
594
Preprints (www.preprints.org) | NOT PEER-REVIEWED | Posted: 6 October 2017 doi:10.20944/preprints201710.0032.v1