The Study of the Effect of Non Performing Assets (NPA) on Return on Assets (ROA) of Major Indian Commercial banks.
Prof. Nitin Bajirao Borse
MVP Samaj’s Arts, Science and Commerce Colleje, Ozar MIG (Affiliated to Savitribai Phule Pune University) Abstract:
After the liberalization policy of 1991, Indian banking sector change dramatically and measure were taken for making Indian banking sector as a world standard. There are many obstacles faced by Indian banks and increasing NPA is one of them. There are two types of NPA – Gross NPA and Net NPA. For present study Net NPA are considered. Reserve Bank of India (RBI) is monitoring these phenomena and declaring guidelines at various times. After the slowdown of 2008, the threat of increasing NPA and decreasing ROA is witnessed. This paper is an attempt to correlate the NPA and ROA of Indian commercial Banks. Though the sample size is small but all major 11 banks (6 Public sector banks and 5 Private sector banks) where chosen for the study. 2010-11 to 2014-15 is the study period for this study. It is found that In this study period of 4 years, NPA increase rate is higher in public sector banks than the private sector banks. NPA of private sector banks are well under control. This study shoes that there is moderate negative correlation of NPA and ROA of Public sector banks. This means as the NPA increases it negatively affects the ROA of banks.
Key words: Non performing Assets (NPA), Return on Assets (ROA),Public sector banks, Private sector banks, Indian banks
Introduction:
Banking is the backbone of every economy. In India the establishment of Reserve Bank of India (RBI) (1935), Nationalization of major banks (1969) and liberalization policy (After 1991) are the major milestones in the development of Indian banking system. Indian government is monitoring and interferes in banking through policies of RBI. Raising the standard as per international norms and adapting the new technology are the major challenges in front of Indian banking sector. But in recent time, mostly after 2001, increasing percentage of Non Performing Assets (NPA) is emerging as a major threat to this sector. It is instancing day by day. This problem is comparatively significant in case of Public Sector Banks than the private Sector Banks. It is proven fact that increasing NPA is results in lowering Return on Assets (ROA).
This paper is an attempt to verify this fact in case of Indian banking sector. Hypothesis:
To find out the variation between Public Sector Banks and Private Sector Banks in NPA as well as ROA . Methodology:
Data: This work is totally depending on the secondary data published on reliable websites.
Study Period : the data related to NPA and ROA is taken for the period of financial year 2010-11 to 2014-15. (4 years)
Banks: 6 major Banks from Public sector and 5 Banks of Public sector are chosen for the study.
Data is processed with the help of Excel worksheet.
Statistical Tools: Simple statistical tools like average, correlation are widely used to find out results.
Result and Discussion:
NPA:
Gross NPAs are the sum total of all loan assets that are classified as NPAs as per RBI Guidelines as on Balance Sheet date. Gross NPA reflects the quality of the loans made by banks. It consists of all the nonstandard assets like as sub-standard, doubtful, and loss assets. Net NPAs are those type of NPAs in which the bank has deducted the provision regarding NPAs. Net NPA shows the actual burden of banks. This paper is deals with the Net NPA of Indian banks.
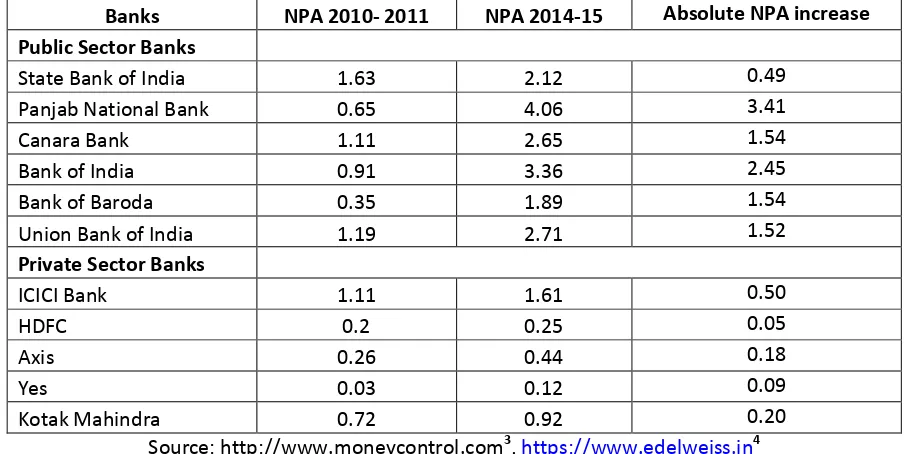
Table. 1 - Increase in NPA of Indian Banks from 2010-11 to 2014-5
Banks NPA 2010- 2011 NPA 2014-15 Absolute NPA increase Public Sector Banks
State Bank of India 1.63 2.12 0.49
Panjab National Bank 0.65 4.06 3.41
Canara Bank 1.11 2.65 1.54
Bank of India 0.91 3.36 2.45
Bank of Baroda 0.35 1.89 1.54
Union Bank of India 1.19 2.71 1.52
Private Sector Banks
ICICI Bank 1.11 1.61 0.50
HDFC 0.2 0.25 0.05
Axis 0.26 0.44 0.18
Yes 0.03 0.12 0.09
Kotak Mahindra 0.72 0.92 0.20
Source: http://www.moneycontrol.com3, https://www.edelweiss.in4
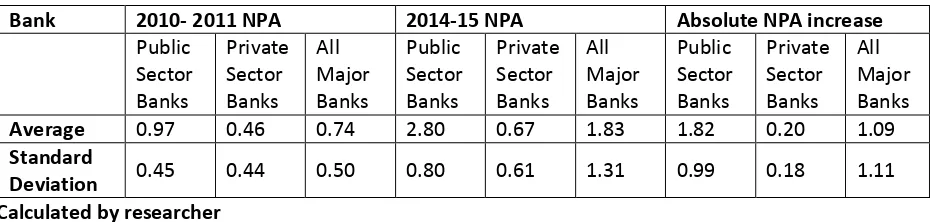
Table No. 2. Comparison of Major Private and Public Sector Banks of India
Bank 2010- 2011 NPA 2014-15 NPA Absolute NPA increase
Public Sector Banks Private Sector Banks All Major Banks Public Sector Banks Private Sector Banks All Major Banks Public Sector Banks Private Sector Banks All Major Banks Average 0.97 0.46 0.74 2.80 0.67 1.83 1.82 0.20 1.09 Standard
Deviation 0.45 0.44 0.50 0.80 0.61 1.31 0.99 0.18 1.11 Calculated by researcher
It is observed that Net NPA of the major public and private sector banks has been increased during last 4 years but this increase is more significant in case of public sector banks than the private sector banks. The Net NPA of major private banks is more or less constant. Its increase is mere 0.20%. ICICI bank has highest NPA increase in private sector banks. SBI is showing good efforts in lowering the speed of NPA increase.
The question is why the Net NPA of Public sector banks is more than the Private sector banks in India? There are many reasons for this situation. Expert gives the following reasons….
First and foremost, it is the social obligations that are to be met by PSBs which are to be blamed for the inflating bad loans. Unlike the private banks, the public sector banks have to provide loans to vulnerable sector of the economy, namely: Infrastructure, Mining, Aviation, Iron-and-steel, and Textiles.
Under Reporting of NPAs by Private Sector Banks. (to avoid, keeping funds aside as a provision as a buffer funds)
Lack of expert officers at higher positions 7 Granting loans to Unworthy customers
No solid effective mechanism to recover these bad loans. Hence after a certain period banks restructure these loans and waive off 6
Return on Asset (ROA):
The return on assets (ROA) shows the percentage of how profitable a company's assets are in generating revenue. This number tells you what the company can do with what it has. ROAs over 5% are generally considered good.5 It is An indicator of how profitable a company is relative to its total assets. ROA gives an idea as to how efficient management is at using its assets to generate earnings. Calculated by dividing a company's annual earnings by its total assets, ROA is displayed as a percentage. Sometimes this is referred to as "return on investment".
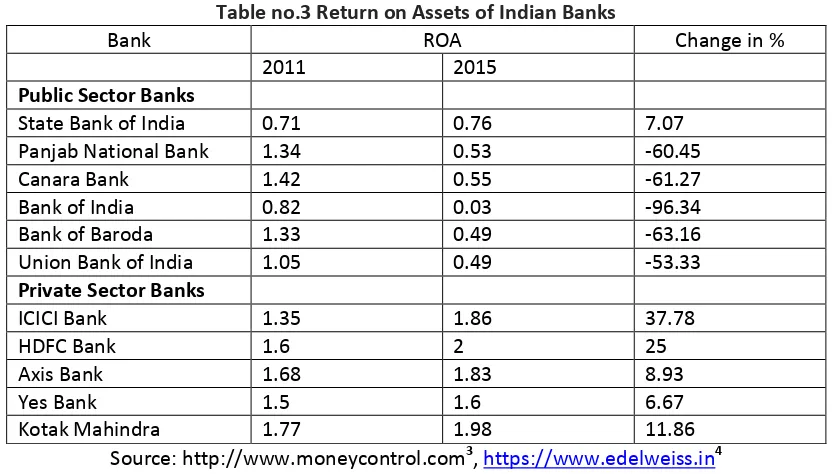
Table no.3 Return on Assets of Indian Banks
Bank ROA Change in %
2011 2015
Public Sector Banks
State Bank of India 0.71 0.76 7.07
Panjab National Bank 1.34 0.53 -60.45
Canara Bank 1.42 0.55 -61.27
Bank of India 0.82 0.03 -96.34
Bank of Baroda 1.33 0.49 -63.16
Union Bank of India 1.05 0.49 -53.33
Private Sector Banks
ICICI Bank 1.35 1.86 37.78
HDFC Bank 1.6 2 25
Axis Bank 1.68 1.83 8.93
Yes Bank 1.5 1.6 6.67
Kotak Mahindra 1.77 1.98 11.86
Source: http://www.moneycontrol.com3, https://www.edelweiss.in4
(Calculated and Presented by researcher)
Table no. 4 Comparison of Return on Assets of Indian Banks
Bank 2010- 2011 ROA 2014-15 ROA Change in ROA (%)
Public Sector Banks Private Sector Banks All Major Banks Public Sector Banks Private Sector Banks All Major Banks Public Sector Banks Private Sector Banks All Major Banks Average 1.11 1.58 1.32 0.48 1.85 1.10
-54.58 18.05 -21.57 Standard
Deviation 4.34 1.50 0.34 1.63 2.53 0.75 Calculated by researcher
It is observed that ROA of public sector banks is decreases from 1.11 to 0.48% whereas ROA of major private sector banks of India is increases from 1.58 to 1.85 % within the study span. High standard deviation in ROA values of major public sector banks (in 2010-11) shows that, variability of ROA situation which decrease in 2014-15. We can say that the rate of ROA is more uniform in Public sector banks than the Private sector banks in 2014-15.
The correlation between the Net NPA (2010-11 and 2014-15) of both the public sector and private sector banks and their ROA of those respective years is given in table no. 5
Table No.5 Correlation between NPA and ROA of Major Indian Banks
All Major Banks Public Sector Banks Private Sector Banks Correlation between NPA
and ROA 2011 -0.69 -0.64 -0.32
Correlation between NPA
Above table shows that ROA of Public sector Banks is moderately and negatively correlated with NPA. Means as the NPA increases the ROA of these banks is decreases. The situation is almost same in case of Private sector banks in 2010-11 but correlation is low. In next 4 years Private sector Banks degree of NPA and ROA correlation change (-0.32 to 0.31) where as this correlation value decrease in case of Public sector banks (from -0.64 to -0.41). It is indicating that the correlation of ROA on NPA is lowering.
Conclusion:
NPA of Major Indian Banks is increased in the study period of 4 years.
NPA increase rate is high in major Public sector banks than the major private sector banks.
NPA is affecting the ROA of Major Indian Banks.
The effect of increasing NPA on ROA is more intense for Major Indian Public sector Banks
Recommendation:
1. To improve the banks’ ability to manage their non-performing assets (NPAs) and restructured accounts in an effective manner and considering that almost all branches of banks have been fully computerized, the Reserve bank of India in its Monetary Policy Statement 2012-13 proposed the following measures:
2. To mandate banks to put in place a robust mechanism for early detection of signs of distress, and measures, including prompt restructuring in the case of all viable accounts wherever required, with a view to preserving the economic value of such accounts; and
3. To mandate banks to have proper system generated segment–wise data on their NPA accounts, write-offs, compromise settlements, recovery and restructured accounts.2
4. Recruitment of highly expert people on higher level post in public sector banks should be implemented.
5. Measures should be taken for Efficient and fast recovery of bad loans. First of all care should be taken at the time of sanction of the loans.
References:
http://www.investopedia.com/terms/r/returnonassets.asp, (retrieved on 25.12.2015)
http://www.isesec.com/Admin/Research/1659808644_Indian%20Banking%20Industry.pdf, (retrieved on 26.12.2015)
http://www.moneycontrol.com(retrieved on 26.12.2015)
https://www.edelweiss.in
https://en.wikipedia.org/wiki/Return_on_assets (retrieved on 25.12.2015)
Mohaideen Mohammad - https://www.quora.com/Why-is-the-percentage-of-non-performing-assets-NPA-more-in-PSBs-than-the-private-banks-What-steps-should-the-government-take-to-curb-NPAs, (retrieved on 24.12.201)