Journal of Pain Research
A study of longitudinal data examining
concomitance of pain and cognition
in an elderly long-term care population
Allison H Burfield1
Thomas TH Wan2
Mary Lou Sole3
James W Cooper4
1Gerontology Program, School of Nursing, College of Health and Human Services, University of North Carolina, Charlotte, NC, USA; 2Health Services, Administration, and Medical Education, Director, Doctoral Program in Public Affairs, Associate Dean for Research, College of Health and Public Affairs, 3College of Nursing, University of Central Florida, Orlando, FL, USA; 4College of Pharmacy, University of Georgia, Athens, GA, USA
Correspondence: Allison H Burfield School of Nursing, College of Health and Human Services, University of North Carolina, 9201 University City Blvd, Charlotte, NC 28223-0001, USA Tel +1 11 704 687 7966 Fax +1 11 704 687 6017 Email [email protected]
Purpose: To examine if a concomitant relationship exists between cognition and pain in an elderly population residing in long-term care.
Background/significance: Prior research has found that cognitive load mediates interpretation of a stimulus. In the presence of decreased cognitive capacity as with dementia, the relationship between cognition and increasing pain is unknown in the elderly.
Patients and methods: Longitudinal cohort design. Data collected from the Minimum Data Set-Resident Assessment Instrument (MDS-RAI) from the 2001–2003 annual assessments of nursing home residents. A covariance model was used to evaluate the relationship between cognition and pain at three intervals.
Results: The sample included 56,494 subjects from nursing homes across the United States, with an average age of 83 ± 8.2 years. Analysis of variance scores (ANOVAs) indicated a sig-nificant effect (P , 0.01) for pain and cognition, with protected t test revealing scores decreasing significantly with these two measures. Relative stability was found for pain and cognition over time. Greater stability was found in the cognitive measure than the pain measure. Cross-legged effects observed between cognition and pain measures were inconsistent. A concomitant relation-ship was not found between cognition and pain. Even though the relationrelation-ship was significant at the 0.01 level, the correlations were low (r # 0.08), indicating a weak association between cognition and pain.
Conclusion: Understanding the concomitance of pain and cognition aids in defining additional frameworks to extend models to include secondary needs, contextual factors, and resident outcomes. Cognitive decline, as with organic brain diseases, is progressive. Pain is a symptom that can be treated and reduced to improve resident quality of life. However, cognition can be used to determine the most appropriate method to assess pain in the elderly, thereby improving accuracy of pain detection in this population.
Keywords: cognitive impairment, Cognitive Performance Scale (CPS), Minimum Data Set 2.0
Introduction
Pain control is a primary concern across all care settings. Though a universal care concern, pain is frequently viewed in the elderly as a normal process of aging.1 It is
estimated that 49%–83% of the 1.8 million residents in long-term care have acute or chronic pain, yet the recognition and treatment of pain still presents a challenge.2–6
Recognizing a spectrum of pain behaviors beyond the traditional self-reporting methods, and increasing this knowledge among clinicians and support staff, is still a significant challenge in the provision of care to the elderly.
Predominantly, pain and cognitive decline often coexist in the elderly, with approximately 47% of residents in nursing homes having a diagnosis of dementia.2
Dove
press
O R i G i N A L R E S E A R C H
open access to scientific and medical research
Open Access Full Text Article
Journal of Pain Research downloaded from https://www.dovepress.com/ by 118.70.13.36 on 24-Aug-2020
For personal use only.
Number of times this article has been viewed
This article was published in the following Dove Press journal: Journal of Pain Research
Pain assessment and treatment is complex, because residents have varying degrees of cognitive function, complicating how their needs are communicated. When these symptoms do coexist, little is known about the interaction of pain and cognitive decline, beyond laboratory imaging of the brain from a pathophysiological perspective.7,8 Empirical studies
both support and refute poor neurocognitive performance in conjunction with increased pain intensity.9–13 Evaluating
longitudinal data to assess if a relationship exists between pain and cognitive decline may assist in addressing these ambiguous findings.
The aim of this research was to examine if concomitance exists between cognition and pain in the elderly residing in long-term care.
Research questions
In a sample of nursing home residents,
1. Is cognitive decline a predictor of increased pain? 2. Is increasing pain a predictor of cognitive decline?
Research evaluating the theoretical constructs of pain and its contributing factors is lacking. Theoretical model-ing usmodel-ing clinical data is a method used to evaluate resident characteristics and symptoms for inter-relationships between variables. Modeling whether chronic pain leads to worsening or declining cognition, thereby contributing to worsened pain, would test the theoretical constructs of this relationship. The significance and correlation of these variables creates a foun-dation for building additional models, with secondary needs and resident outcomes. Long-term unresolved pain may lead to secondary symptoms and comorbidities. Information of the relationship between pain and cognition adds to an under-standing of how resident outcomes occur, and how quality initiatives can be approached. These items are all fundamental to determine if resident care needs are being met.
Significance
Evaluating cognition in conjunction with pain helps clarify if treating either symptom lessens the severity of the other, or if the symptoms are independent. Organic brain disorders cause a progressive process of cognitive decline.14 If it is
not possible for patients to regain a normal level of cogni-tive function, then the process is degeneracogni-tive. Pain may add to and/or potentiate symptoms of cognitive decline. Understanding the relationship between cognition and pain establishes how these two variables could be included in a theoretical framework. This enables resident outcomes to be more accurately measured through symptoms and treatments, determining the most effective and cost-conscious actions.
If pain and cognition were parallel to and not antecedent of each other, a symptom model would be inaccurate, making it difficult to determine where and what symptoms could be treated. Neglecting to include variables as a predictor of the other yields an incomplete clinical picture and theoretical model, making it difficult to find and measure care solutions because the root causes were not fully described.
Understanding the clinical pathways and interrelation-ships of resident symptoms is essential to the strategic planning and prioritizing of resident care needs. Resource allocation in a struggling Medicare-funded system is a dif-ficult process to navigate. A new National Institutes of Health (NIH) nursing home rating system incorporates pain as a quality measure, previously neglected in long-term resident care assessments.15,16 Staff assessments, resident nonverbal
cues, verbal complaints, facial expressions, and protective body movements were added as additional assessment items to more fully convey pain in this population. The use of federally-mandated resident assessment surveys is a cost-effective, time-efficient tool to gain insight into resident care needs, and an opportunity to increase our understanding of resident symptom pathways and the effectiveness of inter-ventions used. Using existing clinical data to test theoretical constructs adds valuable information to the validity of the models posited against real world, resident care data.
Background
Pain is an intricate sensory experience involving physiologi-cal, pathologiphysiologi-cal, social, cognitive, and emotional factors.17,18
Sensory process is modulated by cognitive load.19–22 Cognitive
load helps to describe how hard it is for the individual to make sense of a stimulus. Cognitive decline is progressive and may manifest as symptoms of aphasia (language), apraxia (perform directed acts), agnosia (recognize objects), and/or disturbances in global functioning (planning, organizing, sequencing, and abstract thoughts). Considerable issues exist in the detection of pain in residents with moderate-to-severe cognitive impairment. A lower incidence of pain is reported as cognition declines, largely due to measurement and com-munication issues.23,24 The detection of pain behavioral cues
by both formal and informal caregivers have marked differ-ences depending on the resident’s cognitive status, especially with the interpretation of body movements.25
A case report presented by Ashpole and Katz17 described
a patient with a lifelong history of pain (somatoform pain disorder). The patient’s refractory pain was unresolved, caus-ing daily verbal complaints of discomfort. After the onset of dementia, the patient’s self-reports of pain sharply declined.
Dovepress Burfield et al
Journal of Pain Research downloaded from https://www.dovepress.com/ by 118.70.13.36 on 24-Aug-2020
The pain symptoms were posited to be presenting as an altered mood (eg, depression or irritability) and cognitive decline. Chronic pain is attributed to increased risk of depres-sion in the elderly.26–29 Depressive symptoms are linked to
decreased processing and motor function, but are not directly attributable to memory impairment.30 Chronic pain results
in changes to the resident’s personality, social interactions, lifestyle, and functional status, impacting their quality of life.27 Unresolved pain may result in a decline of the resident’s
quality of life causing delirium, depression, weight loss, social isolation, decreased activities of daily living, impaired gait, increased incidence of falls and comorbidities. Quality of life declines with chronic untreated pain, especially as the intensity of pain increases.27 To date, the relationship between
cognition and pain has been evaluated in case reports and pathophysiological studies, but not as a large-scale analysis of concomitance.
Theoretical framework
The concept of need-driven behaviors31 and the framework
extending this model to include the consequences of need-driven, dementia-compromised behaviors32 serves as the
theoretical platform for this research study. The need-driven behavior, ie, pain, is a coexisting symptom to cognitive state, a background factor. Proximal issues, eg, a decline in physi-cal state and social and environmental causes, precipitate improvement or exacerbation of the original need: resolving the resident’s pain.
The long-term consequence of unresolved, need-driven behaviors gives rise to additional behavioral symptoms and secondary unmet needs. The primary relationship between cognition and pain has been evaluated for this study. Future theoretical constructs, including the complete model, would further evaluate the relationship of secondary needs (ie, depres-sion, weight loss, social isolation, higher risk of falls, decreased activities of daily living, impaired gait), and how appropriate interventions mitigate the occurrence of secondary needs. Appropriate interventions to primary needs could improve resi-dent quality of life, use healthcare resources more efficaciously, and reduce staff burden. This theoretical framework enables the clinician to translate a complex system encompassing such factors as resident, caregiver, environment, and outcomes, into a measurable tool to improve care.
Methods
Design and sample
A longitudinal cohort design was used. Data were collected from 2001–2003 (inclusive) on residents residing in
Medicare-receiving nursing homes across the United States. Minimum Data Set (MDS) 2.033 annual assessments were used
as the data source, including all residents aged $65 years. Comatose residents were excluded from the sample, because key item sections (Sections B–F) could not be scored. These items are required for the pain index instru-ment used in this study. Noncompletion of the cogni-tive, communications/hearing, mood and behavior, and psychosocial well-being sections of MDS adheres to the instructions given to assessors completing the resident assessment forms.
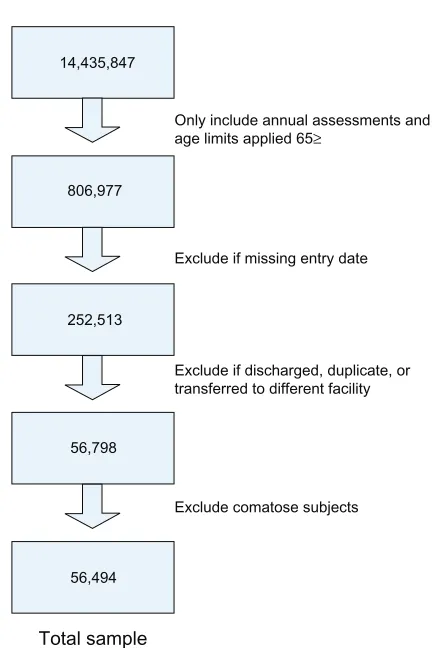
Data were extracted from a deidentified resident data-base containing the MDS items. The sample yielded 56,494 subjects (see Figure 1 for sample methods). The University of Central Florida Institutional Review Board (IRB) assigned an exempt status to the study. Data collection was retrospective and no interventions were tested.
instruments
The MDS is a nationally required assessment providing infor-mation on the quality of care provided in nursing homes.16
Only include annual assessments and age limits applied 65≥
14,435,847
806,977
252,513
56,798
56,494
Exclude if missing entry date Total subject assessments
Exclude comatose subjects
Total sample
Exclude if discharged, duplicate, or transferred to different facility
Figure 1 Sample method.
Dovepress Pain and cognition concomitance in an aged long-term care population
Journal of Pain Research downloaded from https://www.dovepress.com/ by 118.70.13.36 on 24-Aug-2020
Core items from the MDS instrument are used for care planning to trigger events or symptoms requiring interven-tion (eg, pressure ulcers, delirium, cognitive loss, falls, and mood state). Pain is not a care-planning trigger from the Resident Assessment Protocol (RAP) however, it is a quality measure.33 MDS items have demonstrated
good-to-excellent validity and reliability34–36 with interrater and
test–retest reliability from 0.40–0.80, depending on the item section.34 A composite score was used to detect pain
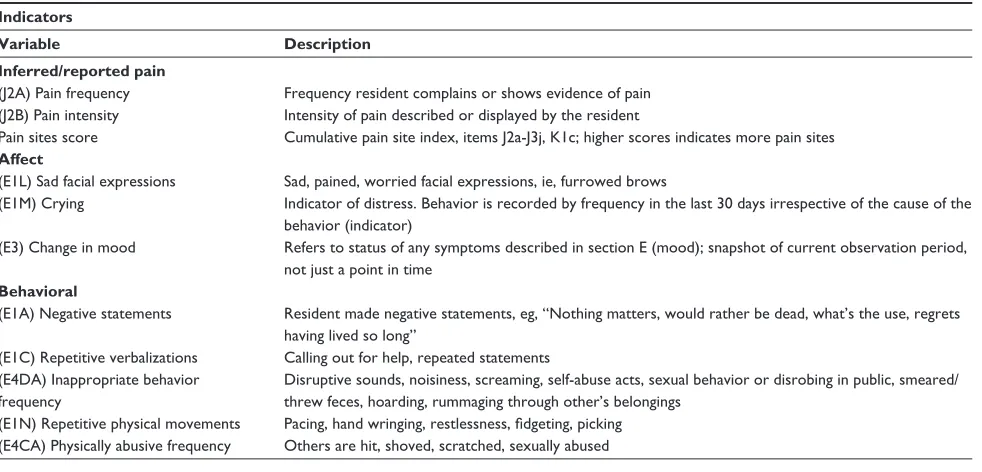
from core MDS items (pain items analyzed are detailed in Table 1).
The significance (P = 0.01) and validity of the measures used in the pain index have been established in a previous pilot study.24 Pain scores could range from 0–34. Score
weighting is determined by the ordinal scoring used in the MDS instrument. The pain index includes Fries’ pain scale37
(PS) items (eg, J2a for pain frequency and item J2b, pain intensity). The PS items highly correlated with a pain sites summary score.24 Additional dimensions of affective and
behavioral items are also included to aid in detecting pain across cognitive states (Figure 2).
The Cognitive Performance Scale (CPS) was used to determine resident cognitive state. The CPS instrument uses key MDS items from sections B, C, and G of the resident assessment form.38,39 The CPS measure correlates highly
(r $ 0.70) with the Folstein Mini-Mental Status Examination (MMSE).40 The MDS-derived CPS scores were converted to
MMSE average totals. The averaged scores could range from
Table 1 Pain score items
Indicators
Variable Description Inferred/reported pain
(J2A) Pain frequency Frequency resident complains or shows evidence of pain (J2B) Pain intensity intensity of pain described or displayed by the resident
Pain sites score Cumulative pain site index, items J2a-J3j, K1c; higher scores indicates more pain sites Affect
(E1L) Sad facial expressions Sad, pained, worried facial expressions, ie, furrowed brows
(E1M) Crying indicator of distress. Behavior is recorded by frequency in the last 30 days irrespective of the cause of the behavior (indicator)
(E3) Change in mood Refers to status of any symptoms described in section E (mood); snapshot of current observation period, not just a point in time
Behavioral
(E1A) Negative statements Resident made negative statements, eg, “Nothing matters, would rather be dead, what’s the use, regrets having lived so long”
(E1C) Repetitive verbalizations Calling out for help, repeated statements (E4DA) inappropriate behavior
frequency
Disruptive sounds, noisiness, screaming, self-abuse acts, sexual behavior or disrobing in public, smeared/ threw feces, hoarding, rummaging through other’s belongings
(E1N) Repetitive physical movements Pacing, hand wringing, restlessness, fidgeting, picking (E4CA) Physically abusive frequency Others are hit, shoved, scratched, sexually abused
0.04 (severe impairment) to 24.9, an intact cognitive state. A CPS score of 6 converts to an average MMSE of 0.4, a 3 to 15.4, and 0 to an MMSE of 24.9.38 In validation testing of
the CPS scores against the MMSE, a sensitivity of 0.94 and specificity of 0.94 were shown,40 indicating that the utility
of this instrument is viable in determining resident cognitive status from MDS-derived scores.
Statistical analysis
Descriptive statistics, correlations and repeated measures analyses of variance (ANOVAs) were completed using SPSS software (v 14.0; SPSS Inc, Chicago, IL). The SPSS statisti-cal modeling program, AMOS (v 6.0; SPSS Inc), was used to build the covariance model of pain and cognitive state at three different time intervals for 2001, 2002, and 2003. Pain and cognition scores were hypothesized to be inversely related. Increasing pain score items indicated higher levels of pain. Cognitive decline was noted with a lower MMSE score. The analyses are one-tailed.
The covariance model was evaluated for integrity-of-fit statistics; however, the model is simplistic, with only six dis-crete measures and five residual terms, so fit statistics would indicate a recently identified model. Due to the required large sample size to run structural equation modeling, assessment of statistical power is complex.41,42 Sample size
require-ments generally are the number of free parameters (n = 17) times five to ten, to estimate sample size. The sample total (n = 56,494) far exceeds this rule.
Dovepress Burfield et al
Journal of Pain Research downloaded from https://www.dovepress.com/ by 118.70.13.36 on 24-Aug-2020
d2 d1
d3
1
1
1
1 Affect
PAIN
Behavioral
Inferred pain
Figure 2 Pain construct.
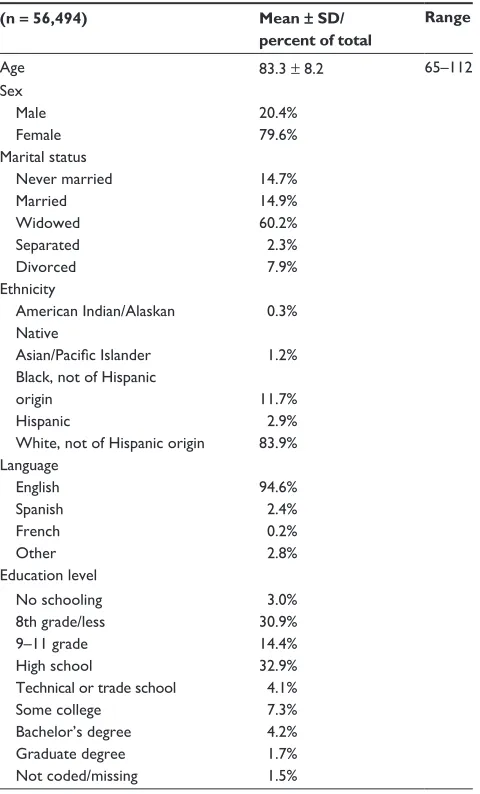
Table 2 Demographic of resident characteristics
(n = 56,494) Mean ± SD/ percent of total
Range
Age 83.3 ± 8.2 65–112
Sex Male Female
20.4% 79.6% Marital status
Never married Married Widowed Separated Divorced
14.7% 14.9% 60.2% 2.3% 7.9% Ethnicity
American indian/Alaskan Native
Asian/Pacific islander Black, not of Hispanic origin
Hispanic
White, not of Hispanic origin
0.3% 1.2% 11.7% 2.9% 83.9% Language
English Spanish French Other
94.6% 2.4% 0.2% 2.8% Education level
No schooling 8th grade/less 9–11 grade High school
Technical or trade school Some college
Bachelor’s degree Graduate degree Not coded/missing
3.0% 30.9% 14.4% 32.9% 4.1% 7.3% 4.2% 1.7% 1.5%
Table 3 Diseases/events with potential pain symptoms
Disease Number from total (n = 56,494)
Percent of total
Diabetes 11,885 21.0%
Peripheral vascular disease 6459 11.4%
Arthritis 19,013 33.7%
Complaint of joint pain 8018 14.2%
Hip fracture 2181 3.9%
Multiple sclerosis 447 0.8%
Emphysema/chronic obstructive pulmonary disease
7021 12.4%
Cancer 3031 5.4%
Renal failure 1382 2.4%
Pneumonia 498 0.9%
Respiratory infection 1277 2.3%
Septicemia 31 0.1%
Tuberculosis 20 0.0004%
Urinary tract infection 2865 5.1%
Wound infection 295 0.5%
Table 4 Longitudinal chart of the cognitive and pain scores
Cognitive status 2001 2002 2003 CPS mean score 2.9 ± 1.8 3.0 ± 1.9 3.2 ± 1.9 MMSE mean score 14.5 ± 7.8 13.7 ± 8.1 12.8 ± 8.3
intact 13.6% 12.2% 10.4%
Mild 26.7% 24.4% 22.2%
Moderate 29.4% 29.0% 28.4%
Severe 30.3% 34.3% 39.0%
Average Pain Score 2.4 ± 2.9 2.34 ± 2.8 2.18 ± 2.8
Mode 0 0 0
Range (Possible range 0–34) 0–26 0–20 0–22 No pain symptoms reported 42.0% 43.0% 45.0% Abbreviations: CPS, Cognitive Performance Scale; MMSE, Mini-Mental State Examination.
Results
Select MDS items were collected on 56,494 subjects with a mean age of 83 years. In total, 80% of the sample was female, and 84% Caucasian. Table 2 shows the study demographics.
The most prevalent diagnosis was arthritis (33.7%) with 14.2% of the sample complaining of joint pain at the first data collection (Table 3).
Over the 3-year period, the diagnoses of arthritis increased by 8%, and recorded joint pain dropped to 11.3%. Cognitive state did not fluctuate over the three measures observed. Cognition declined slightly over the 3-year period, as did pain (Table 4).
The majority of the sample, 60%–67%, was moderately-to-severely cognitively impaired. A one-way repeated mea-sure ANOVA was calculated for cognition and pain. Each variable compared subject scores at three different time intervals: 2001, 2002, and 2003. A significant effect was found for cognition (F(2,112986) = 5949.23; P , 0.01) and pain (F(2,112986) = 271.82; P , 0.01). Significant ANOVAs require a post-hoc analysis. Follow-up protected t-test with repeated measures was used, because of limitations of
Dovepress Pain and cognition concomitance in an aged long-term care population
Journal of Pain Research downloaded from https://www.dovepress.com/ by 118.70.13.36 on 24-Aug-2020
SPSS software to run a post-hoc analysis for within-subject factors.43 A protected t-test between each measure inflates
the risk of Type I errors, so a significance level of 0.017 was used (0.05/3 measures) instead of 0.05. The follow-up protected t-test revealed that scores decreased significantly (P , 0.017) for cognition1 (mean [M] = 14.5, standard deviation [SD] = 1.80), cognition2 (M = 13.7, SD = 8.1), and cognition3 (M = 12.8, SD = 8.3), and decreased significantly (P = 0.017) for pain1 (M = 2.4, SD = 2.9), pain2 (M = 2.34, SD = 2.8), and pain3 (M = 2.18, SD = 2.8).
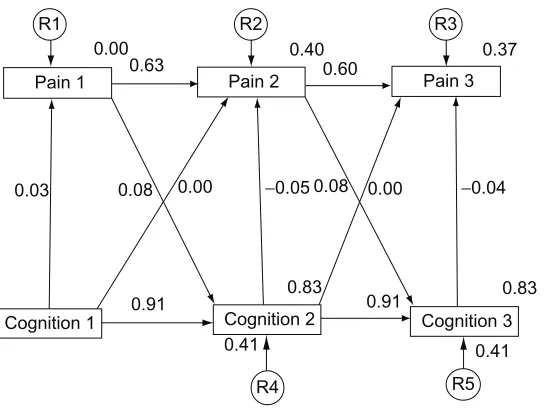
Regression weights of 1 were assigned to each residual variable. A residual term was not attached to Cognition1 (Figure 3), because there was no predictor for these variables.
The covariance models indicate pain (1–3) and cognition (1–3) measurements were stable over time with previous measures being a good predictor of subsequent measures. Higher stability was observed with the cognitive measure than with the measure of pain. The cross-legged effect of both cognitive and pain measures was inconsistent. Very little association was found between cognition and pain variables, regardless of the time interval. A concomitant relationship was significant (P , 0.01), but the associa-tions were weak and ranged from absolute values of 0.03 to 0.08 (Table 5).
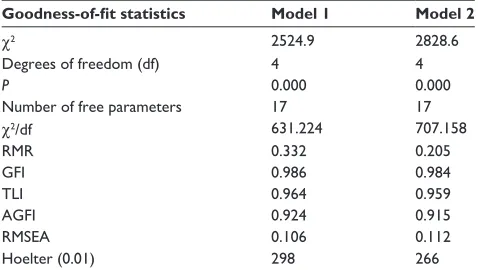
Model 1 depicts cognitive decline as a predictor of increased pain, and Model 2 represents the inverse model, increasing pain as a predictor of cognitive decline. The root-mean-square residual (RMR) is the averaged squared amount by which the sample variances and covariances differ
in their estimates.42 A smaller RMR is preferred with a value
of 0 indicating a perfect fit (see Table 6).
The goodness-of-fit index (GFI), as it approaches 1 indicates a perfect fit. The optimal values yielded by the model for the GFI, Tucker–Lewis Index, and adjusted GFI could be attributed to the simplicity of the model, even though all three were approaching 1.0.
Discussion
The sample data do not confirm the presence of concomi-tance between pain and cognition in this long-term care population. The theoretical construct does not support either measure as a predictor of the other. These findings support Kovach’s model of consequences of need-driven, compromised behaviors (C-NDB).32 Cognition (background
factor) and pain (proximal factor) exist as contributing aspects of how need-driven behaviors are manifested and communicated. Kovach’s C-NDB model serves as the tem-plate for understanding how symptoms and environmental factors interact. This system contains environmental and contextual factors, affecting both resident and care outcomes. Failing to identify resident care needs is not in isolation of the resident, but is a complex system involving clinician, support staff, environmental factors, and the resident.
MDS can be used as a reliable tool to track resident characteristics and outcomes over time. Reporting was consistent for cognition and pain over the 3-year period, and considerable fluctuations in recorded values of cogni-tion and pain did not occur. Because pain assessments were recorded annually, differences in pain would be anticipated.
R1 R2 R3
R4 R5
Pain 3 Pain 2
Pain 1
Cognition 2
Cognition 1 0.91 0.91 Cognition 3 0.41
0.00 0.00
0.08 0.08
0.03
0.00 0.40
0.60 0.37
0.83
0.41 0.83
0.63
−0.05 −0.04
Figure 3 Covariance model 1 of 3-year concomitance of cognition and pain.
Dovepress Burfield et al
Journal of Pain Research downloaded from https://www.dovepress.com/ by 118.70.13.36 on 24-Aug-2020
Table 5 Correlations
N = 56,494 Mean SD 1 2 3 4 5 6
1. Pain score 2001 2.43 2.89 1.00
2. MMSE 2001 14.51 7.88 0.028** 1.00
3. Pain score 2002 2.34 2.85 0.635** 0.056** 1.00
4. MMSE 2002 13.59 8.20 0.022** 0.912** 0.041** 1.00
5. Pain 2003 2.1 2.77 0.492** 0.073** 0.606** 0.065** 1.00
6. MMSE 2003 12.63 8.36 0.019** 0.851** 0.036** 0.913** 0.052** 1.00
Note: **Correlation is significant at the 0.01 level (one-tailed). Abbreviation: MMSE, Mini-Mental State Examination.
Table 6 Goodness-of-fit statistics of the covariance model
Goodness-of-fit statistics Model 1 Model 2
χ2 2524.9 2828.6
Degrees of freedom (df) 4 4
P 0.000 0.000
Number of free parameters 17 17
χ2/df 631.224 707.158
RMR 0.332 0.205
GFi 0.986 0.984
TLi 0.964 0.959
AGFi 0.924 0.915
RMSEA 0.106 0.112
Hoelter (0.01) 298 266
Abbreviations: AGFi, Adjusted Goodness-of-Fit index; GFi, Goodness-of-Fit index; RMR, root-mean-square residual; RMSEA, Root-Mean-Square Error of Approximation; TLi, Tucker–Lewis index.
The findings showed a gradual decline in recorded pain over the 3-year period, as cognition also declined. This raises concern, because these findings may support previous research, indicating pain is underreported and undertreated in residents with cognitive decline.44–46
Reductions in pain scores at the third interval may also be attributable to residents having less pain, or residents having received appropriate interventions for their pain. Differences in pain would be expected with recent events like fracture, surgery, or falls. Partitioning this group of residents into a separate cohort could evaluate the consistency of pain reporting, and pain measures specific to these acute events. Until clinicians and support staff increase their awareness of affective, cognitive, and behavioral indicators of pain, the reliability of MDS for pain measures will continue to be a concern.
Results suggest the importance of assessing memory function when managing physiologically distressed residents, because this information aids in determining the best methods to assess resident pain.26,47,48 Over the 3-year period, declines
in cognitive status occurred which were consistent with the progression of organic brain disease. Acute declines in cognition may be indicative of a change in mental status not
attributable to the progression of a pre-existing disease, but the onset of infection (ie, urinary tract infection, pneumonia, or sepsis), or psychiatric illness.
Further research could look at specific diagnoses and the consistency of cognitive decline and pain measures over time. Additional variables like the use of multiple medications (eg, polypharmacy), or certain classes of medications, ie, antipsychotics or hypnotics, may yield valuable information about the contributing factors to resident decline, and create an index of outcomes for pharmacoeconomic and clinical data supporting resident care guidelines and health policy reform. Supplemental theoretical modeling could evaluate latent growth models, with predictors combining pain, cogni-tion, age, sex, and facility characteristics, enabling a greater understanding of pain and cognition in the elderly beyond this concomitance study. Additionally, research examining a growth curve model, plotting parallel points in time, would provide valuable information to trends in data distribution and would clarify if the model were polynomial.
One limitation of this method – that of using scores derived only from annual assessments of cognition and pain – is that it measures only a single point in time, and does not fully capture the day-to-day variation in resident scores. A linear relationship was statistically analyzed between pain and cognition. Additional research could examine the non-linear relationship of these two variables, to determine if a nonlinear relationship exists. Additionally, composite pain scores were used to increase the ease of score totaling from individual score items, to improve the use of the pain indicators in the long-term care setting. Further research is required to examine the effect of medication use by class, and how other comorbidities influence pain measures.
A further limitation of this research was the data distribution. Normality and population distribution were unequal. The majority of the population assessed was not experiencing pain, and cognitive groups were also unequal. While the population demographics are representative of
Dovepress Pain and cognition concomitance in an aged long-term care population
Journal of Pain Research downloaded from https://www.dovepress.com/ by 118.70.13.36 on 24-Aug-2020
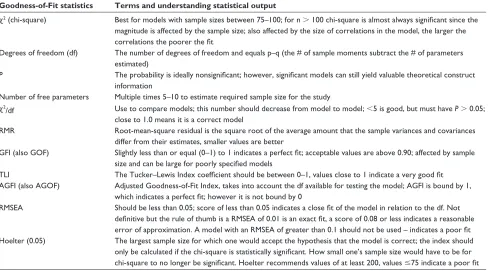
Table 7 Goodness-of-Fit statistical terms
Goodness-of-Fit statistics Terms and understanding statistical output
χ2 (chi-square) Best for models with sample sizes between 75–100; for n . 100 chi-square is almost always significant since the magnitude is affected by the sample size; also affected by the size of correlations in the model, the larger the correlations the poorer the fit
Degrees of freedom (df) The number of degrees of freedom and equals p–q (the # of sample moments subtract the # of parameters estimated)
P The probability is ideally nonsignificant; however, significant models can still yield valuable theoretical construct information
Number of free parameters Multiple times 5–10 to estimate required sample size for the study
χ2
/df Use to compare models; this number should decrease from model to model; ,5 is good, but must have P . 0.05; close to 1.0 means it is a correct model
RMR Root-mean-square residual is the square root of the average amount that the sample variances and covariances differ from their estimates, smaller values are better
GFi (also GOF) Slightly less than or equal (0–1) to 1 indicates a perfect fit; acceptable values are above 0.90; affected by sample size and can be large for poorly specified models
TLi The Tucker–Lewis index coefficient should be between 0–1, values close to 1 indicate a very good fit AGFi (also AGOF) Adjusted Goodness-of-Fit index, takes into account the df available for testing the model; AGFi is bound by 1,
which indicates a perfect fit; however it is not bound by 0
RMSEA Should be less than 0.05; score of less than 0.05 indicates a close fit of the model in relation to the df. Not definitive but the rule of thumb is a RMSEA of 0.01 is an exact fit, a score of 0.08 or less indicates a reasonable error of approximation. A model with an RMSEA of greater than 0.1 should not be used – indicates a poor fit Hoelter (0.05) The largest sample size for which one would accept the hypothesis that the model is correct; the index should
only be calculated if the chi-square is statistically significant. How small one’s sample size would have to be for chi-square to no longer be significant. Hoelter recommends values of at least 200, values #75 indicate a poor fit Abbreviations: AGFi, Adjusted Goodness-of-Fit index; GFi, Goodness-of-Fit index; RMR, root-mean-square residual; RMSEA, Root-Mean-Square Error of Approximation; TLi, Tucker–Lewis index.
R1 R2 R3
R4 R5
Pain 3 Pain 2
Pain 1
Cognition 2
Cognition 1 Cognition 3
0.63 0.60
0.77
−0.04 −0.04
0.00 0.01
−0.03
0.00 0.82
0.91 0.83
0.37
0.79 0.40
−0.90
−0.01 −0.01
Figure 4 Covariance model 2 of 3-year concomitance of pain and cognition.
nursing homes, very distinct population demographics (ie, sex, race, educational background, socioeconomic factors) limit generalizability beyond this setting. Variations in the interpretation of reliability measures between those rating the MDS sections for mood and behavior have been reported.49,50
The research was limited to the available items in MDS, and these items might not capture, define or describe all pain symptoms. Even with the further criteria added to measure pain across cognitive states, there remain dimensions of pain still to be discovered and defined.
Dovepress Burfield et al
Journal of Pain Research downloaded from https://www.dovepress.com/ by 118.70.13.36 on 24-Aug-2020
Conclusion
This research sought to ascertain whether in fact a relation-ship exists between pain and cognition, and if so, to gain pre-liminary insight into the relationship. Investigating whether cognition is a predictor of pain in a concomitant relationship helped to define how secondary patient outcomes might be mediated. Further research should be used to link cogni-tion, resident ability to communicate, and levels of pain for significance with quality of life measures like depression, disturbances in gait, weight loss, decreased activity, declines in functional status, or social isolation. In the case of most organic brain diseases, instead of returning to a normal level of cognitive functioning, a progressive decline occurs. Pain is a cycle that can be intervened upon, and symptoms can be lessened through medicinal and non-medicinal treatments, improving resident comfort. With an understanding of the role of cognition in identifying how pain is communicated, we can improve pain detection and uniformity of measures to ameliorate symptoms. The significance of confirming, theoretical frameworks with advanced multivariate analysis is an opportunity to evaluate interactions of key variables. A global assessment of concomitance between pain and cog-nition offers a unique insight towards a better understanding of the relationship of pain and cognition in a general nursing home population.
Acknowledgments
This research could not have been possible without the assistance of Seung Chun Paek, MS, PhD, Research Associate, Korean Health Insurance Corporation, Seoul, Korea, for running the dataset parameters and queries. Thank you to Drs Steven Talbert and Diane Andrews at the University of Central Florida, College of Nursing for their reviews and edits of this manuscript. This research was completed at the University of Central Florida, College of Nursing in partnership with the College of Health and Public Affairs, Orlando, Florida and funded by the UCF Provost Fellowship.
Disclosure
The authors report no conflicts of interest in this work.
References
1. Cann P. Pain in older adults should not be seen as part of ageing. Br J Community Nurs. 2008;13(12):574–576.
2. American Health Care Association. OSCAR Data Reports: Patient Characteristics. AHCA. Available at: http://www.ahca.org/research/ oscar_patient.htm. Accessed April 15, 2006.
3. Epps CD. Recognizing pain in the institutionalized elder with dementia. Geriatr Nurs. 2001;22(2):71–79.
4. Lowe S. Census Bureau releases new data on residents of adult cor-rectional facilities, nursing homes and other group quarters annual data also pain diverse portrait of nation’s race, ethnic and ancestry group. U.S. Census Bureau. Available at: http://www.census.gov/Press-Release/ www/releases/archives/american_community_survey_acs/010709. html. Accessed November 27, 2007.
5. Sawyer P, Lillis JP, Bodner EV, Allman RM. Substantial daily pain among nursing home residents. J Am Med Dir Assoc. 2007;8(3):158–165. 6. Parmelee PA, Smith B, Katz IR. Pain complaints and cognitive status
among elderly institution residents. J Am Geriatr Soc. 1993;41(5): 517–522.
7. Seminowicz DA, Mikulis DJ, Davis KD. Cognitive modulation of pain-related brain responses depends on behavioral strategy. Pain. 2004;112(1/2):48–58.
8. Bromm B. Brain images of pain. News in Physiological Sciences. 2001;16: 244–249.
9. Landrø NI, Stiles TC, Sletvold H. Memory functioning in patients with primary fibromyalgia and major depression and healthy controls. J Psychosom Res. 1997;42(3):297–306.
10. Grace GM, Neilson WR, Hopkins M, Berg MA. Concentration and memory deficits in patients with fibromyalgia syndrome. J Clin Exp Neuropsychol. 1999;21(4):477–487.
11. Iezzi T, Duckworth MP, Vuong LN, Archibald YM, Klinck A. Predictors of neurocognitive performance in chronic pain patients. Int J Behav Med. 2004;11(1):56–61.
12. Kewman DG, Vaishampayan N, Zald D, Han B. Cognitive impairment in musculoskeletal pain patients. Int J Psychiatry Med. 1991;21(3): 253–262.
13. Dufton BD. Cognitive failure and chronic pain. Int J Psychiatry Med. 1989;19(3):291–297.
14. Psychnet. Organic brain syndrome. Psychnet-UK. Available at: http://www.psychnet-uk.com/dsm_iv/organic_brain_syndrome.htm. Accessed February 18, 2009.
15. CMS to create nursing home quality new five-star system to be added to nursing home compare site. Press Releases. CMS Office of Public Affairs Available at: http://www.cms.hhs.gov/apps/media/press/ release.asp?Counter=3163&intNumPerPage=10&checkDate=&chec kKey=&srchType=1&numDays=3500&srchOpt=0&srchData=&key
wordType=All&chkNewsType=1%2C+2%2C+3%2C+4%2C+5&int
Page=&showAll=&pYear=&year=&desc=&cboOrder=date. Accessed February 9, 2012.
16. Centers for Medicare and Medicaid Services. Action plan for the further improve of nursing home quality. CMS. Available at: http://www.cms. hhs.gov/CertificationandComplianc/Downloads/2008 NHActionPlan. pdf. Accessed February 9, 2012.
17. Ashpole E, Katz B. Effect of dementia on pain: A case report. Australas J Ageing. 1997;16(2):71–72.
18. Chapman CR. The affective dimension of pain: a model. In: Bromm B, Desmedt JE, editors. Pain and the Brain: From Nociception to Cognition. New York, NY: Raven Press; 1995:283–301.
19. Kastner S, Pinsk MA, De Weerd P, Desimone R, Ungerleider LG. Increased activity in human visual cortex during directed attention in the absence of visual stimulation. Neuron. 1999;22(4):751–761. 20. Kastner S, De Weerd P, Desimone R, Ungerleider LG. Mechanisms
of directed attention in the human extrastriate cortex as revealed by functional MRI. Science. 1998;282(5386):108–111.
21. Pessoa L, Kastner S, Ungerleider LG. Neuro-imaging studies of attention: from modulation of sensory processing to top-down control. J Neurosci. 2003;23(10):3990–3998.
22. Seminowicz DA, Davis KD. Pain enhances functional connectivity of a brain network evoked by performance of a cognitive task. J Neurophysiol. 2007;97(5):3651–3659.
23. Sengstaken EA, King SA. The problems of pain and its detection among geri-atric nursing home residents. J Am Geriatr Soc. 1993;41(5):541–544. 24. Burfield AH. Cohort study of pain behaviors in the elderly residing in
skilled nursing care. Diss. University of Central Florida, 2009. Orlando, FL: ProQuest-CSA, LLC; 2010.
Dovepress Pain and cognition concomitance in an aged long-term care population
Journal of Pain Research downloaded from https://www.dovepress.com/ by 118.70.13.36 on 24-Aug-2020
Journal of Pain Research
Publish your work in this journal
Submit your manuscript here: http://www.dovepress.com/journal-of-pain-research-journal
The Journal of Pain Research is an international, peer-reviewed, open access, online journal that welcomes laboratory and clinical findings in the fields of pain research and the prevention and management of pain. Original research, reviews, symposium reports, hypoth-esis formation and commentaries are all considered for publication.
The manuscript management system is completely online and includes a very quick and fair peer-review system, which is all easy to use. Visit http://www.dovepress.com/testimonials.php to read real quotes from published authors.
25. Closs SJ, Cash K, Barr B, Briggs M. Cues for the identification of pain in nursing home residents. Int J Nurs Stud. 2005;42(1):3–12. 26. Hadjistavropoulos T, Voyer P, Sharpe D, Verreault R, Aubin M.
Assessing pain in dementia patients with co-morbid delirium and/or depression. Pain Manag Nurs. 2008;9(2):48–54.
27. Zanocchi M, Maero B, Nicola E, et al. Chronic pain in a sample of nursing home residents: prevalence, characteristics, influence on quality of life (QOL). Arch Gerontol Geriatr. 2008;47(1):121–128.
28. Leong IY, Nuo TH. Prevalence of pain in nursing home residents with different cognitive and communicative abilities. Clin J Pain. 2007;23(2):119–127.
29. Barsevick AM. The elusive concept of the symptom cluster. Oncol Nurs Forum. 2007;34(5):971–980.
30. Baune BT, Suslow T, Engelien A, Arolt V, Berger K. The association between depressive mood and cognitive performance in an elderly general population – the MEMO study. Dement Geriatr Cogn Disord. 2006;22(2):142–149.
31. Algase DL, Beck C, Kolanowski A, et al. Need-driven dementia-compromised behavior: An alternative view of disruptive behavior. Am J Alzheimer’s Dis Other Demen. 1996;11(6):12–19.
32. Kovach CR, Noonan PE, Schlidt AM, Wells T. A model of conse-quences of need-driven, dementia-compromised behavior. J Nurs Scholarsh. 2005;37(2):134–140.
33. Centers for Medicare and Medicaid Services. MDS 2.0 for Nursing Homes. CMS Available at: http://www.cms.hhs.gov/ NursingHomeQualityInits/20_NHQIMDS20.asp. Accessed June 23, 2008.
34. Won A, Morris JN, Nonemaker S, Lipsitz LA. A foundation for excel-lence in long-term care: the Minimum Data Set. Ann Long-Term Care. 1999;7(3):92–97.
35. Snowden M, McCormick W, Russo J, et al. Validity and responsiveness of the Minimum Data Set. J Am Geriatr Soc. 1999;47(8):1000–1004. 36. Lawton MP, Casten R, Parmelee PA, Van Haitsma K, Corn J,
Kleban MH. Psychometric characteristics of the Minimum Data Set II: validity. J Am Geriatr Soc. 1998;46(6):736–744.
37. Fries BE, Simon SE, Morris JN, Flodstrom C, Bookstein FL. Pain in U.S. nursing homes: validating a pain scale for the Minimum Data Set. Gerontologist. 2001;41(2):173–179.
38. Morris JN, Fries BE, Mehr DR, et al. MDS cognitive performance scale. J Gerontol. 1994;49(4):M174–M182.
39. Fries BE. New opportunities for research in cognitive aging: the National Nursing Home Resident Assessment Instrument. Division 20. American Psychological Association. Institute of Gerontology, University of Michigan. Available at: http://apadiv20.phhp.ufl.edu/fries.htm. Accessed February 9, 2012.
40. Gruber-Baldini AL, Zimmerman SI, Mortimore E, Magaziner J. The validity of the Minimum Data Set in measuring the cognitive impairment of persons admitted to nursing homes. J Am Geriatr Soc. 2000;48(12):1601–1606.
41. Kaplan D. Statistical power in structural equation models. Department of Educational Studies, University of Delaware. Available at: http://
www2.gsu.edu/∼mkteer/power.html. Accessed February 9, 2012.
42. Wan TTH. Evidence-Based Health Care Management. Boston, MA: Kluwer Academic Publishers; 2002.
43. Cronk BC. How to Use SPSS. 3rd ed. Glendale, CA: Pyrcazk Publish-ing; 2004.
44. Hutt E, Buffum MD, Fink R, Jones KR, Pepper GA. Optimizing pain management in long-term care residents. Geriatrics Aging [serial online]. 2007;10:523–527. Available at: http://www.medscape.com/ viewarticle/564630_2. Accessed November 7, 2007.
45. Tait RC, Chibnall JT. Under-treatment of pain in dementia: assessment is key. J Am Med Dir Assoc. 2008;9(6):372–374.
46. Horgas AL, Yoon SL. Pain management. In: Capezuti E, Zwicker D, Fulmer TT, Gray-Miceli D, editors. Evidence-Based Geriatric Nursing Protocols for Best Practice. 3rd ed. New York, NY: Springer Publishing Co; 2007:199–222.
47. Shega JW, Rudy T, Keefe FJ, Perri LC, Mengin OT, Weiner DK. Validity of pain behaviors in persons with mild to moderate cognitive impairment. J Am Geriatr Soc. 2008;56(9):1631–1637.
48. Horgas AL, Nichols AL, Schapson CA, Vietes K. Assessing pain in persons with dementia: relationships among the non-communicative patient’s pain assessment instrument, self-report, and behavioral observations. Pain Manag Nurs. 2007;8(2):77–85.
49. Hawes C, Morris JN, Phillips CD, Mor V, Fries BE, Nonemaker S. Reliability estimates for the Minimum Data Set for nursing home resi-dent assessment and care screening (MDS). Gerontologist. 1995;35(2): 172–178.
50. Casten R, Lawton MP, Parmelee PA, Kleban MH. Psychometric char-acteristics of the Minimum Data Set I: confirmatory factor analysis. J Am Geriatr Soc. 1998;46(6):726–735.
Dovepress
Dove
press
Burfield et alJournal of Pain Research downloaded from https://www.dovepress.com/ by 118.70.13.36 on 24-Aug-2020