Optimizing the Die Design Parameters of a Two Cavity Injection Moulding Tool for a Fan Blade Back Cover using Mold Flow Analysis
Dr. Mohammed Yunus1, Dr. Mohammad S. Alsoufi2, Mohammed Salman Mustafa3
1. Department of Mechanical Engineering, Umm Al-Qura University, Makkah, Kingdom of Saudi Arabia
2. Department of Mechanical Engineering Umm Al-Qura University, Makkah, Kingdom of Saudi Arabia
3. Department of Mechanical Engineering, KNS Institute of Technology, Bangalore, India.
ABSTRACT
For producing intricate and complex shape plastic parts with higher dimensional accuracy, injection molding method is widely used. Presently, plastic industries are under great pressure due to the globalization of the market, the short life cycle of the product, increasing diversity, the high demand of product quality, meeting requirements by adapting various advanced technologies like CAD/CAM/CAE, concurrent engineering and so on for the development of the injection molded part. The design of a mold is of high priority for product quality and economic processing and also it acts as an integral part of plastic injection molding since the quality of final plastic part is greatly reliant on injection mold. A two cavity injection molding tool design and its mold flow analysis for a given component was taken up according to the industrial specification. Polypropylene (PP) is thermoplastic material used for Fan Blade Back Cover due to its light-weight, durability, recyclable, rugged and resistant to chemical solvents. The design of tool includes the design of core insert, cavity inserts, number of cavities in the mold, type of mold, feeding system, side cores and production quantity. After thorough study and necessary calculations of the component for achieving shape, size, critical parameters, to help in proper selection of parting surface, ejection system, feeding system, selection of suitable injection molding machine based on clamping force calculation and the manufacture of mold to produce better-quality components was done. 3D virtual models are created using the Solidworks software. The 2D drawings were drafted using Auto-CAD software. The core and cavities are extracted through modeling software and Mold Flow Analysis was carried out. Complete mold design is designed after conducting the mold flow analysis and optimizing the gating and the runner design by CAE software for flow and solidification of the liquid material into the cavities. It determines the optimal combination of part geometry, material choice and processing parameters to produce quality finished parts. This work also reveals results of fill analysis, pack analysis, warp analysis and cooling analysis. Finally, based on the analysis results, the manufactured mold produced was tested for the production of final product, with precise specification of the industry requirement. The present work can also be further extended for a detailed stress and fatigue analysis for the core and cavity inserts to obtain improved tool life.
Keywords - Injection Molding, Polypropylene, Mold Die Designing Methodology, Mold Flow Analysis, CAE analysis.
1.1. INTRODUCTION
products represent more than 70% of the non-standard components in consumer products. Therefore the combined effect of minimized surface area of undercut, flatness of parting surface and minimized draw depth is considered for the determination of best parting direction, parting line and surface for a two-piece permanent molded component. The mold flow analysis for optimal gate design of thin-walled injection molding show that the gate for single point of two sides is suitable on thin-walled injection molding by numerical simulation. In plastic injection molding, they are molded by core, cavity or side-cores.
Mold designers are required to possess thorough and broad experience, because the detail decisions require the knowledge of the interaction of various parameters. Due to the lack of experienced designers, intelligent CAD tools that can assist in the various tasks of the mold design process can be used for the good productivity of mold making industry [4]. The injection molding process is used to turn plastic stock into finished products. The process involves many steps [14]:
Feeding raw material
Plasticize the raw material
Fill the mould
Pack the mould
Hold pressure
Cooling of mould
Opening of mould and Part ejection
The critical items to be considered while designing a injection mould tool are [3,4]
Shrinkage.
Selection of Parting Surface.
Number of Cavities.
Feed System.
Cooling System.
Ejection System.
Venting.
The aim of this work is to develop an intelligent CAD tool that supports EDM electrode design. The present work covers the Design, Analysis and Manufacturing of two cavity injection mold for fan blade back cover of polypropelene. The design of the tool is aimed for a high productivity and to obtain good quality of products economically.
2. METHODOLOGY
Methodology is a systematic approach for the realization of total task. It consists of the following details:
Study of Component drawing.
Component Description.
Plastic flow Analysis.
Solid modeling of the tool.
Selection of tooling materials.
Tool manufacturing, assembly and tryout.
2.1. Study of Component Drawing: This is most important and the first step for the designer. The component drawings are carefully scrutinized to extract the maximum possible amount of information available such as critical dimensions, line of draw, parting line, suitable ejection system, and required side core.
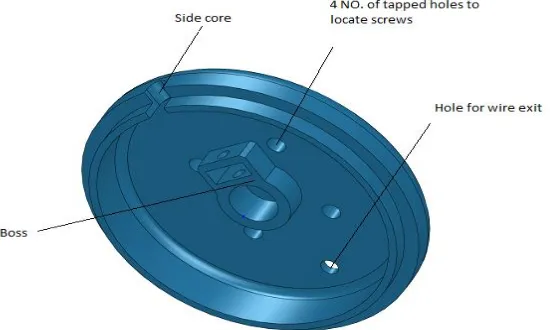
assemblies due to which the cover is designed in such a way as to ensure both the applications. There is a hole in the side surface of the component to facilitate the necessary cables for the fan motor after assembly. As per requirement a two cavity injection moulding tool is to be developed [21].
Feeding system design is simple. Conical sprue is connected along with the modified trapezoidal runners. Runner balancing is done such a way that all two cavities are filled simultaneously. Hence component shape is small and circular fan gate is used. Coming to the ejection system pin ejection system is used. Six pin ejectors are used for feeding system ejection
Figure 1. 3D View of a Fan blade back cover
2.3. Plastic Flow Analysis: Plastic flow analysis is done using Autodesk software, to know the optimum gate location, temperature distribution, fill time, air traps, weld lines etc. and also tool modeling environment used is solidworks software[22].
2.4. Solid Modeling of the Tool: Solid modeling of the tool is done using high end CAD solidworks software. The component weight, volume and surface area, projected area, etc. were determined using the same software package. This data is helpful to do design calculation. 2D – drawings of the mold parts are prepared for manufacturing purpose.
2.5. Selection of the Tooling Material: Suitable material is chosen for manufacturing of each part of the tool depending on their primary function and use. The different tooling materials used for each part of the tool is given in bill of materials.
2.6. Tool Manufacturing, Assembly and Tryout: Tool manufacturing has been done by referring 2D-drawings followed by the use of different manufacturing techniques stage by stage. After manufacturing all the tool parts the blue matching of mating parts of core and cavity has been done and the final assembling has been done. The final stage of molding is tryout stage, the tool is loaded on the injection molding machine and then samples are taken out injection molding process.[11,12]
3. MOLD FLOW ANALYSIS
The mold flow software is designed to determine the manufacturability of the plastic part design using model of a component drawn in a CAD package and it is an important analytical tool available for various analysis of injection molded components. The sequence of work involved in mold flow analysis is given under.
1. Converting the 3D model in STEP format.
3. Build the feed system such as sprue, runner and gate, cooling lines. 4. Mesh the feed system and cooling lines.
5. Run the analysis for different analysis types like fill, flow, cooling, warpage etc. 6. Study the result, interpret them.
7. Establish the optimized data for runner, gate, sprue dimensions, coolant temperature etc. 8. Incorporate this value in the design; send the optimized process setting to molding shop for trial.
When CAE is used early in the design stage the cost saving are substantial not only because of time saving, but also the avoidance of expensive and common last minute mold modifications. After the analysis we will have the following results.
1. Fill time.
2. Frozen layer fraction at end of fill result. 3. Pressure result.
4. Pressure at injection location result.
5. Pressure at velocity/pressure switchover result.
6. The weld lines and
7. Cooling analysis 8. Sink, index result.
Table 1. Processing parameters
Injection pressure 150 MPa
Recommended Melt Temperature 200°C
Recommended Minimum Mold Temperature 65°C
4. RESULTS AND DISCUSSION
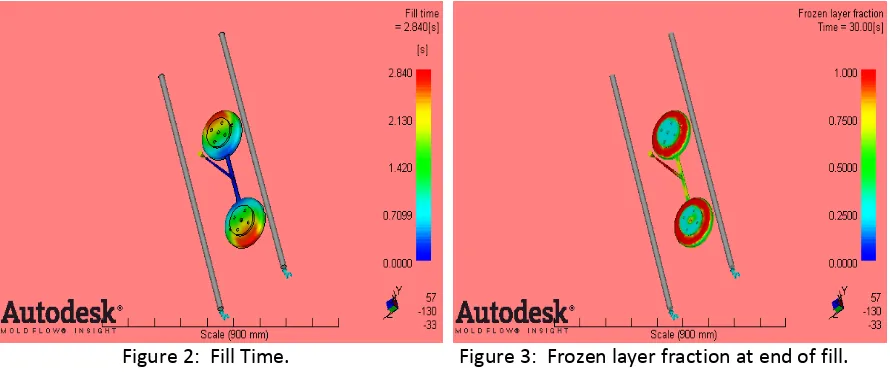
4.1. Fill Time
The Fill time result shows the position of the flow front at regular intervals as the cavity fills. Each color contour represents the parts of the mold which were being filled at the same time. At the start of injection, the result is dark blue, and the last places to fill are red. If the part is a short shot, the section which did not fill has no color as shown if figure 2. In a part with a good fill time result, the flow pattern is balanced. In a balanced fill time results we can see the following:
All flow paths finish at the same time. The flow fronts should reach the extremities of the model at the same time. This means that each flow path should end with red contours.
The contours are evenly spaced. The contour spacing indicates the speed at which the polymer
is flowing. Widely-spaced contours indicate rapid flow, while narrow contours indicate that the part is filling slowly.
Short shot: On the Fill time result, a short shot will appear as translucent. Check the ends of the flow paths for any translucent areas. For models analysed using 3D analysis technology, you can also use the unfilled cavity result to see if there are any unfilled sections in the interior of the part.
Over packing: If a Fill time result shows that one flow path finishes before others do, it may indicate overpacking and can cause high part weight, warpage and non-uniform density distribution throughout the part.
Weld lines: Overlay the Weld line result on the Fill time result to confirm their presence. Weld lines can cause structural and visual defects.
Air traps: Overlay the Air trap result on the Fill time result to confirm their presence. Air traps can cause structural and visual defects.
4.2. Frozen Layer Fraction at End of Fill
The Frozen layer fraction at end of fill result represents the thickness fraction of the frozen layer at the end of filling as shown in figure 3. It ranges from 0.0 to 1.0. A higher value indicates a thicker frozen layer (or thinner flow layer) and higher flow resistance. A polymer is considered frozen when the temperature falls below the transition temperature. Frozen-layer fraction has very significant effects on the flow resistance. The viscosity exponentially increases with decreasing temperature. The thickness of the flow layer is also reduced as the thickness of the frozen layer increases. The effect of the thickness reduction can be roughly estimated with the definition of fluidity, as with representative shear rate. The fluidity is proportional to the cubic power of the part thickness. A 50% reduction in part thickness reduces the fluidity by a factor of eight (or increases the flow resistance by a factor of eight). Moreover, a 50% reduction in thickness in runners reduces the fluidity by a factor of 16. It is not surprising that excessive high pressure is required to fill parts in which hesitation occurs early in the filling stage. The flow layer becomes very thin in areas of hesitation, which are filled last. The frozen layer fraction generally will be very low near the injection location and the end of fill. The maximum frozen layer fraction at the end of fill should be less than 0.20–0.25. Higher values will make the part difficult to pack out. Areas of the mold that are filled early in the cycle, but have little subsequent flow, normally have the highest frozen layer fraction. None of the part should have a frozen layer fraction higher than 0.20–0.25 at the end of fill. A faster injection time will reduce the frozen layer fraction. Time to reach ejection temperature result. If hot spots are occurring, look for ways to change the cooling circuit design.
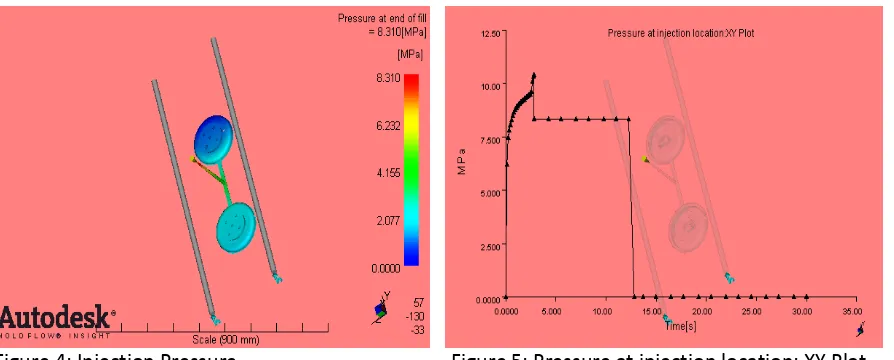
4.3. Pressure
Figure 4: Injection Pressure. Figure 5: Pressure at injection location: XY Plot
4.4. Pressure at Injection Location
The Pressure at injection location result shows the pressure at the injection location at various times during the filling and packing phases of the analysis as shown in figure 5. All of the injection locations on the model will have the same pressure. This is an assumption used in the analysis. The Pressure at injection location result is very useful for checking whether there are any pressure spikes, which is normally a sign of imbalance. This could be within a part or between parts. If it is within a part, normally this could be fixed by changing gate location(s). Sometimes only a subtle change is necessary. The Pressure at injection location result is an XY plot generated from Fill and Microchip Encapsulation analyses. A significant change in the slope of the pressure curve, during the filling phase, indicates a change in the pressure gradient in the part. Often this is caused by a flow imbalance within a part or for multi-cavity models between parts. Review the fill time result and other pressure results for balance problems. The packing profile is shown with this result. The default packing profile uses 80% of the pressure at switch over for 10 seconds. On this result, the pressure will drop instantaneously 20% then the line will be horizontal for 10 seconds. This result can also be used to ensure the packing profile is correct.
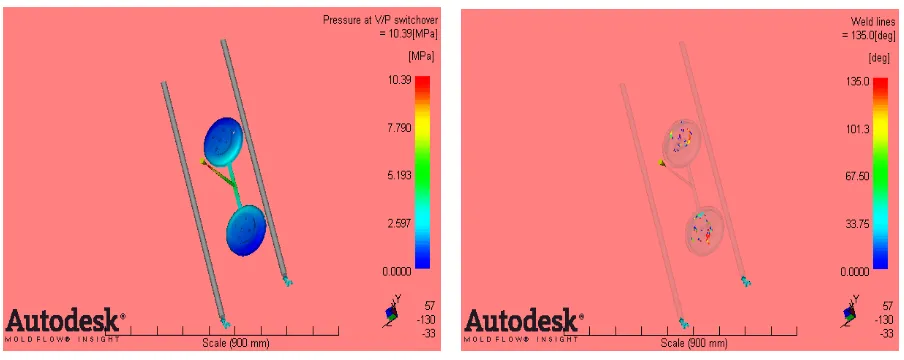
4.5. Pressure at Velocity/Pressure Switchover
Figure 6: Pressure at V/P Switchover. Figure 7: Weld lines
4.6. Weld Lines
The Weld Lines result in figure 7 displays the angle of convergence as two flow fronts meet. The presence of weld lines may indicate a structural weakness and/or a surface blemish. The term weld line is often used to mean both weld and meld lines. The only difference between a meld line and weld line definition is the angle at which they are formed. Weld lines are formed at lower angles. Weld lines can cause structural problems, and they can also make the part visually unacceptable. Therefore weld and meld lines should be avoided if possible. However, weld lines are unavoidable when the flow front splits and comes together, around a hole, or has multiple gates. Look at the processing conditions and the weld line position to decide if the weld lines will be of a high quality. Avoid weld lines in areas which need strength, or which need to appear smooth.
4.7. Cooling Analysis
This topic specifies the results generated by a Cool analysis using a thermoplastic material without fiber or filler content. The Cool analysis contains the change in coolant temperature from coolant-in to coolant-out.
4.7.1. Circuit heat removal efficiency
Figure 8: Circuit heat removal efficiency Figure 9: Circuit coolant temperature
4.7.2. Circuit coolant temperature
The Circuit coolant temperature result shows the temperature of the coolant inside the cooling circuit(s) as shown in figure 9. The Cool analysis log contains the change in coolant
temperature from coolant-in to coolant-out. If the increase is unacceptable, (greater than 2–3°C), use the circuit coolant temperature result to determine where the greatest increase in temperature occurs. In parallel circuits, the final increase in coolant temperature from coolant-in to coolant-out may be small. However, the coolant may have reached a high temperature in some sections of the cooling lines. The outcome of this analysis when coolant flows through one line shows that
temperature of the coolant increases mixes with low temperature coolant and coolant leaves the circuit.
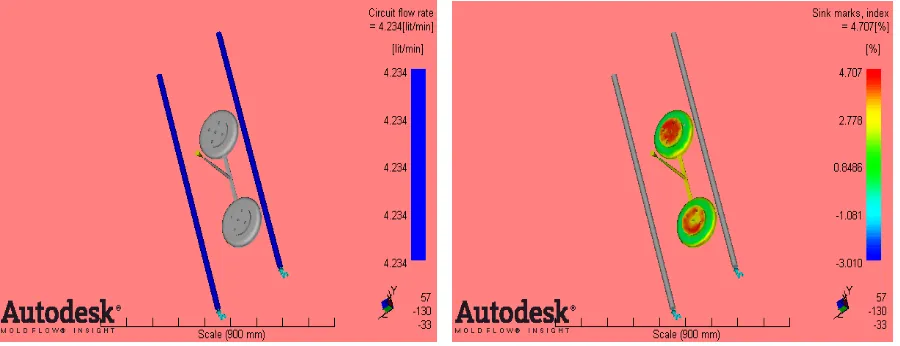
4.7.3. Circuit flow rate
The Circuit flow rate result shows the flow rate of the coolant inside the cooling circuit(s).This is shown in figure 10. Use this result if you have set a minimum Reynolds number. This result is to determine if the flow rate required achieving turbulent coolant flow.
Figure 10: Circuit flow rate Figure 11: Sink marks
4.7.4. Sink marks, index
packing stage, and reflects how much material is still melt and left unpacked. Higher Sink marks, index value shows higher potential shrinkage. However, whether or not the shrinkage would result in sink mark depends on geometry characteristics. The Sink marks, index generated indicates the likely presence and location of sink marks (and voids) in the part. This is shown in Figure11. The Sink marks, index indicates a degree of severity of depth as affected by the material, part geometry, position relative to the injection location and mold filling conditions. Changing any of these would allow you to determine its contribution to the sink marks severity. Generally, if the thickness of a rib is less than or equal to 60% of the main wall section, then there are likely to be no significant sink marks. The parameters observed from mold flow analysis are shown in the following table 2.
Table 2. Design parameters observed at different locations in mold flow analysis
Finally after rectification the components produced are as per customer’s specification.
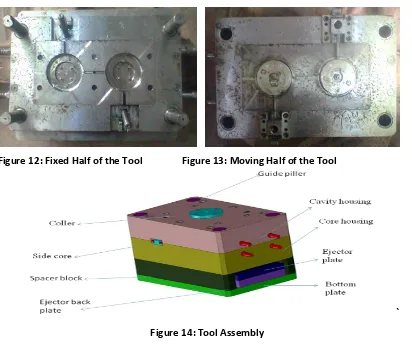
Figure 12: Fixed Half of the Tool Figure 13: Moving Half of the Tool
`
Figure 14: Tool Assembly Fill time(Sec)
At Sprue At runner At gate At cavity
0.032 0.709 1.420 2.840
Pressure(Mpa) 8.310 4.155 2.077 1.091
Weld lines(deg) Red Yellow Green Blue
135 101.3 67.50 33.75
Coolant temperature(C) 25.30 25.23 25.16 25.08
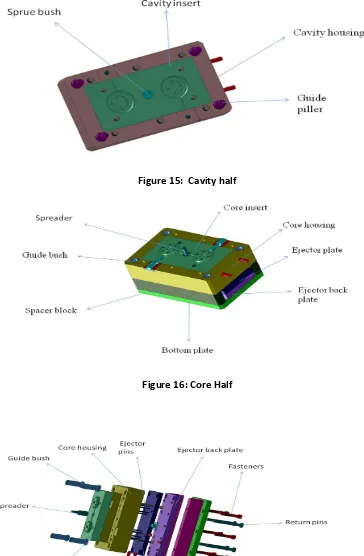
Figure 15: Cavity half
Figure 16: Core Half
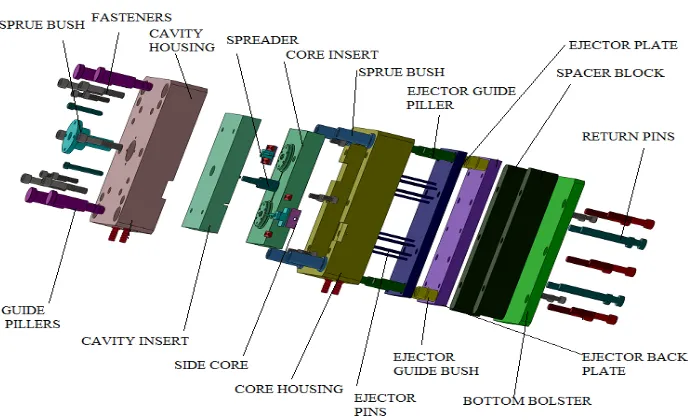
Figure 18: Exploded view of Mould
5. CONCLUSION
REFERENCES:
[1] Haddout, A. and Villoutreix, G., An experimental study of fiber orientation in injection
moulded short glass fiber reinforced polypropylene/ polyarylamide composites (Conservatoire National des Artset M6tiers, France), pp.147-153, 1992.
[2] J.A. Brydson, Plastic materials, British Cataloging sixth edition, 1995, Butterworth Heinemann Ltd.
[3] Bown, J, Injection Moulding of Plastic Components, McGraw-Hill, 1979.
[4] Dr.J. Fazlur Rahman, Dr.Mohammed Yunus, Mohammed Irfan, Tajuddin Yezdani,T.M.,
Optimizing the Die Design Parameters for FRP Components Produced in Injection Molding using Mold Flow Analysis, International Journal of Engineering Research and Applications (IJERA) ISSN: 2248-9622, Vol. 2, Issue4, pp.2103-2111, July-August 2012.
[5] Dym, J.B, Injection Moulds and Moulding, Van Nostrand Rheinhold, 1979.
[6] RJ Crawford, Plastic Engineering, Maxwell Macmillan International edition Publication.
[7] Technical paper by Johanna Lamminmäki, Totti Lindgren, Jukka Silén and Heli Vesanto,
Influence of injection molding process parameters on mechanical properties of polypropylene-specimen.
[8] Dominick V. Rosato and Donald V. Rosato, Injection Molding Handbook, 1st Edition, 1993,
Hanser Publishers.
[9] Injection molding processing and selection of injection molding machine guide, http://www.honeywell plastics.com.
[10] Plastics Materials and Processing Second edition by A. Brent Strong, Bringham Young University.
[11] Plastic industry injection molding applicable note, http://www.deltacompsys.com.
[12] Nello Pasquini, Polypropylene hand book, http://www.hanser.de/ 3 -446-22978-7.
[13] Polypropylene Molding Information obtained by sales@3d-cam.com.
[14] R.G.W.Pye, Injection Mould Design, 4th Edition, 1989, Longman Scientific and Technical Publications.
[15] Mould design, http://www.dow.com/styron/design /guide.
[16] Design Solutions Guide, http://www.honeywell plastics.com/
[17] Villalon, ADA VENUS, Electron Beam Fabrication of Injection Mold Tooling with Conformal Cooling Channels.
[18] Glanvill & Denton “Injection mould design fundamentals” 1st Edition 1965, The Machinery Publishing Co. Ltd.
[19] Steel for Molds English .pdf from Assab steels, www.assabsteels.com.
[20] Book J. Harry Don Bose and Mayne I pribble, Plastic Mould Engineering Hand, Van Nostrand
Reinhold Company Publication.
[21] Technical Directory on design and tooling for plastics, CIPET, Guindy, Chennai.
[22] Data Hand Book on plastics, CIPET, Guindy, Chennai.Banga and Sharma Economics and Cost
Estimation.