R E S E A R C H
Open Access
Compare the differences of synonymous codon
usage between the two species within
cardiovirus
Wen-qian Liu
†, Jie Zhang
†, Yi-qiang Zhang, Jian-hua Zhou, Hao-tai Chen, Li-na Ma, Yao-zhong Ding and
Yongsheng Liu
*Abstract
Background:Cardioviruses are positive-strand RNA viruses in the Picornaviridae family that can cause enteric infection in rodents and also been detected at lower frequencies in other mammals such as pigs and human beings. The Cardiovirus genus consists two distinct species: Encephalomyocarditis virus (EMCV) and Theilovirus (ThV). There are a lot differences between the two species. In this study, the differences of codon usage in EMCV and ThV were compared.
Results:The mean ENC values of EMCV and ThV are 54.86 and 51.08 respectively, higher than 40.And there are correlations between (C+G)12% and (C+G)3% for both EMCV and ThV (r = -0.736;r = 0.986, P < 0.01, repectively). For
ThV the (C+G)12%, (C+G)3%, axisf’1and axis f’2 had a significant correlations respectively but not for EMCV.
According to the RSCU values, the EMCV species seemed to prefer U, G and C ending codon, while the ThV spice seemed to like using U and A ending codon. However, in both genus AGA for Arg, AUU for Ile, UCU for Ser, and GGA for Gly were chosen preferentially. Correspondence analysis detected one major trend in the first axis (f’1)
which accounted for 22.89% of the total variation, and another major trend in the second axis (f’2) which
accounted for 17.64% of the total variation. And the plots of the same serotype seemed at the same region at the coordinate.
Conclusion:The overall extents of codon usage bias in both EMCV and ThV are low. The mutational pressure is the main factor that determines the codon usage bias, but the (C+G) content plays a more important role in codon usage bias for ThV than for EMCV. The synonymous codon usage pattern in both EMCV and ThV genes is gene function and geography specific, but not host specific. Maybe the serotype is one factor effected the codon bias for ThV, and location has no significant effect on the variations of synonymous codon usage in these virus genes.
Background
Synonymous codon usage is biased and the bias seems to be different in different organisms[1,2]. Many factors are concerned to be the reasons for this bias, such as degree and timing of gene expression, codon-anticodon interactions, transcription and translation rate and fide-lity, codon context, and global and local (C+G) content [3,4]. Understanding the extent and causes of biases in
codon usage is essential to the understanding of viral evolution, particularly the interplay between viruses and the immune response [5]. More recent studies have revealed that patterns of codon usage bias and nucleo-tide composition within many cellular genomes are far more complex than previously imagined, and the factors shaping their evolution are still not entirely understood. In general, natural selection and/or mutation pressure for accurate and efficient translation in various organ-isms are the main reasons to this bias. In addition, com-pared with natural selection, mutation pressure plays an important role in synonymous codon usage pattern in some RNA viruses [6-10].
* Correspondence: [email protected]
†Contributed equally
State Key Laboratory of Veterinary Etiological Biology, Lanzhou Veterinary Research Institute, Chinese Academy of Agricultural Sciences, Lanzhou 730046, Gansu, PR China
Picornaviruses are positive single-stranded RNA viruses that cause a variety of important disease states in humans and animals, such as foot-and-mouth disease. The Cardiovirus genus of the familyPicornaviridae con-sists two distinct species: Encephalomyocarditisvirus
(EMCV) andTheilovirus ThV [11]. The EMCVs
com-prise a single serotype and have a wide host range [11-21], while the ThV species, probably includes four serotypes: Theiler’s murine encephalomyelitis virus (TMEV), Vilyuisk human encephalomyelitis virus (VHEV), Thera virus (TRV; isolated from rats) and Saf-fold virus (SAFV; isolated from humans) 1-8., which appear to have much narrower host ranges than EMCV. Like the other virus within Picornaviruses family, the strains in Cardiovirus also consist a open-read-frame (ORF), 5’-untranslate region (5’-UTR) and 3’-untranslate region (3’-UTR). However there are still many complete nucleotide sequences of this type are not reported espe-cially, such as SAFV, therefore there is much more work to study this type virus.
Nevertheless, little information about codon usage pattern of Cardiovirus genus genome including the rela-tive synonymous codon usage (RSCU) and codon usage bias (CUB) in the process of its evolution is available. In this study, the key genetic determinants of codon usage index in Cardiovirus genus were examined.
Results
The characteristics of Synonymous codon usage in EMCV and ThV
In order to investigate the extent of codon usage bias in Cardiovirus, all RSCU values of different codons in 39 Cardiovirus strains were calculated. As shown in Table 1, the EMCV strains seem to like using U, G and C ending codon, while the ThV species seem to like using U and A ending codons. The values of ENC (effective number of codons) (Table 2) among EMCV
Table 1 Synonymous codon usage in Cardiovirus genome
AAa Codon bRSCU Codon bRSCU
EMCV ThV
Ala GCU(A) 1.21 GCU(A) 1.64
GCC(A) 1.45 GCC(A) 1.05
GCA(A) 0.80 GCA(A) 1.02
GCG(A) 0.54 GCG(A) 0.29
Arg CGU(R) 0.91 CGU(R) 0.82
CGC(R) 0.74 CGC(R) 0.94
CGA(R) 0.28 CGA(R) 0.50
CGG(R) 0.61 CGG(R) 0.32
AGA(R) 2.60 AGA(R) 2.67
AGG(R) 0.87 AGG(R) 0.75
Asn AAU(N) 1.17 AAU(N) 1.07
Table 1 Synonymous codon usage in Cardiovirus genome
(Continued)
AAC(N) 0.83 AAC(N) 0.93
Asp GAU(D) 1.17 GAU(D) 0.98
GAC(D) 0.83 GAC(D) 1.02
Cys UGU(C) 0.97 UGU(C) 1.23
UGC(C) 1.04 UGC(C) 0.77
Gln CAA(Q) 0.83 CAA(Q) 1.26
CAG(Q) 1.17 CAG(Q) 0.74
Glu GAA(E) 0.93 GAA(E) 1.38
GAG(E) 1.07 GAG(E) 0.62
Gly GGU(G) 1.06 GGU(G) 1.14
GGC(G) 0.92 GGC(G) 1.01
GGA(G) 1.25 GGA(G) 1.53
GGG(G) 0.77 GGG(G) 0.32
His CAU(H) 1.23 CAU(H) 0.84
CAC(H) 0.77 CAC(H) 1.16
Ile AUU(I) 1.61 AUU(I) 1.55
AUC(I) 0.66 AUC(I) 0.85
AUA(I) 0.73 AUA(I) 0.60
Leu UUA(L) 0.43 UUA(L) 0.73
UUG(L) 1.40 UUG(L) 1.40
CUU(L) 0.95 CUU(L) 1.35
CUC(L) 1.03 CUC(L) 1.25
CUA(L) 0.78 CUA(L) 0.49
CUG(L) 1.41 CUG(L) 0.77
Lys AAA(K) 0.83 AAA(K) 1.15
AAG(K) 1.17 AAG(K) 0.85
Phe UUU(F) 1.10 UUU(F) 1.08
UUC(F) 0.90 UUC(F) 0.92
Pro CCU(P) 1.04 CCU(P) 1.42
CCC(P) 1.12 CCC(P) 1.16
CCA(P) 1.37 CCA(P) 1.02
CCG(P) 0.47 CCG(P) 0.40
Ser AGU(S) 0.60 AGU(S) 0.53
AGC(S) 0.52 AGC(S) 0.45
UCU(S) 1.57 UCU(S) 1.82
UCC(S) 1.36 UCC(S) 1.44
UCA(S) 1.40 UCA(S) 1.37
UCG(S) 0.55 UCG(S) 0.39
Thr ACU(T) 1.27 ACU(T) 1.49
ACC(T) 1.31 ACC(T) 1.21
ACA(T) 1.13 ACA(T) 1.05
ACG(T) 0.29 ACG(T) 0.25
Tyr UAU(Y) 0.99 UAU(Y) 0.94
UAC(Y) 1.01 UAC(Y) 1.06
Val GUU(V) 0.90 GUU(V) 1.53
GUC(V) 0.96 GUC(V) 0.94
GUA(V) 0.66 GUA(V) 0.62
GUG(V) 1.48 GUG(V) 0.91
a Amino acid
strains examined are very similar, which vary from 54.40 to 56.11 with a mean value of 54.86 and S.D. of 0.36, while the values of ENC among Theilovirus are a little different, which vary from 48.24 to 54.94 with a mean value of 51.08 and S.D. of 2.17. Because all the ENC values of both EMCV strains and Theilovirus strains are high (ENC > 40), codon usage bias in Cardi-oviru genome is a little slight. However, there is a
marked variation in codon usage pattern among differ-ent Theilovirus genes (S.D. = 6.41) compared to the EMCV genes (S.D. = 0.36). The concept is further sup-ported by the values of CG3. The (C+G)3% values of
EMCV strains range from 46.47 to 52.11% with a mean of 48.90 and S.D. of 2.18 while these values of ThV strains range from 37.35 to 51.00, with a mean of 43.72 and S.D. of 5.77.
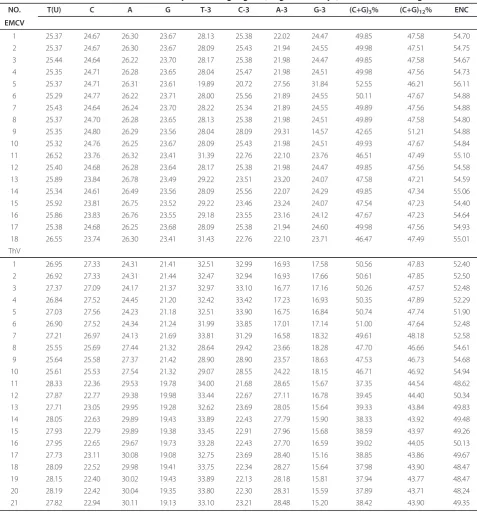
Table 2 Identified nucleotide contents in complete coding region (length > 250 bps) in the Cardiovirus genome
NO. T(U) C A G T-3 C-3 A-3 G-3 (C+G)3% (C+G)12% ENC
EMCV
1 25.37 24.67 26.30 23.67 28.13 25.38 22.02 24.47 49.85 47.58 54.70 2 25.37 24.67 26.30 23.67 28.09 25.43 21.94 24.55 49.98 47.51 54.75 3 25.44 24.64 26.22 23.70 28.17 25.38 21.98 24.47 49.85 47.58 54.67 4 25.35 24.71 26.28 23.65 28.04 25.47 21.98 24.51 49.98 47.56 54.73 5 25.37 24.71 26.31 23.61 19.89 20.72 27.56 31.84 52.55 46.21 56.11 6 25.29 24.77 26.22 23.71 28.00 25.56 21.89 24.55 50.11 47.67 54.88 7 25.43 24.64 26.24 23.70 28.22 25.34 21.89 24.55 49.89 47.56 54.88 8 25.37 24.70 26.28 23.65 28.13 25.38 21.98 24.51 49.89 47.58 54.80 9 25.35 24.80 26.29 23.56 28.04 28.09 29.31 14.57 42.65 51.21 54.88 10 25.32 24.76 26.25 23.67 28.09 25.43 21.98 24.51 49.93 47.67 54.84 11 26.52 23.76 26.32 23.41 31.39 22.76 22.10 23.76 46.51 47.49 55.10 12 25.40 24.68 26.28 23.64 28.17 25.38 21.98 24.47 49.85 47.56 54.58 13 25.89 23.84 26.78 23.49 29.22 23.51 23.20 24.07 47.58 47.21 54.59 14 25.34 24.61 26.49 23.56 28.09 25.56 22.07 24.29 49.85 47.34 55.06 15 25.92 23.81 26.75 23.52 29.22 23.46 23.24 24.07 47.54 47.23 54.40 16 25.86 23.83 26.76 23.55 29.18 23.55 23.16 24.12 47.67 47.23 54.64 17 25.38 24.68 26.25 23.68 28.09 25.38 21.94 24.60 49.98 47.56 54.93 18 26.55 23.74 26.30 23.41 31.43 22.76 22.10 23.71 46.47 47.49 55.01 ThV
Compositional properties of coding sequences of both EMCV and ThV
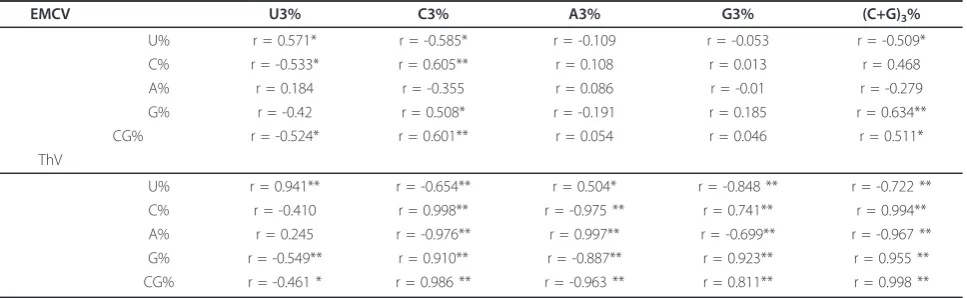
As shown in Table 3, (C+G)% has a highly significant correlation with each A3%, C3%, G3% and U3% . (C+G)
3% has a highly significant correlation with each of A%,
U%, C% and G% among the ThV strains but not among the EMCV strains. This indicates that the (C+G)% and (C+G)3% may reflect some more important
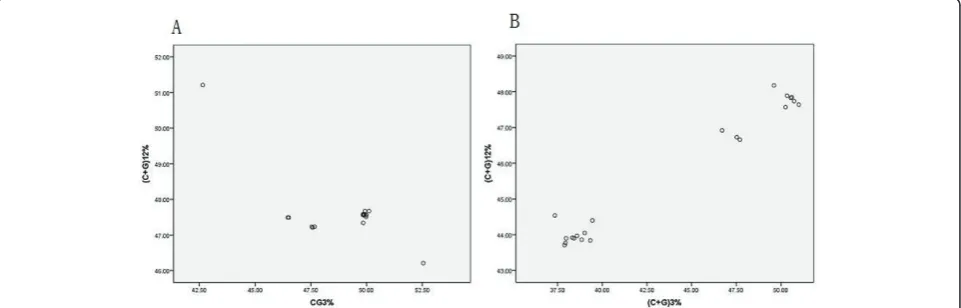
characteris-tics of codon usage pattern of ThV compared with EMCV. Then the C+G content at first and second codon positions ((C+G)12%) was compared with that at synonymous third codon positions ((C+G)3%) for both
EMCV and ThV respectively. A highly significant corre-lation is observed in ThV (r = 0.986, P < 0.01)(Figure 1A, Table 4). However for EMCV a highly negative cor-relation is observed (r = -0.736, P < .0.01)(Figure 1B, Table 4). Then the (C+G)12% and (C+G)3% of both
EMCV and ThV were compared with axisf’1and axisf’2
respectively. The results (Table 4) show that for EMCV there are no significant correlations between (C+G)3%,
(C+G)12%, axis f’1 and axis f’2 are observed, while the
results of ThV are opposite. The ENC-plot [ENC plotted against (G+C)3%] was used as a part of general strategy
to investigate patterns of synonymous codon usage and all of the spots lie below the expected curve (Figure 2). All these results imply that the codon bias of Cardio-virus especially the ThV can be explained mainly by an uneven base composition, in other words, by mutation pressure rather than natural selection and the (C+G) content has a more significant effect for ThV than EMCV
Correspondence analysis (COA) for all the strains
To investigate the major trend in codon usage variation among Cardiovirus, COA was used for all 39 Cardio-virus complete coding regions selected for this study.
COA detect one major trend in the first axis (f’1) which
account for 22.89% of the total variation, and another major trend in the second axis (f’2) which account for
17.64% of the total variation. The coordinate of the complete coding region of each gene was plotted in Figure 3 defining by the first and second principal axes. It is clear that the f’1 values of all EMCV are positive
while the ThVs are negative. And the plots of the strains of the same serotype seem at the same region. Further-more, the EMCV has a tendency to converge tightly while the different serotypes of ThV are dispersed. These findings imply that different serotype may have different codon usage patterns. Interestingly, the plot of EMC-30 is a little far from the other EMCV, but this does not indicate the location is an element that could dramatically influence the codon usage pattern.
Qualitative evaluation of codon usage bias in EMCV and ThV
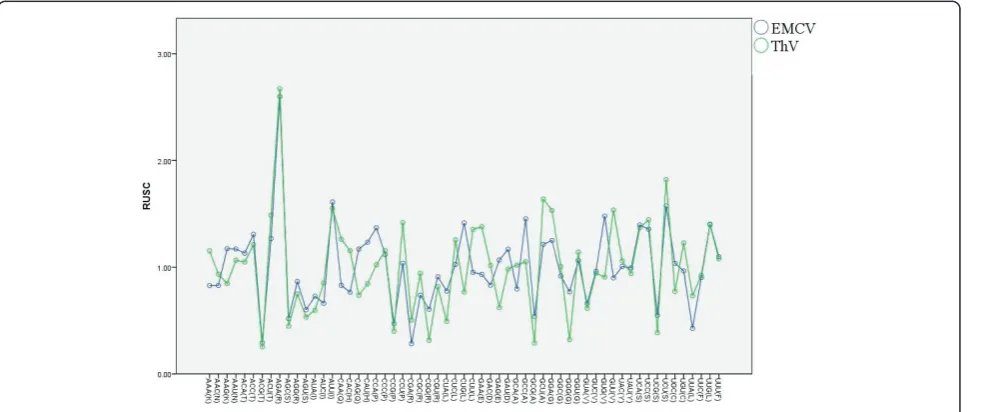
There was a seemingly random variation in RSCU between amino acids and gene groups. There were sev-eral synonymous codons with strong discrepancy for codon usage in each genus. As for EMCV, in details, AGA for Arg, GGA for Gly, CAU for His, AUU for Ile, CCA for Pro, UCU for Ser and GUG for Val. And there are some differences of the global pattern of codon usage between EMCV and Theilovirus. However, in both genus AGA for Arg, AUU for Ile, UCU for Ser, and GGA for Gly were chosen preferentially (Figure 4).
Discussion
Studies of synonymous codon usage in viruses can reveal much about viral genomes. In this study, we used RSCU, ENC, COA, and GC3S, to measure the
synon-ymous codon usage bias in order to compare the differ-ences between EMCV and ThV, the two species within
Cardiovirus. The synonymous codon usage bias in cod-ing regions of both EMCV and ThV are low because the mean ENC values of 54.86 and 51.08 respectively (higher than 40). This is in agreement with previous reports about some other RNA viruses, for example, BVDV (mean ENC = 51.42), H5N1 (mean ENC = 50.91) and SARS-covs (mean ENC = 48.99)[6,7,21]. A low codon usage bias is advantageous to replicate efficiently in vertebrate host cells, with potentially distinct codon preferences. However there is a marked variation in codon usage pattern among different Theilovirus genes (S.D. = 6.41) compared to the EMCV genes (S.D. = 0.36). One explanation about this phenomenon is that the ThV probably has four serotypes while the EMCV just has one and the serotype might affect the codon choice.
A general mutational pressure, which affects the whole genome, would certainly account for the majority of the codon usage variation. In this study, the general associa-tion between codon usage bias and base composiassocia-tion suggests that mutational pressure, rather than natural
selection, is mainly supported by the highly significant correlation between (C+G)12% and (C+G)3% (r = -0.736
for EMCV; r = 0.986 for ThV, P < 0.01), since the effects are present at all codon positions. Also the (G +C) content was another factor which was found to be strong correlated with codon usage bias. In this study, the results indicated the (C+G) content played an important role in codon usage bias for ThV (Table 3), but not for EMCV. This is a little complex for EMCV and we need to do more research for this genus such as each nucleotide composition, gene structure and so on to find the main factor for codon bias of EMCV. Never-theless we still consider that the mutational pressure rather than natural selection is the one of the main fac-tors responsible for the variation of synonymous codon usage among ORF coding sequences in Cardiovirus genus.
Generally, previous reports indicates that many viruses including foot-and-mouth disease viruses, influenza A virus subtype H5N1, severe acute respiratory syndrome Coronavirus (SARSCoV) and human bocavirus, prefer-entially use C and G-ended codons[2,7,9,10]. In this study we found that the EMCV strains seemed to like using U, G and C ending codon, while the ThV species seemed to like using U and A ending codon. Also there was a seemingly random variation in RSCU between amino acids and gene groups. This may be because using these codon with different endings could be advantage for replicating efficiently in host cells with potentially distinct codon preferences for both EMCV and ThV.
Serotype may be one factor for codon bias in Cardio-virus as the Figure 3 showed. And there was no evi-dence supported that location could be a factor for codon bias, because the plot of EMC-30 which was iso-lated from USA was a little far from other EMCV that were isolated from USA plots.
Table 4 Analysis of correlation between the first two principle axes and nucleotide contents in samples.
EMCV (C+G)3% (C+G)12% f1’ f2’
(C+G)3% r = 1 r = -0.736** r = 0.360 r = 0.357
(C+G)12% r = -0.736** r = 1 r = 0.202 r = 0.139
f1’ r = 0.360 r = 0.202 r = 1 r = 0.612** f2’ r = 0.357 4 = 0.139 r = 0.612** r = 1
ThV
(C+G)3% r = 1 r = 0.986** r = 0.979** r = 0.973**
(C+G)12% r = 0.986** r = 1 r = 0.971** r = 0.969**
f1’ r = 0.973** r = 0.971** r = 1 r = 0.917** f2’ r = 0.979** r = 0.969** r = 0.917** r = 1
* means 0.01 < p < 0.05 **means p < 0.01©
Figure 1Correlation between (C+G) content at first and second codon positions (C+G)12with that at synonymous third codon
Conclusion
The overall extents of codon usage bias in both EMCV and ThV are low (mean ENC = 54.86; mean ENC = 51.08 respectively, higher than 40). The mutational pressure
rather than natural selection is the main factor that deter-mines the codon usage bias that is supported by the highly significant correlation between (C+G)12% and (C+G)3% (r
= -0.736 for EMCV; r = 0.986 for ThV, P < 0.01), but the (C+G) content plays a more important role in codon usage bias for ThV than for EMCV. The synonymous codon usage pattern in both EMCV and ThV genes is gene func-tion and geography specific, but not host specific. Maybe the serotype is one factor effected the codon bias for ThV, and location has no significant effect on the variations of synonymous codon usage in these virus genes.
Figure 2Effective number of codons used in each ORF plotted against the (C+G)3. The continuous curve plots the relationship
between (C+G)3. and ENC in the absence of selection. All of spots
lie below the expected curve.
Figure 3Compare the codon the codon usage pattern among EMCV and Thv.
Figure 4A plot of value of the first and second axis of each complete coding region in COA. The first axis (f’1) accounts
for22.89% of the total variation, and the second axis (f’2) accounts
Materials and methods
Sequences
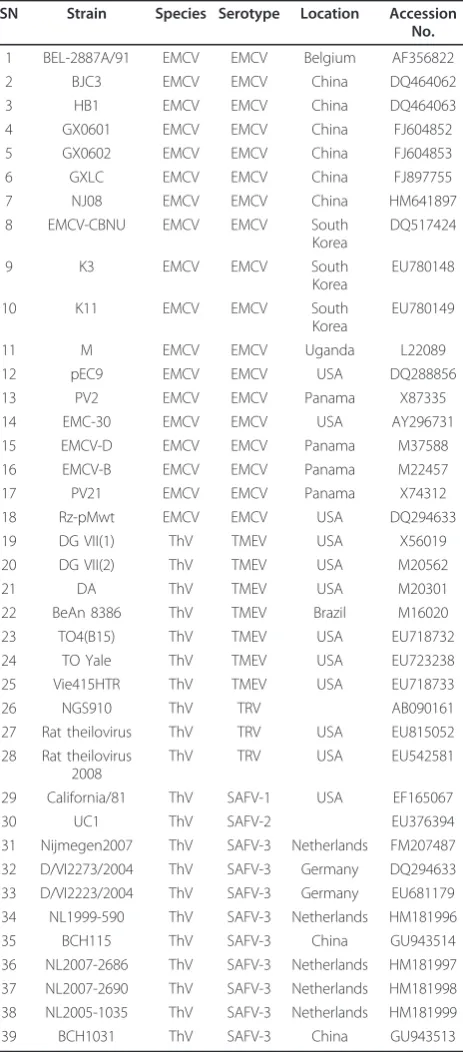
A total of 39 Cardiovirus genomes were used in this study, including 18 EMCV genomes and 21ThV gen-omes. The CDS of these viruses were obtained from NCBI http://www.ncbi.nlm.nih.gov/Genbank/ randomly in December 2010. And the serial number (SN), Gen-Bank number, genotype and other detail information are listed in Table 5.
Measures of relative synonymous codon usage
Relative synonymous codon usage (RSCU) values of each codon in each ORF were used to measure the synonymous codon usage. RSCU values are largely inde-pendent of amino acid composition and are particularly useful in comparing codon usage between genes, or sets of genes that differ in their size and amino acid compo-sition [22]. The RSCU value of theith codon for thejth amino acid was calculated as:
RSCU= gijni
j gij ·ni
Where gijis the observed number of the ith codon for
jth amino acid which has nitype of synonymous codons.
When the codon with RSCU values close to 1.0, it means that this codon is chosen equally and randomly. The values of RSCU were obtained by CodonW program
The effective number of codons (ENC) was calculated to quantify the codon usage bias of an ORF [23], which is the best estimator of absolute synonymous codon usage bias [24]. The larger extent of codon preference in a gene, the smaller the ENC value is. In an extremely biased gene where only one codon is used for each amino acid, this value would be 20; if all codons are used equally, it would be 61; and if the value of the ENC is greater than 40, the codon usage bias was regarded as a low bias [25] The values of ENC were obtained by CodonW program.
Composition analysis of coding region
In order to better understand the synonymous codon usage variation among different Cardiovirus isolates, The (C+G) content at the first and second codon posi-tions [(C+G)12%] and that at the synonymous third
posi-tion [(C+G)3%] were calculated by the CodonW
program, respectively [26,27]. The values of the (C+G) content at different positions were used to compare with the values of the other compositional content.
Correspondence analysis (COA)
Multivariate statistical analysis can be used to explore the relationships between variables and samples. In this study, correspondence analysis was used to investigate the major
trend in codon usage variation among genes. In this study, the complete coding region of each gene was represented as a 59 dimensional vector, and each dimension corre-sponds to the RSCU value of one sense codon (excluding Met, Trp, and the termination codons) [28].
Table 5 The information of the 39 sequences used in this study
SN Strain Species Serotype Location Accession No.
1 BEL-2887A/91 EMCV EMCV Belgium AF356822
2 BJC3 EMCV EMCV China DQ464062
3 HB1 EMCV EMCV China DQ464063
4 GX0601 EMCV EMCV China FJ604852 5 GX0602 EMCV EMCV China FJ604853
6 GXLC EMCV EMCV China FJ897755
7 NJ08 EMCV EMCV China HM641897
8 EMCV-CBNU EMCV EMCV South Korea
DQ517424
9 K3 EMCV EMCV South
Korea
EU780148
10 K11 EMCV EMCV South
Korea
EU780149
11 M EMCV EMCV Uganda L22089
12 pEC9 EMCV EMCV USA DQ288856
13 PV2 EMCV EMCV Panama X87335
14 EMC-30 EMCV EMCV USA AY296731
15 EMCV-D EMCV EMCV Panama M37588 16 EMCV-B EMCV EMCV Panama M22457
17 PV21 EMCV EMCV Panama X74312
18 Rz-pMwt EMCV EMCV USA DQ294633
19 DG VII(1) ThV TMEV USA X56019
20 DG VII(2) ThV TMEV USA M20562
21 DA ThV TMEV USA M20301
22 BeAn 8386 ThV TMEV Brazil M16020 23 TO4(B15) ThV TMEV USA EU718732
24 TO Yale ThV TMEV USA EU723238
25 Vie415HTR ThV TMEV USA EU718733
26 NGS910 ThV TRV AB090161
27 Rat theilovirus ThV TRV USA EU815052 28 Rat theilovirus
2008
ThV TRV USA EU542581
29 California/81 ThV SAFV-1 USA EF165067
30 UC1 ThV SAFV-2 EU376394
Correlation analysis
Correlation analysis was used to identify the relationship between nucleotide composition and synonymous codon usage pattern [29]. This analysis was implemented based on the Spearman’s rank correlation analysis way.
All statistical processes were carried out by with statis-tical software SPSS 11.5 for windows.
Acknowledgements
This work was supported in parts by grants from International Science & Technology Cooperation Program of China (No.2010DFA32640) and Science and Technology Key Project of Gansu Province (No.0801NKDA034). This study was also supported by National Natural Science foundation of China (No.30700597, 31072143).
Authors’contributions
WQL and JZ conceived of the study. WQL downloaded these sequences, calculated the data, analyzed the results and drafted the manuscript; JZ supervised the research, analyzed the results and helped draft the manuscript; JHZ calculated and visualized the data; YQZ, HTC, LNM and YZD assisted with data analysis; YSL supervised the research and helped draft the manuscript.
Competing interests
The authors declare that they have no competing interests.
Received: 8 March 2011 Accepted: 27 June 2011 Published: 27 June 2011
References
1. Andersson SGE, Kurland CG:Codon preferences in free living microorganisms.Microbiol Rev1990,54:198-210.
2. Grantham R, Gautier C, Gouy M, Mercier R, Pave A:Codon catalog usage and the genome hypothesis.Nucleic Acids Res1980,8:49-62.
3. Martin A, Bertranpetit J, Oliver JL:Variation in G+C content and codon choice: differences among synonymous codon groups in vertebrate genes.Nucleic Acids Res1989,17:6181-6189.
4. Xie T, Ding D, Tao X, Dafu D:The relationship between synonymous codon usage and protein structure.FEBS Lett1998,434:93-96. 5. Laura A Shackelton, Colin R Parrish, Edward C Holmes:Evolutionary Basis
of Codon Usage and Nucleotide Composition Bias in Vertebrate DNA Viruses.J Mol Biol1996,262:459-472.
6. Gu WJ, Zhou T, Ma JM, Sun X, Lu ZH:Analysis of synonymous codon usage in SARS coronavirus and other viruses in the Nidovirales.Virus Res
2004,101:155-161.
7. Zhou T, Gu WJ, Ma JM, Sun X, Lu ZH:Analysis of synonymous codon usage in H5N1 virus and other influenza A viruses.Biosystems2005, 81:77-86.
8. Zhou T, Sun X, Lu ZH:Synonymous codon usage in environmental Chlamydia UWE25 reflects an evolution divergence from pathogenic chlamydiae.Gene2006,368:117-125.
9. Zhong JC, Li YM, Zhao S, Liu S, Zhang Z:Mutation pressure shapes codon usage in the GC-rich genome of foot-and-mouth disease virus.Virus Genes2007,35:767-776.
10. Jenkins GM, Holmes EC:The extent of codon usage bias in human RNA viruses and its evolutionary origin.Virus Res2003,92:1-7.
11. Stanway G, Brown F, Christian P, Hovi T, Hyypia T, AMQ King, Knowles NJ, Lemon SM, Minor PD, Pallansch MA, Palmenberg AC, Skern T:Eighth report of the International Committee on Taxonomy of Viruses.InFamily Picornaviridae.Edited by: Fauquet CM, Mayo MA, Maniloff J, Desselberger U, Ball LA. Elsevier Academic Press, London, United Kingdom; 2005:757-778. 12. Zimmerman JJ, ed.:Encephalomyocarditis.2 edition. CRC Press, Boca Raton,
FL; 1994.
13. Theiler M:Spontaneous encephalomyelitis of mice–a new virus disease.
Science1934,80:122.
14. Abed Y, Boivin G:New Saffold cardiovirus in 3 children in Canada.Emerg Infect Dis2008,14:834-836.
15. Casals J:Immunological characterization of Vilyuisk human encephalomyelitis virus.Nature1963,200:339-341.
16. Pritchard AE, Lipton HL:Nucleotide sequence identifies Vilyuisk virus as a divergent Theiler’s virus.Virology1992,191:469-472.
17. Ohsawa K, Watanabe Y, Miyata H, Sato H:Genetic analysis of a Theiler-like virus isolated from rats.Comp Med2003,53:191-196.
18. Vladimirtsev VA,et al:Family clustering of Viliuisk encephalomyelitis in traditional and new geographic regions.Emerg Infect Dis2007, 13:1321-1326.
19. Lipton HL, Friedmann A, Sethi P, Crowther JR:Characterization of Vilyuisk virus as a picornavirus.J Med Virol1983,12:195-203.
20. Pritchard AE, T Strom and HL:Lipton Nucleotide sequence identifies Vilyuisk virus as a divergent Theiler’s virus.Virology1992,191:469-472. 21. Wang M, Zhang J, Liu Y:Analysis of codon usage in bovine viral diarrhea
virus.Arch Virol2011,156:153-160.
22. Sharp PM, Li WH:Codon usage in regulatory genes inEscherichia coli does not reflect selection for‘rare’codon.Nucleic Acids Res1986, 14:7737-7749.
23. Wright F:The‘effective number of codons’used in a gene.Gene1990, 87:23-29.
24. Comeron JM, Aguade M:An evaluation of measures of synonymous codon usage bias.J Mol Evol1998,47:268-274.
25. Anders Fuglsang:The‘effective number of codons’revisited.Biochemical and Biophysical Research Communications2004,317:957-964.
26. Novembre AJohn:Accounting for Background Nucleotide Composition When Measuring Codon Usage Bias.Mol Biol Evol2002,19:1390-1394. 27. Comeron JM, Aguade M:An evaluation of measures of synonymous
codon usage bias.J Mol Evol1998,47:268-274.
28. Mardia KV, Kent JT, Bibby JM:Multivariate analysisNewYork, Academic press; 1979.
29. Ewens WJ, Grant GR:Statistical Methods in BioinformaticsNewYork, Springer; 2001.
doi:10.1186/1743-422X-8-325
Cite this article as:Liuet al.:Compare the differences of synonymous codon usage between the two species within cardiovirus.Virology Journal20118:325.
Submit your next manuscript to BioMed Central and take full advantage of:
• Convenient online submission
• Thorough peer review
• No space constraints or color figure charges
• Immediate publication on acceptance
• Inclusion in PubMed, CAS, Scopus and Google Scholar
• Research which is freely available for redistribution