Dusty Universe viewed by AKARI far infrared detector
K. Małek1, A. Pollo2,3, T. T. Takeuchi1, E. Giovannoli4,5, V. Buat4, D. Burgarella4, M. Malkan6, and A. Kurek3
1Department of Particle and Astrophysical Science, Nagoya University, Furo-cho, Chikusa-ku, 464-8602 Nagoya, Japan 2National Centre for Nuclear Research, ul. Ho˙za 69, 00-681 Warszawa, Poland
3The Astronomical Observatory of the Jagiellonian University, ul. Orla 171, 30-244 Krak´ow, Poland 4Laboratoire d’Astrophysique de Marseille, OAMP, Universite Aix-Marseille, CNRS,´
38 rue Fred´ eric Joliot-Curie, 13388 Marseille, cedex 13, France´
5University of the Western Cape, Private Bag X17, 7535, Bellville, Cape Town, South Africa 6Department of Physics and Astronomy, University of California, Los Angeles, CA 90024
(Received November 8, 2012; Revised June 11, 2013; Accepted June 18, 2013; Online published October 24, 2013)
We present the results of the analysis of multiwavelength Spectral Energy Distributions (SEDs) of far-infrared galaxies detected in the AKARI Deep Field-South (ADF–S) Survey. The analysis uses a carefully selected sample of 186 sources detected at the 90 μm AKARI band, identified as galaxies with cross-identification in public catalogues. For sources without known spectroscopic redshifts, we estimate photometric redshifts after a test of two independent methods: one based on using mainly the optical—mid infrared range, and one based on the whole range of ultraviolet—far infrared data. We observe a vast improvement in the estimation of photometric redshifts when far infrared data are included, compared with an approach based mainly on the optical—mid infrared range. We discuss the physical properties of our far-infrared-selected sample. We conclude that this sample consists mostly of rich in dust and young stars nearby galaxies, and, furthermore, that almost 25% of these sources are (Ultra)Luminous Infrared Galaxies. Average SEDs normalized at 90μm for normal galaxies (138 sources), LIRGs (30 sources), and ULIRGs (18 galaxies) show a significant shift in the peak wavelength of the dust emission, and an increasing ratio between their bolometric and dust luminosities which varies from 0.39 to 0.73.
Key words:Galaxies, starburst galaxies, SED, spectral energy distribution, LIRGs, ULIRGs.
1.
Introduction
Star formation (SF) history holds the key to understand-ing galaxy evolution, and—from a wider perspective—the nature of our Universe. One of the obstacles to observing starburst regions in galaxies using optical telescopes is dust. On the other hand, protostars form from dust clouds and molecular gas. Most of the dust in galaxies is quite cool (∼10–20 K), and its emission is visible only in the far in-frared (Glass, 1999). A warm dust component might be observable during starburst activity (Phillips, 2005). The newly born, blue massive stars are surrounded by gas and dust, which obscure the most interesting regions and, ad-ditionally, absorb a part of the ultraviolet (UV) light emit-ted by stars. Dust heaemit-ted in this way re-emits the absorbed light in the infrared wavelengths, mostly in the far infrared. Even very careful observations in the UV and optical ranges of wavelengths cannot provide a detailed description of the SF processes in galaxies. The infrared (IR) emission, re-flecting the dust-obscured SF activity of galaxies (Genzel and Cesarsky, 2000), combined together with UV and op-tical data, can give full information about the star forma-tion history and rate. Addiforma-tionally, the ratio between the UV and far infrared (FIR) emission may serve as an
indi-Copyright cThe Society of Geomagnetism and Earth, Planetary and Space Sci-ences (SGEPSS); The Seismological Society of Japan; The Volcanological Society of Japan; The Geodetic Society of Japan; The Japanese Society for Planetary Sci-ences; TERRAPUB.
doi:10.5047/eps.2013.06.005
cator of the dust attenuation in galaxies (e.g., Buatet al., 2005; Takeuchi et al., 2005; Noll et al., 2009). The first all-sky survey at IR was performed by the satellite IRAS (The Infra-Red Astronomical Satellite, Neugebaueret al., 1984). IRAS mapped the sky at 12μm, 15μm, 60μm, and 100 μm for 300 days and forever changed our view of the sky (Beichman, 1987). IRAS detected IR emission from about 350 000 astronomical sources, and the number of known astronomical objects went up by 70%. A large fraction of the extragalactic sources detected in the far in-frared were spiral galaxies, quasars (QSOs), Seyfert galax-ies, and early type galaxies (Genzel and Cesarsky, 2000), but also new classes of galaxies very bright in the IR, such asULIRGs (ultra-luminous infrared galaxies), were found. IR satellite missions, focusing on selected areas, were fol-lowed by MSX (Midcourse Space Experiment, e.g., Egan et al., 2003), ISO (Infrared Space Observatory, e.g., Gen-zel and Cesarsky, 2000; Vermaet al., 2005), and SST (The Spitzer Space Telescope, e.g., Soiferet al., 2008).
After more than 20 years, a Japanese spacecraft, AKARI (akari means warm-light in Japanese), performed a new all-sky survey with a much higher angular resolution than IRAS (Murakamiet al., 2007). AKARI has also provided deeper surveys centered on the North and South Ecliptic Poles (e.g., Wadaet al., 2008; Matsuuraet al., 2011; Tak-agiet al., 2012). In particular, with the Far-Infrared Sur-veyor (FIS, Kawadaet al., 2007), observations in the four FIR bands were possible (65μm, 90μm, 140μm, and 160
μm). Among the observed fields, the lowest Galactic cirrus emission density region near the South Ecliptic Pole was selected for deep observation, to provide the best FIR ex-tragalactic image of the Universe. This field is referred to as the AKARI Deep Field South (ADF–S). This survey is unique in having a continuous wavelength coverage with four photometric bands and mapping over a wide area (ap-proximately 12 square degrees). In the ADF-S, 2 263 in-frared sources were detected down to∼20 mJy at the 90μm band, and infrared colours for about 400 of these sources were measured. The first analysis of this sample in terms of the nature and properties for 1000 ADF–S objects brighter than 0.301 Jy in the 90μm band was presented by Małek et al.(2010).
In this work, we present a more sophisticated approach to the analysis than the previous analysis (Małeket al., 2010) of the ADF–S sources in multiwavelength studies, based on a sample of 545 identified galaxies. In Section 2, we present our data and sample selection. We discuss the spectroscopic redshifts distribution in Section 3, and a new approach to the estimation of photometric redshifts based on the Le PHARE and CIGALE codes in Section 4. Discussion of physical and statistical properties of the obtained SEDs is presented in Section 5. The basic properties of a sample of galaxies with known spectroscopic redshifts are shown in Section 6. A discussion of (U)LIRGs properties found in our sample is presented in Section 7. Section 8 presents our conclusions.
In all calculations in this paper we assume the flat model of the Universe, withM =0.3, =0.7, and H0 =70 km s−1Mpc−1.
2.
Data
The main aim of our work is to build a galaxy sample with high quality fluxes from the UV to the FIR using the ADF–S sample. Redshift information is also needed to obtain physical parameters from the SEDs.
Our sample is drawn from the AKARI ADF–S catalog presented by Małeket al.(2010), and published at the Cen-tre de Donn´ees astronomiques de Strasbourg, Strasbourg astronomical Data Center (http://cdsarc.u-strasbg.fr/viz-bin/qcat?J/A+A/514/A11). The sample consists of the 545 ADF–S sources from the so-called 6σ catalog (S90μm>0.0301 Jy, which corresponds to the 6σ de-tection level) measured by the AKARI FIS detector, for which the optical counterparts were found in pub-lic catalogues (Małek et al., 2010). Additional mea-surements, mostly from WISE (Wright et al., 2010) and GALEX (Dale et al., 2007), and further informa-tion from public databases (SIMBAD http://simbad.u-strasbg.fr/simbad/, NED http://ned.ipac.caltech.edu/, and IRSA http://irsa.ipac.caltech.edu/) were used in our present analysis (see also Małeket al., 2013).
3.
Spectroscopic Redshifts Distribution
In total (data coming from Małek et al., 2010; the dedicated spectroscopic measurements of selected ADF–S sources performed by Sedgwicket al., 2011; new data from the NED and SIMBAD databases) we have 173 galaxies with known spectroscopic redshifts (zspectro). The mean value of the redshift in this sample is equal to 0.08±0.01,
Fig. 1. A typical example of a spectral coverage for a source (here: 2MASX J04421266-5355520) within our sample. Each galaxy from our sample has a measurement in the FIR and optical parts of its spectrum. Nearly 50% of galaxies have additional detections in the UV and MIR.
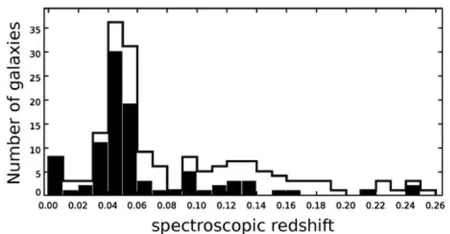
Fig. 2. The spectroscopic redshift distributionN(z)in 0.01zbins. The open histogram corresponds to the distribution of 173 galaxies with known spectroscopic redshifts in our sample. The only one object with a redshift higher than 0.3 is not shown here (quasar HE 0435-5304, located at z = 1.232). The filled histogram corresponds to the 95 galaxies used for Spectral Energy Distribution fitting.
with a median value of 0.06. This implies, together with AKARI FIR measurements, that our sample mainly con-sists of nearby FIR-bright galaxies.
Unfortunately, the majority of our sample with spectro-scopic redshift information does not have enough photomet-ric measurements to fit SED models with a high confidence. After a visual inspection of all the spectra, we decided to ap-ply a stricter selection criterion, and for the next procedure we have chosen only galaxies with at least six photomet-ric measurements in the whole spectral range. Since our sample selection was based on the WIDE-S 90μm AKARI band, each galaxy has at least one measurement in the FIR, at 90μm. Additionally, 95% of sources are detected in the MIR, all galaxies have optical information, and half of them were also detected in the UV. The typical spectral coverage of a source from our sample is shown in Fig. 1. After this selection, 95 galaxies from the initial sample of 173 galax-ies with a known spectroscopic redshift remained for the subsequent analysis. All the available measurements from the ADF–S database were used for the SED fitting.
4.
Photometric Redshifts
The information about spectroscopic redshifts is avail-able for 173 galaxies among 545 galaxies identified by Małek et al. (2010). It implies that more than 68% of sources in our sample have an identification in public cata-logues as galaxies with photometric data but no redshift. In order to analyse properties of all the identified galaxies, we decided to estimate the photometric redshifts (zphot) for all galaxies with at least 6 measurements in the whole spectral range (127 galaxies fulfill this condition).
We performed a test of the accuracy of the photometric redshift for the sample of 95 galaxies with known zspectro and at least 6 photometric measurements in the whole spec-tral range (see Fig. 1). As representative parameters de-scribing the accuracy of our method we used the percentage of successfully estimated redshifts, and the percentage of catastrophic errors (hereafter CE), which meet the condi-tion:
CE := |zspectro−zphoto|
(1+zspectro) >0.15, (1)
following Ilbertet al.(2006). The fraction of CE (hereafter
η) is defined as the ratio of galaxies for which CE occurred and all the galaxies in the sample. The redshift accuracy
σz/(1+z)was measured using the normalized median abso-lute deviation:
σz/(1+z)=1.48·median
|z|
1+zspectro, (2)
wherezis the difference between spectroscopic and esti-mated photometric redshift.
To estimate the photometric redshifts we used two differ-ent codes:
– Le PHARE: Photometric Analysis for Redshift
Esti-mateversion 2.2 (Le PHARE1; Arnoutset al., 1999; Ilbert et al., 2006) code. We tested all the available libraries, one by one, of galaxy SEDs included in the Le PHARE distribu-tion. Using the sources with spectroscopic redshifts avail-able as a test sample, we checked the performance of all the available libraries: the percentage of sources for which the photometric redshift estimation could be performed suc-cessfully, and the scatter between estimated photometric and “real” spectroscopic values of redshifts. The best re-sults were obtained for the Rieke library, which includes eleven SEDs of luminous star forming galaxies constructed by Riekeet al.(2009). This is not very surprising, since it is expected that most of our galaxies belong to this class of galaxies.
– CIGALE: Considering that a significant part of our
data is in the FIR, which is not well covered by the tem-plates included in the Le PHARE distribution, we decided to test a different approach, i.e. to use theCode Investigat-ing GALaxy Emission2 (CIGALE; Nollet al., 2009) SED fitting program as a tool for the estimation of photomet-ric redshifts. CIGALE was not developed as a tool for the estimation ofzphotbut since it uses a large number of mod-els covering the wide spectral range, including IR and FIR,
1http://www.cfht.hawaii.edu/∼arnouts/LEPHARE/lephare.html 2http://cigale.oamp.fr/
it may be expected to provide a better zphot for our FIR-selected sample than the software that mainly uses optical to NIR data.
In the case of CIGALE, the values of parameters defined above were: η =9.47% andσz/(1+z) = 0.06. We found that less than 10% ofzCIGALEsuffer from CE. CE occurred in the case of nine galaxies, and the mean value of|zspectro− zCIGALE|/(1+zspectro)for the CE subsample was equal to 0.22 ±0.06, with minimum and maximum values of CE equal to 0.16 and 0.34, respectively.
Performing the same test with Le PHARE we obtained
η = 14.73% and σz/(1+z) = 0.05. We were not able to estimate photometric redshifts for 11 galaxies, and, addi-tionally, CE occurred for three galaxies. The mean value of|zspectro−zphot|/(1+zspectro)for the CE subsample was equal to 0.27± 0.02 (with minimum and maximum val-ues of CE equal to 0.26 and 0.28, respectively). Thus, we conclude that the deviation from the real value for the suc-cessful measurements was lower in the case of Le PHARE; however, the percentage of successful measurements was higher when CIGALE was used. Thus, Le PHARE provides higher accuracy while CIGALE assures a higher success rate for our FIR-selected sample. We have also checked that the amplitude of CEs (both mean and median values) was smaller in the case of CIGALE. For example, the min-imum value of CE for CIGALE equals 0.16 (two galaxies), and it is very close to the CEs boundary limit.
This result is most likely related to our sample selection (which consists of galaxies bright at 90μm), and its spec-tral coverage, in particular a small amount of optical and MIR measurements which are needed by Le PHARE to determine the galaxy properties (e.g. Balmer break) prop-erly. The possible explanation of a better performance of CIGALE is the limited number of FIR templates used by Le PHARE. Additionally, according to Ilbert et al. (2006), Le PHARE has the best performance in the red-shift range 0.2 ≤ zspectro ≤ 1.5, while our spectroscopic range (0≤ zspectro ≤ 0.25) lies outside this redshift range. For galaxies with spectroscopic redshifts lower than 0.2 Il-bertet al.(2006) have found a dramatic increase of the frac-tion of CE, caused by the mismatch between the Balmer break and the intergalactic Lyman-alpha forest depression atλ <1216 ˚A. Yet another reason for the lower percent-age of redshifts measured successfully by Le Phare are the spectral types of galaxies which dominate in our sample: photometric redshifts of actively star forming galaxies are less reliable (the fraction of CE increases by a factor of∼ 5 from the elliptical to the starburst galaxies for a sample used by Ilbertet al., 2006).
Consequently, for the subsequent analysis we decided to usezCIGALE for sources without a knownzspectro. A more detailed comparison of the estimation of photometric red-shifts by Le PHARE and CIGALE can be found in Małek et al.(2013).
5.
SED Fitting
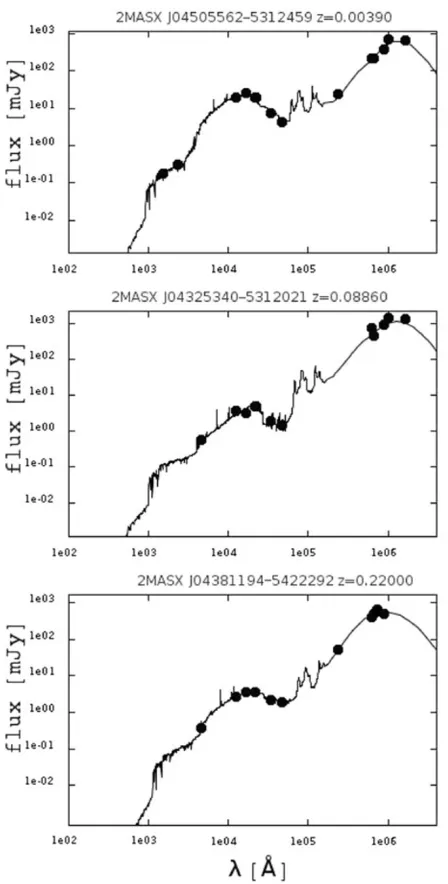
Fig. 3. Three examples of the best-fit models for the normal galaxy (upper panel), LIRG (middle panel) and ULIRG (bottom panel) sources. Solid lines correspond to the best model obtained from CIGALE code, and the full black circles—observed data used for SED fitting.
with at least six measurements in the whole spectral range. As a result, we use 222 galaxies: 95 sources withzspectro and 127 galaxies withzCIGALE. All available photometric measurements for these galaxies were used for the SED fitting with CIGALE.
CIGALE uses models describing the emission from a galaxy in the wavelength range from the rest-frame far-UV to the rest-frame far-IR (Nollet al., 2011). The code de-rives physical parameters of galaxies by fitting their spectral energy distributions (SEDs) to SEDs based on models and templates. CIGALE takes into account both the dust UV attenuation and IR emission. Based on possible values for each physical parameter related to star formation history, dust attenuation, and dust emission, CIGALE computes all possible spectra and derives mean fluxes in the observed fil-ters. For each galaxy, the best value for each parameter, as
well as the best fitted model, is found using a Bayesian-like statistical analysis (Roehllyet al., 2012).
Models of stellar emission are given either by Maras-ton (2005) or Fioc and Rocca-Volmerange (1997). The absorption and scattering of stellar light by dust, the so-called attenuation curves for galaxies, are given by Calzetti et al.(2000). Dust emission is characterized by a power-law model proposed by Dale and Helou (2002), with the slopeαSED of the relation between the dust mass and the heating intensity. This is the only dust emission model in-cluded in the newest CIGALE distribution (CIGALE ver-sion 2013/01/02).
To reconstruct more accurately Star Formation Rates (SFRs), CIGALE uses the single stellar population of Maraston (2005). For the old stellar population, CIGALE calculates old stellar population history (SFH1) with expo-nential decrease:
SFR1=
Mgal
τ1(e1/τ1−1)
(3)
In our work we have adopted the box model for the young stellar population history (SFH2), with constant star forma-tion over a limited period of time, starting from 0.0025 to 1 Gyr ago (parametert2 in Table 1). In the case of a box model, the SFH2 is computed as the galaxy mass divided by its age. Thus, CIGALE gives a total value of logSFR, defined as:
SFR=(1−fySP)SFR1+fySPSFR2, (4)
where fySPis the fraction of the young stellar population. The list of input parameters of CIGALE is shown in Table 1.
The reliability of the retrieved parameters for galaxies with known spectroscopic redshifts was checked using the mock catalogue of artificial galaxies (Małeket al., 2013). The comparison between the results from the mock and real catalogues shows that CIGALE gives a very good estima-tion of stellar masses, star formaestima-tion rates, ages sensitivity D4000 index, dust attenuations and dust emissions, bolo-metric and dust luminosities (with values of the linear Pear-son moment correlation coefficient,r, higher than 0.8). The accuracy of the relation between the dust mass and the heat-ing intensity,αSED, is estimated with a lower efficiency (r= 0.55).
6.
Physical Properties of ADF–S Sample
We restrict the further analysis to the SEDs with a mini-mum value ofχ2lower than four.
This condition was met by 186 galaxies (73 galaxies with zspectroand 113 sources with an estimatedzCIGALE). Conse-quently, we assume that SEDs were successfully fitted only for this final sample. The redshift distribution of this sample is shown in Fig. 4. Examples of the best fit models obtained from CIGALE are given in Fig. 3.
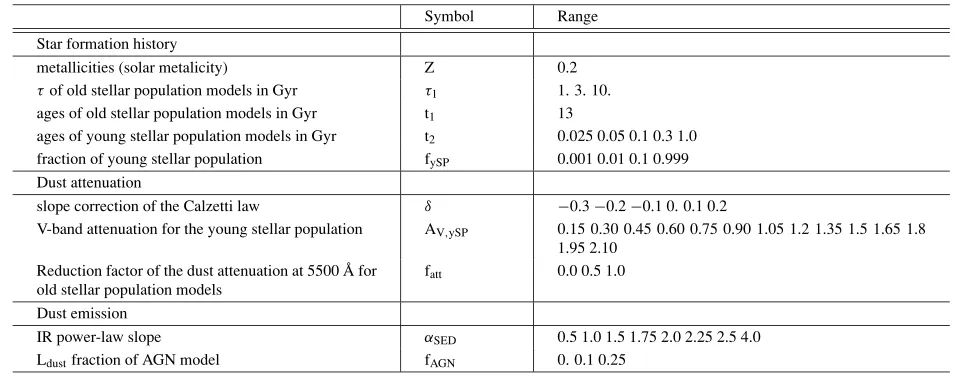
Table 1. List of the input parameters of CIGALE, based mostly on Buatet al.(2011).
Symbol Range
Star formation history
metallicities (solar metalicity) Z 0.2
τof old stellar population models in Gyr τ1 1. 3. 10.
ages of old stellar population models in Gyr t1 13
ages of young stellar population models in Gyr t2 0.025 0.05 0.1 0.3 1.0 fraction of young stellar population fySP 0.001 0.01 0.1 0.999 Dust attenuation
slope correction of the Calzetti law δ −0.3−0.2−0.1 0. 0.1 0.2
V-band attenuation for the young stellar population AV,ySP 0.15 0.30 0.45 0.60 0.75 0.90 1.05 1.2 1.35 1.5 1.65 1.8 1.95 2.10
Reduction factor of the dust attenuation at 5500 ˚A for old stellar population models
fatt 0.0 0.5 1.0
Dust emission
IR power-law slope αSED 0.5 1.0 1.5 1.75 2.0 2.25 2.5 4.0
Ldustfraction of AGN model fAGN 0. 0.1 0.25
Fig. 4. The distribution of redshifts in our final sample (both spectroscopic and estimated by CIGALE).
are rather luminous Lbol=10.81±0.93·1010[L
], and also their dust luminosity is high Ldust=10.38±1.01·1010[L], but without a precisely defined maximum. A median value of the star formation rate parameter, SFR, is equal to 2.22 [Myr−1]. The estimated value of the heating intensity
αSED(Dale and Helou, 2002) implies that the vast major-ity of analysed galaxies (85.48%) belong to a normal, star-forming galaxy population, with the median value ofαSED equal to 2.01. The median value of the AVparameter, de-scribing the effective dust attenuation for the stellar popu-lation at a wavelength equal to 5500 ˚A is 0.47 [mag], and the median value for the attenuation in the FUV (at 1500
˚
A, AFUV) is 1.87 [mag]. The parameter AV,ySP, which de-scribes the V-band attenuation for the young stellar popula-tion model, spreads almost across the entire range of input parameters from 0.15 to 2.19, with the median value 0.97 [mag].
7.
Average Spectral Energy Distributions
Using the CIGALE output, we created average SEDs from our 186 galaxies. First, we normalized all SEDs at a rest frame 90μm; then we divided them into 3 broad cat-egories: Ultraluminous Infrared Galaxies (ULIRGs), Lumi-nous Infrared Galaxies (LIRGs), and the remaining galax-ies.
Following Sanders and Mirabel (1996), we define ULIRGs as galaxies with a very high IR luminosity, LTIR>1012L, where LTIR is the total mid- and far-infrared luminosity calculated in the range between 8(1+z)
μm and 1(1+z)mm. Sources with less extreme, but still high, IR luminosities 1011L
<LTIR<1012L are classi-fied as LIRGs. In our sample, we found 18 ULIRGs (9.7% of analysed ADF–S sources) and 30 LIRGs (16.1% of the total number of sources).
Average SEDs for ULIRGs, LIRGs and the remaining galaxies are plotted in Fig. 6.
The ratio of bolometric to total mid- and far-infrared luminosity (the integrated luminosities calculated from CIGALE) is higher for the ULIRGs and LIRGs than for the normal galaxies. In the case of the average SEDs, the Lbol/LTIRratio is equal to 0.73±0.16 for the ULIRGs, 0.55
±0.16 for the LIRGs, and 0.39±0.22 for the remaining galaxies. Both ULIRGs and LIRGs in our sample contain dust which is cooler than the dust in the remaining galaxies, which can be seen as a shift of the maximal values of the dust components towards longer wavelengths. The brighter the sample is in the IR, the more shifted is the dust peak towards the longer wavelengths. In our sample, the maxi-mum of the dust peak in the spectra normalized to 90μm is located at 1.38·106A, 1.21˚ ·106A, and 8.65˚ ·105A for the˚ ULIRGs, LIRGs and normal galaxies, respectively.
The median redshift for ULIRGs in our sample is equal to 0.54. The median redshift for LIRGs, and the remaining galaxies was found to be 0.2, and 0.04, respectively. This difference in redshifts is a selection effect, related to the fact that the primary detection limit is in the FIR. The two parameters SFR and LTIRmight be correlated because both of them depend on the galaxy mass, but they are estimated independently. For the ULIRGs, the logSFR is very high, with a mean value 2.59±0.32 [Myr−1]. The SFR for the LIRGs is more than ten times lower (the mean logSFR is equal to 1.47±0.28 [Myr−1]).
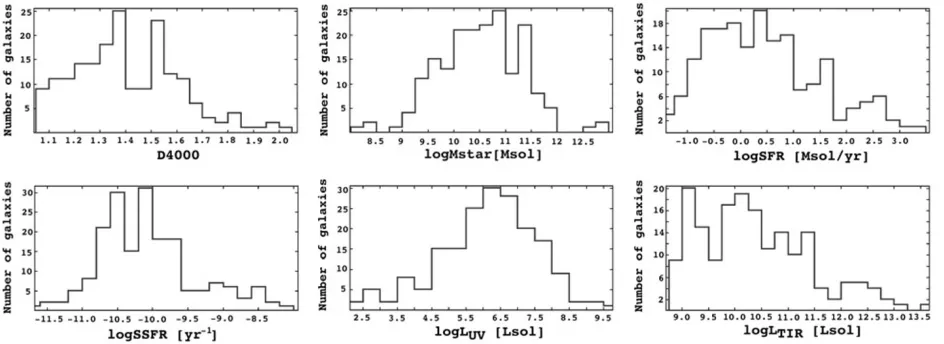
simi-Fig. 5. Distribution of the Bayesian estimates of the output parameters: D4000, Mstar, and logSFR. SSFR values were calculated as the ratio of SFR and Mstar. LUV, and LTIRwere calculated as an integral value of SEDs from 1480·(1+z)to 1520·(1+z)A, and from 8˚ ·(1+z) μm to 1·(1+z)mm, respectively.
Fig. 6. The average SEDs, normalized at 90μm, of ULIRGs (dashed line), LIRGs (dotted line) and the remaining galaxies (solid line). SEDs were shifted to the rest frame.
lar range of SFR: 0–12 [Myr−1] for the ADF-S, and 0–15 [Myr−1] for the SINGS sample.
Comparing the results obtained by Uet al.(2012) for a sample of 53 LIRGs and 11 ULIRGs in the similar red-shift range (z between 0.012 and 0.083) from the Great Observatories All-sky LIRG Survey (GOALS), we found a very good agreement of SFR for LIRGs (logSFRLIRGs = 1.57±0.19[Myr−1]). The mean value of logSFRULIRGs in the case of our ADF–S sample is higher than the one found by Uet al.(2012) and equals logSFRULIRGs=2.25± 0.16Myr−1, but is still consistent within the error bars.
The LIRGs in the ADF-S sample have a mean logMstar at 11.15±0.49 [M]. This value is slightly higher than logMstar for LIRGs reported by Uet al.(2012) (10.75 ± 0.39 [M]), Giovannoliet al.(2011) (LIRGs sample, with logMstar between 10 and 12, and with a peak at 10.8), and Melbourne et al. (2008) (logMstar ∼ 10.5, based on a set 15 LIRGs, at redshift∼0.8). Even though our re-sult shows the highest value of logMstar, it is still consistent with the values listed above within the error bars. Stellar
masses for the ULIRG sample have a mean logMstarequal to 11.43 ± 0.31 [M]. The mean stellar masses for 11 ULIRGs presented by Uet al. (2012) were calculated as logMstar = 11.00±0.40[M]. The sample of ULIRGs analysed by Howellet al.(2010) is characterized by a mean stellar mass logMstar = 11.24±0.25[M]. We conclude that the (U)LIRGs in our ADF-S sample are slightly more massive than those in the samples used in previous works, but still all the samples are statistically consistent.
Figure 7 shows the relation between the SFRs and stel-lar masses for (U)LIRGs in our ADF–S catalogue. The mean redshift of the (U)LIRG sample is equal to 0.34 (min-imum and max(min-imum redshifts are equal to 0.09 and 0.98, respectively - then, the redshift distribution is quite broad). We compared our results with observations at redshifts 0 and 1 (Elbazet al., 2007), and 2 (Daddiet al., 2007), and also with other data mentioned above: a sample of nearby (z < 0.032) (U)LIRGs (Uet al., 2012), and a sample of LIRGs observed in the GOALS by GALEX and the Spitzer Space Telescope (Howellet al., 2010). We found a rather flat distribution of the SFR parameter in the stellar mass space (similar to Giovannoliet al. (2011), who found for a sample of LIRGs in the Extended Chandra Deep Field South atz = 0.7, selected at 24μm by Spitzer). Our re-sults, shown in Fig. 7, confirm a strong correlation between SFR and redshift.
Based on the physical properties obtained from SED fit-ting, we computed the Specific Star Formation Rates (SSFR [yr−1]; defined as the ratio of SFR and stellar mass) for the ADF–S sample. The SSFR rate is commonly used to analyse star formation history. For ULIRGs, LIRGs, and the rest of our sample, the logarithmic values of the SSFR parameter are equal to−9.00±0.55,−9.68±0.59, and
Fig. 7. The SFR vs stellar mass relation for ADF–S (U)LIRG sample (black circles). The variable size of points represents the difference in redshift (increasing size fromzequal to 0.09 to 0.98). We overplot the Howellet al.(2010) GOALS sample (open triangles), and Uet al.(2012) (U)LIRG sample (open squares). The two solid black lines correspond to the SFR-Mstar observation from Elbazet al.(2007). The dashed line indicates the SFR—stellar mass relation for star-forming galaxies atz∼2 defined by Daddiet al.(2007).
ADF–S sample is equal to−9.51 [yr−1]. We conclude that our results are consistent with the results mentioned in all the other works considered for comparison.
However, the dust emission power-law model, given by Dale and Helou (2002), implemented in CIGALE may not be efficient enough to describe the properties of the (U)LIRG sample well. In the future, we plan to apply other models (e.g. Siebenmorgen and Kr¨ugel, 2007; Chary and Elbaz, 2001; Casey, 2012) to the same (U)LIRGs sample.
8.
Conclusions
1) For our analysis, we used an AKARI ADF–S cata-logue (Małeket al., 2010), with additional information about spectroscopic redshifts (Małeket al., 2013) 2) The CIGALE (Nollet al., 2009), program for fitting
SEDs, was used for the first time to estimate photo-metric redshifts for galaxies without known spectro-scopic redshifts (127 galaxies), and then to fit Spec-tral Energy Distribution models to our whole sample. We conclude that although CIGALE was not designed as a tool for the estimation ofzphot, in the case of the ADF–S galaxies it is more efficient than the standard code (Le PHARE), based on the UV and optical data. This observation might be worth taking into account for IR-selected galaxies in the future analysis. 3) We used CIGALE for the redshift estimation for 127
galaxies with at least 6 photometric measurements in the whole spectral range, from UV to FIR. A satisfac-tory value of theχ2parameter for the fit, lower than 4, was obtained for 186 galaxies.
4) Based on the physical parameters obtained from SED fitting, we conclude that our FIR selected sample con-sists mostly of nearby, massive galaxies, bright in the IR, and active in SF (a similar conclusion was found by Whiteet al., 2012). The distribution of the SFR
shows that our sample is characterized by a rather high star formation rate, with a median value equal to 1.96 and 2.56 [Myr−1], for galaxies with a spectroscopic and estimated photometric redshift, respectively, 5) Average SEDs for ULIRGs, LIRGs and remaining
galaxies from our sample, normalized at 90μm were created. Almost 25% of our sample are (U)LIRGs, rich in dust and active in star formation processes. For these galaxies we noticed a significant shift in the peak wavelength of the dust emission in the FIR and a dif-ferent ratio between luminosities in the optical and IR parts of the spectra.
Acknowledgments. We would like to thank both anonymous Reviewers for their very constructive comments and sugges-tions which helped to improve the quality of this paper. We thank Olivier Ilbert for useful discussions and kind help in using Le PHARE. This work is based on observations with AKARI a JAXA project with the participation of ESA. This research has made use of the SIMBAD and NED databases. KM, AP and AK were financed by the research grant of the Polish Ministry of Sci-ence N N203 512938. The collaboration between French and Pol-ish participants was partially supported by the European Associ-ated Laboratory Astrophysics Poland-France HECOLS. This re-search was partially supported by the project POLISH-SWISS AS-TRO PROJECT co-financed by a grant from Switzerland through the Swiss Contribution to the enlarged European Union. KM has been supported from the Japan Society for the Promotion of Science (JSPS) Postdoctoral Fellowship for Foreign Researchers, P11802. TTT has been supported by the Grant-in-Aid for the Sci-entific Research Fund (20740105, 23340046, and 24111707) and for the Global COE Program Request for Fundamental Principles in the Universe: from Particles to the Solar System and the Cos-mos commissioned by the Ministry of Education, Culture, Sports, Science and Technology (MEXT) of Japan. VB and DB have been supported by the Centre National des Etudes Spatiales (CNES) and the Programme National Galaxies (PNG). MM acknowledges support from NASA grants NNX08AU59G and NNX09AM45G for the analysis of GALEX data in the Akari Deep Fields.
References
Arnouts, S., S. Cristiani, L. Moscardiniet al., Measuring and modelling the redshift evolution of clustering: the Hubble Deep Field North,Mon. Not. R. Astron. Soc.,310, 540–556, 1999.
Beichman, C. A., The IRAS view of the Galaxy and the solar system,Ann. Rev. Astron. Astrophys.,25, 521–563, 1987.
Buat, V., J. Iglesias-P´aramo, M. Seibertet al., Dust Attenuation in the Nearby Universe: A Comparison between Galaxies Selected in the Ul-traviolet and in the Far-Infrared,Astrophys. J.,619, L51–L54, 2005. Buat, V., E. Giovannoli, and T. T. Takeuchiet al., Spectral energy
distribu-tions of an AKARI-SDSS-GALEX sample of galaxies,Astron. Astro-phys.,529, A22, 2011.
Calzetti, D., L. Armus, R. C. Bohlinet al., The dust content and opacity of actively star-forming galaxies,Astrophys. J.,533, 682–695, 2000. Casey, C. M., Far-infrared spectral energy distribution fitting for galaxies
near and far,Mon. Not. R. Astron. Soc.,425(4), 3094–3103, 2012. Chary, R. and D. Elbaz, Interpreting the cosmic infrared background:
Constraints on the evolution of the dust-enshrouded star formation rate,
Astrophys. J.,556(2), 562–581, 2001.
Daddi, E., M. Dickinson, G. Morrisonet al., Multiwavelength study of massive galaxies at z∼2. I. Star formation and galaxy growth, Astro-phys. J.,670(1), 156–172, 2007.
Dale, D. A. and G. Helou, The infrared spectral energy distribution of nor-mal star-forming galaxies: Calibration at far-infrared and submillimeter wavelengths,Astrophys. J.,576, 2002.
Dale, D. A., A. Gil de Paz, K. D. Gordonet al., An ultraviolet-to-radio broadband spectral atlas of nearby galaxies,Astrophys. J.,655, 863– 884, 2007.
Experi-ment Point Source Catalog Version 2.3 (October 2003), 2114, 2003. Elbaz, D., E. Daddi, D. Le Borgneet al., The reversal of the star
formation-density relation in the distant universe,Astron. Astrophys.,468(1), 33– 48, 2007.
Fioc, M. and B. Rocca-Volmerange, PEGASE: a UV to NIR spectral evolution model of galaxies. Application to the calibration of bright galaxy counts,Astron. Astrophys. via CDS,326, 950–962, 1997. Genzel, R. and C. J. Cesarsky, Extragalactic results from the infrared space
observatory,Ann. Rev. Astron. Astrophys.,38, 761–814, 2000. Giovannoli, E., V. Buat, S. Nollet al., Population synthesis modelling of
Luminous Infrared Galaxies at intermediate redshift,Astron. Astrophys., 525, A150, 2011.
Glass, I. S.,Handbook of Infrared Astronomy, edited by Ellis, R., J. Huchra, S. Kahn, G. Rieke, and P. B. Stetson, 185, Cambridge Observ-ing Handbooks for Research Astronomers, 1999.
Howell, J. H., L. Armus, J. M. Mazzarellaet al., The great observatories all-sky LIRG survey: Comparison of ultraviolet and far-infrared proper-ties,Astrophys. J.,715, 572–588, 2010.
Ilbert, O., S. Arnouts, H. J. McCrackenet al., Accurate photometric red-shifts for the CFHT legacy survey calibrated using the VIMOS VLT deep survey,Astron. Astrophys.,457, 841–856, 2006.
Kawada, M., H. Baba, P. D. Barthelet al., The far-infrared surveyor (FIS) for AKARI,Publ. Astron. Soc. Jpn.,59, 389, 2007.
Kennicutt, Jr., R. C., L. Armus, G. Bendoet al., SINGS: The SIRTF Nearby Galaxies Survey,Publ. Astron. Soc. Pac.,115, 810, 928–952, 2003.
Małek, K., A. Pollo, T. T. Takeuchiet al., Star forming galaxies in the AKARI deep field south: identifications and spectral energy distribu-tions,Astron. Astrophys.,514, 511+, 2010.
Małek, K., A. Pollo, T. T. Takeuchiet al., Properties of star forming galax-ies in AKARI Deep Field-South,Astron. Astrophys., 2013 (submitted). Maraston, C., Evolutionary population synthesis: models, analysis of the
ingredients and application to high-z galaxies,Mon. Not. R. Astron. Soc.,362, 799–825, 2005.
Matsuura, S., M. Shirahata, M. Kawadaet al., Detection of the cosmic far-infrared background in AKARI deep field south,Astrophys. J.,737, 2, 2011.
Melbourne, J., M. Ammons, S. A. Wrightet al., Triggered or self-regulated star formation within intermediate redshift luminous infrared galaxies. I. Morphologies and spectral energy distributions,Astron. J.,135, 1207– 1224, 2008.
Murakami, K., H. Baba, P. D. Barthelet al., The Infrared Astronomical Mission AKARI,Publ. Astron. Soc. Jpn.,59, 396, 2007.
Neugebauer, G., H. J. Habing, R. van Duinenet al., The Infrared Astro-nomical Satellite (IRAS) mission,Astrophys. J.,278, 1984.
Noll, S., D. Burgarella, E. Giovannoliet al., Analysis of galaxy spectral
energy distributions from far-UV to far-IR with CIGALE: studying a SINGS test sample,Astron. Astrophys.,507, 1793–1813, 2009. Noll, S., D. Burgarella, E. Giovannoliet al., Laboratoirse d’Astrophysique
de Marseille, Readme file: CIGALE, Bayesian-like analysis of galaxy SEDs from UV to IR, 2011.
Phillips, S.,The Structure and Evolution of Galaxies, 319 pp, ISBN 0-470-85507-X, Wiley-VCH, 2005.
Rieke, G. H., A. Alonso-Herrero, B. J. Weineret al., Determining star formation rates for infrared galaxies,Astrophys. J.,692, 556, 2009. Roehlly, Y., D. Burgarella, Buatet al., CIGALE: Code Investigating
GALaxy Emission, inAstronomical Data Analysis Software and Sys-tems XXI, Astronomical Society of the Pacific Conference Series, edited by P. Ballester, D. Egret, and N. P. F. Lorente, 461, 2012.
Sanders, D. B. and I. F. Mirabel, Luminous infrared galaxies,Ann. Rev. Astron. Astrophys.,749, 1996.
Sedgwick, C., S. Serjeant, C. Pearsonet al., Far-infrared luminosity func-tion of local star-forming galaxies in the AKARI Deep Field-South,
Mon. Not. R. Astron. Soc.,416, 1862–1870, 2011.
Siebenmorgen, R. and E. Kr¨ugel, Dust in starburst nuclei and ULIRGs. SED models for observers,Astron. Astrophys.,461(2), 445–453, 2007. Soifer, B. T., G. Helou, and M. Werner, The Spitzer view of the
extragalac-tic universe,Ann. Rev. Astron. Astrophys.,46, 201–240, 2008. Takagi, T., H. Matsuhara, T. Gotoet al., The AKARI NEP-Deep survey: a
mid-infrared source catalogue,Astron. Astrophys.,537, A24, 2012. Takeuchi, T. T., V. Buat, and D. Burgarella, The evolution of the ultraviolet
and infrared luminosity densities in the universe at 0<z<1,Astron. Astrophys.,440, L17–L20, 2005.
U, V., D. B. Sanders, J. M. Mazzarellaet al., Spectral energy distributions of local luminous and ultraluminous infrared galaxies,Astrophys. J. Suppl.,203, 1, 2012.
Verma, A., V. Charmandaris, U. Klaaset al., Obscured activity: AGN, quasars, starbursts and ULIGs observed by the infrared space observa-tory,Space Sci. Rev.,119, 355–407, 2005.
Wada, T., H. Matsuhara, S. Oyabuet al., AKARI/IRC deep survey in the north ecliptic pole region,Publ. Astron. Soc. Jpn.,60, 517, 2008. White, G. J., B. Hatsukade, and C. Pearson, A deep ATCA 20cm radio
survey of the AKARI deep field south near the south ecliptic pole,Mon. Not. R. Astron. Soc.,427(3), 1830–1846, 2012.
Wright, E. L., P. R. M. Eisenhardt, A. K. Mainzeret al., The Wide-field Infrared Survey Explorer (WISE): Mission description and initial on-orbit performance,Astron. J.,140, 1868–1881, 2010.