FULL PAPER
On the detection of the Wilkes Land
impact crater
Jaroslav Klokočník
1*, Jan Kostelecký
2,3and Aleš Bezděk
1,4Abstract
The definitive existence of a giant impact crater, two times larger than the Chixulub crater in the Yucatan peninsula, from an extraterrestrial origin, 1.6 km beneath Wilkes Land, East Antarctica, remain controversial. Here, we use the latest high-resolution gravito-topographic geopotential (SatGravRET 2014) model over Antarctica to offer a plausi-ble confirmation of its existence. SatGravRET 2014 has a spatial resolution between 1 and 10 km at most places and included contemporary space gravimetry and gradiometry data from GRACE and GOCE, and other data including Bedmap 2 bedrock topography. We computed the gravity disturbances, the Marussi tensor of the second derivatives of the disturbing potential, the gravity invariants and their specific ratio, the strike angles and the virtual deformations to quantify the detailed geophysical features for the Wilkes Land anomaly. This set of the gravitational parameters revealed enhanced and more detailed geophysical features on the Wilkes Land Crater than previously possible only with the traditional gravity anomalies. Our findings support prior studies stating that in the Wilkes Land there is a huge impact crater/basin with detectable gravity mascon which is mostly consistent with the characteristics of an impact crater.
Keywords: East Antarctica, Wilkes Land anomaly, Impact crater/basin/mascon, Antarctic gravito-topographic model, Gravity aspects
© The Author(s) 2018. This article is distributed under the terms of the Creative Commons Attribution 4.0 International License (http://creat iveco mmons .org/licen ses/by/4.0/), which permits unrestricted use, distribution, and reproduction in any medium, provided you give appropriate credit to the original author(s) and the source, provide a link to the Creative Commons license, and indicate if changes were made.
Motivation, method, and data Motive and aim
This paper has been written with one of the aims to con-firm prior published controversial findings, including von Frese et al. (2013) and Weihaupt et al. (2015) arguing that the Wilkes Land anomaly beneath the ice in East Antarc-tica is consistent with the geophysical characteristics of an impact crater/basin. The Wilkes Land anomaly (also known as the Wilkes Land) is centered at ϕ= –70°S and
λ= 120°E. Von Frese et al. (2009) described the possibility of existence of a huge impact crater basin. We have ana-lyzed the most recent gravity field model tailored for Ant-arctica. We used it to compute not only the traditional gravity anomalies but a whole spectrum of functions of the disturbing gravitational potential of the Earth (called here: the gravity aspects), thus providing more detailed
information about the putative crater, basin, mascon and its possible enjambement to southern Australia. We also work with bedrock topography model Bedmap 2 (pub-lished in 2013); for references see below.
A giant impact crater beneath the Wilkes Land ice sheet was first proposed by Schmidt (1962); the hypoth-esis was developed by Weihaupt (1976), challenged by Bentley (1979) and supported by Weihaupt (2010). The Wilkes Land anomaly or mascon was first reported by von Frese et al. (2006, 2009) analyzing satellite grav-ity data available at that time. They used data from the GRACE mission (Gravity recovery and climate experi-ment, see, e.g., https ://www.nasa.gov/missi on_pages / Grace /index .html) in spherical harmonic expansion to degree and order 90 (half-wavelength resolution on the ground ~ 200 km); they worked with gravity anoma-lies and the derived first vertical derivative of them to enhance the resolution and the accuracy of the Wilkes Land anomaly. Their findings were further supported by magnetic data in von Frese et al. (2013) and by Weihaupt et al. (2015). The latter authors wrote: “…recent data from
Open Access
*Correspondence: jklokocn@asu.cas.cz
1 Astronomical Institute, Czech Academy of Sciences, 251 65 Ondřejov, Fričova 298, Czech Republic
various sources revealed that the structure has a diameter of some 510 km, …, has a subglacial topography relief of
≥ 1500 m, and exhibits a negative free air gravity anomaly associated with a larger central positive free air gravity anomaly…”. A more comprehensive review of the Wilkes Land anomaly, and its plausible origin, is described in detail by Weihaupt et al. (2015).
The primary objective of this study is to use recently available high-resolution gravity and subglacial topogra-phy models to provide an independent assessment and to contribute positively to the hypothesis claiming that the Wilkes lowland is an impact crater (basin).
In addition to the GRACE gravity model, the data in Antarctica were recently amended by a rich set of gra-diometry data from Gravity field and steady-state ocean circulation explorer (GOCE, see, e.g., http://www.esa. int/Our_Activ ities /Obser ving_the_Earth /GOCE; ESA 2014). Here, we use the gravity aspects computed from the recent SatGravRET 2014 model (shortly: RET 14, see Hirt et al. 2016) with spherical harmonic expansion to degree and order 2190 (half-wavelength resolution cor-responding to ~ 9 km spatial scale) for the study. They originated, roughly speaking, by combining the gravity model European improved gravity model of the Earth by new techniques (EIGEN 6C4; Foerste et al. 2014), also with the GOCE gradiometry data, and the bedrock topography from Bedmap 2 (Fretwell et al. 2013). We then compute various gravity functions (the aspects) of the disturbing gravitational potential in addition to the gravity anomalies. These are: the Marussi tensor of the second derivatives of the disturbing potential, the gravity invariants and their specific ratio, the strike angle and the
virtual deformations.
The results presented below support the hypothesis about the impact crater and mascon in the Wilkes Land and its possible continuation to present-day southern Australia. However, we are very well aware that the grav-ity data alone which is used in this study cannot provide the complete constraint to unravel the geophysical inter-pretation of the above.
Methodology
The core of our method is in the use of various gravita-tional aspects, namely the gravity anomalies or distur-bances Δg, the components of the Marussi tensor Γ of the second derivatives Tij of the disturbing potential,
the gravity invariants I1 and I2, their specific ratio I, the strike angle θ and the virtual deformations vd. Every sin-gle one gravity aspect tells its own “story” about density and in turn about gravity anomalies. By “topography,” we mean the bedrock topography, derived mainly from air-borne ice-penetrating radars (Bedmap 2). All the gravity
aspects and the bed topography create a composite data set which should always be accounted for together.
The theory underlying our methodology is described mainly in Pedersen and Rasmussen (1990) and Beiki and Pedersen (2010). The new contribution of this study is related to the computation of all gravitational aspects listed above including the virtual deformation, vd, which comes from Kalvoda et al. (2013). A more complete review of the theory (and examples) used for this study is in Klokočník et al. (2016, 2017a, b).
The Marussi tensor provides more complex informa-tion than the gravity anomalies (or disturbances) Δg only;
Tzz informs about the target body location, the other
components Tij of Γ refer to the orientation of the
causa-tive structure. The components Tij provide sharpening of
the anomalies and enhancements of the high-frequency content without changes in the location or shapes of the anomalies (e.g., Saad 2006). The invariants I1 and I2 can be looked upon as nonlinear filters enhancing the sources having big volumes; they discriminate major density anomalies into separate units. The specific ratio I (some-times called “2D indicator”) of I1 and I2 can indicate two-dimensionality of the causative body (e.g., Pedersen and Rasmussen 1990, p. 1559; Jekeli 2009, p. 120). The condi-tion I= 0 is necessary but not a sufficient condition for two-dimensionality. The strike angle θ tells us how the measurements (used to derive Γ) rotate within the main directions of the underground structure; when I= 0, the values of θ may indicate a dominant 2D structure. The virtual deformation vd, as an analogy to the tidal defor-mation, characterizes the “tensions” (compression and dilatation) generated by the causative body; one can imagine the directions of such a deformation due to “ero-sion” brought about solely by “gravity origin” (Klokočník et al. 2013, p. 90).
Many examples of the local use of some of the gravity aspects (mostly Δg, sometimes also or solely Tij, seldom I1 and I2 or θ) can be found in the literature (see, e.g., Saad 2006; Murphy and Dickinson 2009; Mataragio and Kieley 2009; Beiki and Pedersen 2010). Our theory, method and notation (with various results for different parts of the world) can be found in Kalvoda et al. (2013), Klokočník and Kostelecký (2015) or Klokočník et al. (2010, 2013, 2014, 2016, 2017a, b, 2018). The computations of all the aspects listed above were done by the software developed by B. Bucha (see Bucha and Janák 2013) and by our own software.
“Gravito‑topographic” gravity model over Antarctica
computed as a double summation of the Stokes coeffi-cients, Clm, Slm, to degree l and order m, derived usually
from a combination of diverse satellite and terrestrial data. The “topography” is represented by a model of the bedrock topography for Antarctica achieved domi-nantly but not only via the airborne radio-echo sound-ing (RES) techniques.
We use the best data now available. In particular, we work with RET 14 (Hirt et al. 2016). It is a degree-2190 gravity field model SatGravRET2014, given as a set of harmonic geopotential coefficients, meaningful for the continent of Antarctica (not for all the world). Roughly speaking, it combines the global gravity field model
EIGEN 6C4 and the Bedmap 2 topography. The EIGEN 6C4 Foerste et al. 2014) is a global combined gravity solution including gradiometry data from the whole GOCE mission. The important fact is that EIGEN 6C4 is better and higher resolution gravity model namely in Antarctica in a comparison with its predecessors. Note that EIGEN 6C4 is free of gravity anomalies measured in Antarctica (it contains there only satellite data from GRACE, GOCE and other satellites).
More precisely: the RET 14 combines predecessors of EIGEN 6C4 with other and very important gravity data sets; it combines the ITG-GRACE2010s and the unconstrained GOCE TIM5 satellite gravity models to degree and order 180 (for references see Foerste et al. 2014). These models describe the long- and medium-wavelength components of the Earth’s static gravity field from GRACE and GOCE missions. The “non-grav-ity” data to RET 14 come from the Earth 2014 1 arcmin global topography model (Hirt and Rexer 2015) which incorporates the Bedmap 2 bedrock topography (see below) and the other data sets; these are topography from the Shuttle Radar Topography Mission (SRTM), Greenland Bedrock Topography v3 and SRTM30_PLUS v9 bathymetry (for more references see Hirt et al. 2016).
Bedmap 2 (Fretwell et al. 2013) contains the bedrock elevation beneath the grounded ice sheet. It is given as a 1 × 1 km grid of heights of the bedrock above sea level; the actual spatial resolution is worse, say 5 × 5 km (but not everywhere). The bedrock topography for Ant-arctica has been achieved mostly via the RES data. The resolution and quality are still much worse in some areas with rare data or without any data (see Figs. 3, 12 and other material in Fretwell et al. 2013, esp. pp. 379 and 388), see Fig. 5. The authors themselves call these two big areas (Recovery and Support Force Glaciers and Princess Elizabeth Land) “poles of ignorance”; they do not concern this analysis.
RET14 increases the resolution of underlying gravity field models and decreases the resolution of Bedmap
2; generally, the spatial resolution of RET14 should be about 10 km over the area of our interest.
Precision in RET 14 should be about 10 mGal, but is not homogeneous over the whole continent of Antarc-tica. For EIGEN 6C4, based on information deduced from (Pavlis et al. 2012; Foerste et al. 2014; Fretwell et al. 2013; Hirt et al. 2016), we estimated 10 mGal as a pessi-mistic limit. These statistical estimates are available only for the gravity anomalies/disturbances in the fundamen-tal source Pavlis et al. (2012). In Klokočník et al. (2017a), we studied this problem (see Section Discrimination cri-terion in that paper) and found that owing to mutual high correlations of the gravity disturbances for close locali-ties, the error of Δg in EIGEN 6C4 can be about 5 mGal. For RET 14, this should be still better, a few milligals; this number (2–3 mGal) is considered here as a rough error estimate of Δg in RET 14. But, again, this optimistic num-ber is not valid anywhere in Antarctica.
Color figures presented here have various nonlin-ear scales to emphasize specific features and details. The gravity disturbances are in given milliGals [mGal], the second-order derivatives are in Eötvös [E]. Recall that 1 mGal= 10−5 ms−2, 1E≡ 1 Eötvös = 10−9 s−2. The invariants have units [s−4] and [s−6]. The virtual defor-mations (vd) are shown in blue color, where compres-sion takes place and in red where dilatation occurs. The bedrock topography from Bedmap 2 yields heights above present-day sea level (asl) in [m]; here the topography is presented in the same system as the gravitational aspects, i.e., in the geographic coordinates ( ϕ , λ), related to the reference ellipsoid WGS 84; sometimes we append the original coordinate system of Bedmap 2, i.e., the rectan-gular system of coordinates (x, y), northing/easting (in [km]). Both types of maps are in the polar stereographic projection with a geographic latitude of true scale at 71°S (which is an optimum choice for Antarctica). This is not true for the zooms.
The results and discussion The results
For our computations, we used RET 14 and Bedmap 2 (and EIGEN 6C4 alone only for South Australia). We pre-sent a choice of the relevant disturbances Δg, the compo-nent Tzz of Γ, I1, I2, I, θ, vd and the bed topography; due to space reasons we cannot present all the gravity aspects.
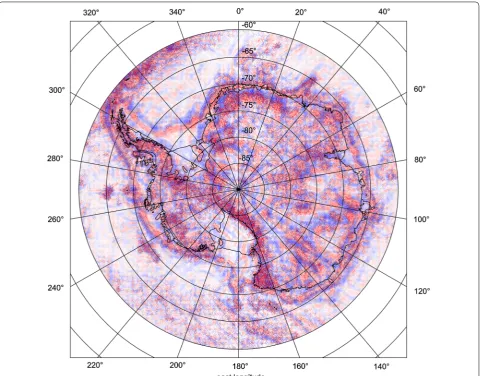
First, we introduce Δg and vd for the whole Antarctica (Figs. 1, 2). The putative Wilkes Land mascon is centered at ϕ= –70°S and λ= 120°E (von Frese et al. 2009, 2013). The Wilkes Land anomaly is clearly visible as a semicir-cular structure (the northern part is deformed roughly at seashore). Then, we inform about the bedrock topogra-phy in the same area according to the Bedmap 2 model; in color in Fig. 3, in black and white in Fig. 4. The subglacial
topography also exhibits a semicircular pattern. The cov-erage of ground tracks in Bedmap 2 is shown in Fig. 5; we can see the lines with measurements and with data and the gaps without data between them, like a fan (spreading from a seashore station). One has to be aware of this data distribution (Figs. 4, 5) and consequent limitations when interpreting RET 14.
We continue in the range of latitudes and longitudes of Fig. 3 and show Δg, Tzz, I1, I2, and vd in the series of Figs. 6, 7, 8, 9 and 10. Reader can see semicircular shape namely by Δg, Tzz and vd, interrupted on the northern
side by the ocean. Central part of the impact structure, belonging to the mascon (centered at ϕ= –70°S and
λ= 120°E), yields positive Δg and Tzz but due to various
geological processes after the impact, we can detect river
Fig. 2 The values of the virtual deformations vd (in blue for compression, in red for dilatation) for the whole Antarctica. The Wilkes Land anomaly is clearly visible as a semicircular feature with alternating compression and dilatation semirings, fragmented
Fig. 3 Bedrock topography (Bedmap 2) in the Wilkes Land area, absolute sea level [m]. Blue color indicates the height below the present-day sea level
valleys and similar details crossing this area. The positive part is surrounded, namely from southern directions, by significant negative values of Δg and Tzz of semicircular
shape. As for vd, Fig. 10 shows the compression zones (in blue color) around the former mascon.
Our figures document that the Wilkes Land anomaly is a candidate for the greatest impact crater or the only one impact basin known till now on the Earth (over 500 km diameter), partly preserved and now hidden under the ice or sea.
Discussion
The putative Wilkes Land mascon is centered at ϕ= –70°S and λ= 120°E (von Frese et al. 2009, 2013). We can now more evidently observe it in terms of the gravito-topo-graphic signal using RET 14 and Bedmap 2. There is no central peak typical of large impact craters (with a posi-tive Δg and Tzz, surrounded by their negative values, then
with positive values at a ring, etc.), there is a wide central area with prevailing positive Δg.
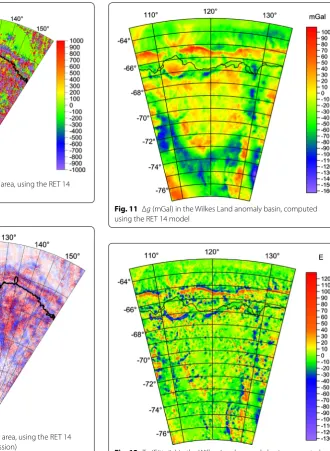
Figures 6, 7, 8, 9 and 10 confirm it (see previous subsec-tion). Moreover, we prepared zooms for the mascon; they are in Figs. 11 and 12 for Δg and Tzz, respectively. The
mascon is depicted very well as a significant Δg reaching more than + 100 mGal and Tzz reaching ~+ 100 E. It is
shown with various details, indicating influence of exter-nal and interexter-nal forces acting since the time of impact (a river valley), step by step degenerating the original grav-ity footprint.
The shape of the putative basin and its mascon is not perfectly circular, but rather semicircular, or of a U-shape; the northern (sea) side part is disrupted and fragmented. Accounting Fig. 2 from von Frese et al. (2013), we have to seek the gravity aspects at the southern Australia,
Fig. 5 Data distribution (mostly ground tracks of ice-penetrating radars RES) in Bedmap 2 in the Wilkes Land area (up to the subglacial Lake Vostok in west and Marie Byrd Land on east). Compare with Figs. 3 and 4. Reproduced from Fig. 3 in (Fretwell et al. 2013)
Fig. 6 Δg [mGal] in the Wilkes Land anomaly area, using the RET 14 model
Fig. 7 Tzz [E] in the Wilkes Land anomaly area, using the RET 14 model
Fig. 8 I1 [s−4] in the Wilkes Land anomaly area, using the RET 14
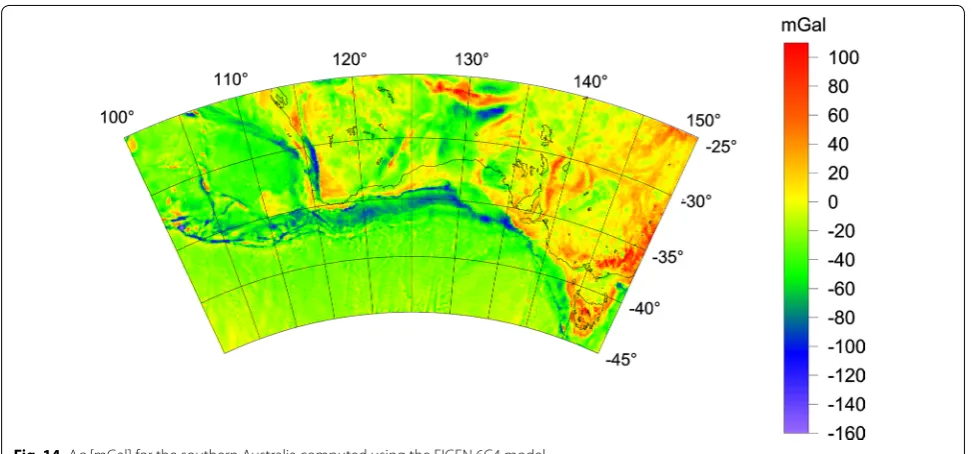
too, because there we may depict a “continuation” of the Wilkes Land anomaly from Antarctica. The area of investigation is shown in Fig. 13, and the results follow in Figs. 14, 15, 16, 17 and 18.
The series of Figs. 14, 15, 16, 17 and 18 illustrate a plausible continuation of the Wilkes Land anomaly from Antarctica to the southern Australia. We have to account for seashore zones where the crater/mascon is deformed and rings are fragmented. Reader can watch narrow belts of negative and positive Δg and Tzz along
South Australian coastline; he/she can follow vd in Figs. 10 and 18. One can imagine the central place of
the impact (roughly the northern seashore of Antarc-tica) now at ϕ= –70°S and λ= 120°E.
To further support our findings, and thus also con-clusions of von Frese et al. (2009, 2013), we prepared Fig. 19, a composite of Figs. 10 and 18, shifted signifi-cantly in latitude (to mask mostly SN motion due to plate tectonics) and slightly in longitude to achieve experimentally, by eye, the best fit of both parts in one unit. We guess it is convincing: two components evolv-ing from one piece in the past.
Fig. 9 I2 [s−6] in the Wilkes Land anomaly area, using the RET 14
model
Fig. 10 vd [–] in the Wilkes Land anomaly area, using the RET 14 model (red for dilatation, blue for compression)
Fig. 11 Δg (mGal) in the Wilkes Land anomaly basin, computed using the RET 14 model
These results widen space for geophysical inter-pretations and speculations. The huge impact had a planetary consequence, including for example the strik-ing antipodal relationship of it to the Siberian Raps
(claimed by von Frese et al. 2009). Therefore, we can look at various large mostly SN oriented depressions in Antarctica in south, west and east directions from the mascon, including the subglacial Lake Vostok, in new
Fig. 13 Southern Australia topography from Google Earth ©. The inset is a zoom-in map to recall the similarity of the coastlines of southern Australia and East Antarctica
eyes, as a part of or as an item among many conse-quences after the giant impact nearby. The impact may trigger separation of Antarctica from Australia.
Conclusion
By applying recent gravito-topographic models valid for Antarctica (SatGravRET 2014 and Bedmap 2), we support findings by von Frese et al. (2006, 2009), Wei-haupt et al. (2015) and others who claimed that in the Wilkes Land there is a huge impact basin with a mascon
centered at ϕ= –70°S and λ= 120°E from an extrater-restrial origin. This would be the greatest impact cra-ter known or the only one impact basin on the Earth preserved (but only partly and under the ice or sea) till the present, with over 500 km in diameter. The Wilkes anomaly in Antarctica has, according to our study, and in agreement with von Frese et al. (2013), a con-tinuation (shifted by plate tectonics since the time of separation) to the southern Australia. The geophysical structure is well visible with the virtual deformations. Nevertheless, the exact geophysical interpretation of
Fig. 15 Tzz [E] for southern Australia with EIGEN 6C4
Fig. 17 I2 [s−6] for southern Australia with EIGEN 6C4
Fig. 18 vd [–] for southern Australia with EIGEN 6C4
the continental dynamical process remains speculative. It is noted that the new gravito-topographic model Sat-GravRET 2014 that we used to conduct this study has about two orders better precision and resolution than that used by von Frese et al. (2006).
Abbreviations
GRACE mission: Gravity recovery and climate experiment; GOCE: Gravity field and steady-state ocean circulation explorer; EIGEN 6C4: European improved gravity model of the Earth by new techniques; RES: radar echo sounding; RET 14: Hirt et al. (2016); gravity field model SatGravRET2014.
Authors’ contributions
J. Klokočník is responsible for the concept and the text, J. Kostelecký partly for the theory, mostly for the figures and a part of software, A. Bezděk for computations and overall checks of everything. All authors read and approved the final manuscript.
Author details
1 Astronomical Institute, Czech Academy of Sciences, 251 65 Ondřejov, Fričova 298, Czech Republic. 2 Research Institute of Geodesy, Topography and Car-tography, 250 66 Zdiby 98, Czech Republic. 3 Faculty of Mining and Geology, VSB-TU Ostrava, 708 33 Ostrava, Czech Republic. 4 Faculty of Civil Engineering, Czech Technical University in Prague, 166 29 Prague 6, Czech Republic.
Acknowledgements
This work has been prepared in the frame of projects #13-36843S (Grant Agency of the CR) and RVO #679,858 15 (Czech Academy of Sciences), partly supported by the project LC 1506 (PUNTIS) from the Ministry of Education of the CR. We thank B. Bucha for the computations of the gravity aspects with EIGEN 6C4 and RET 14, H. D. Pritchard for his help with the bedrock topogra-phy data and Prof. C.K. Shum for reading and improving our manuscript. We are obliged to two anonymous reviewers for many useful comments.
Competing interests
The authors declare that they have no competing interests.
Availability of data and materials
We declare that input data from the models EIGEN 6C4, SatGravRET2014 or Bedmap 2 are generic (see the list of reference below). The outputs (the files to plot our figures) are available on request at the authors.
Funding
Work of J. Klokočník and A. Bezděk on the whole paper (data collection, analysis, interpretation of data, writing the manuscript) has been partly paid by the projects #13-36843S (Grant Agency of the Czech Republic, CR) and RVO #679,858 15 (Czech Academy of Sciences), work of J. Kostelecký (analysis, interpretation of data, plotting figures, writing the manuscript) was partly sup-ported by the project LC 1506 (PUNTIS) from the Ministry of Education of the CR.
Publisher’s Note
Springer Nature remains neutral with regard to jurisdictional claims in pub-lished maps and institutional affiliations.
Received: 26 April 2018 Accepted: 6 August 2018
References
Beiki M, Pedersen LB (2010) Eigenvector analysis of gravity gradient ten-sor to locate geologic bodies. Geophysics 75:137–149. https ://doi. org/10.1190/1.34840 98
Bentley CR (1979) No giant meteorite crater in Wilkes Land, Antarctica. J Geophys Res 84:5681–5682. https ://doi.org/10.1029/JB084 iB10p 05681
Bucha B, Janák J (2013) A MATLAB-based graphical user interface program for computing functionals of the geopotential up to ultra-high degrees and orders. Comput Geosci 56:186–196
ESA (2014) GOCE high level processing facility, GOCE Level 2 product data handbook, Doc. GO-MA-HPF-GS-0110, pp 21–23, https ://earth .esa.int/ web/guest /missi ons/esa-opera tiona l-eo-missi ons/goce. Accessed 13 Aug 2018
Förste C, Bruinsma S, Abrykosov O, Lemoine J-M et al (2014) The latest com-bined global gravity field model including GOCE data up to degree and order 2190 of GFZ Potsdam and GRGS Toulouse (EIGEN 6C4). 5th GOCE user workshop, Paris 25–28 Nov
Fretwell P, Pritchard H, Vaughan D, Bamber J et al (2013) Bedmap2: improved ice bed, surface and thickness datasets for Antarctica. Cryo-sphere 7:375–393. https ://doi.org/10.5194/tc-7-375-2013
Hirt C, Rexer M (2015) Earth 2014: 1 arc-min shape, topography, bedrock and ice-sheet models available as gridded data and degree-10,800 spherical harmonics. Int J Appl Earth Obs Geoinform 39:103–112. https ://doi.org/10.1016/j.jag.2015.03.001
Hirt C, Rexer M, Scheinert M, Pail R, Claessens S, Holmes S (2016) A new degree-2190 (10 km resolution) gravity field model for Antarctica developed from GRACE, GOCE and Bedmap 2 data. J Geod 90:105–127.
https ://doi.org/10.1007/s0019 0-015-0857-6
Jekeli CH (2009) Gravitational gradients from EGM08. In: Holota P (ed) Mission and passion: science (book). Czech National Committee of Geodesy and Geophysics, Prague, pp 113–120
Kalvoda J, Klokočník J, Kostelecký J, Bezděk A (2013) Mass distribution of Earth landforms determined by aspects of the geopotential as com-puted from the global gravity field model EGM 2008. Acta Univ Carol Geogr 48(2):17–25
Klokočník J, Kostelecký J (2015) Gravity signal at Ghawar, Saudi Arabia, from the global gravitational field model EGM 2008 and similarities around. Arab J Geosci 8: 3515–3522. https ://doi.org/10.1007/s1251 7-014-1491-y. ISSN 1866-7511
Klokočník J, Kostelecký J, Pešek I, Novák P, Wagner CA, Sebera J (2010) Can-didates for multiple impact craters? Popigai and Chicxulub as seen by the global high resolution Gravitational Field Model EGM08. EGU Solid Earth 1:71–83. https ://doi.org/10.5194/se-1-71-2010
Klokočník J, Kalvoda J, Kostelecký J, Eppelbaum LV, Bezděk A (2014) Gravity disturbances, Marussi tensor, invariants and other functions of the geopotential represented by EGM 2008, ESA Living Planet Symposium, 9–13 Sept 2013, Edinburgh, Scotland. Publishing in: August 2014: JESR (J Earth Sci Res) 2: 88–101
Klokočník J, Wagner CA, Kostelecký J, Bezděk A (2015) Ground track density considerations on the resolvability of gravity field harmonics in a repeat orbit. Adv Space Res 56:1146–1160. https ://doi.org/10.1016/j. asr.2015.06.020
Klokočník J, Kostelecký J, Bezděk A (2016) On feasibility to Detect volcanoes hidden under ice of Antarctica via their “gravitational signal”. Ann Geophys 59(5):S0539. https ://doi.org/10.4401/ag-7102
Klokočník J, Kostelecký J, Bezděk A (2017a) A support for the existence of paleolakes and paleorivers buried under Saharan sand by means of “gravitational signal” from EIGEN 6C4. Arab J Geosci. https ://doi. org/10.1007/s1251 7-017-2962-8
Klokočník J, Kostelecký J, Bezděk A (2017b) Gravitational Atlas of Antarctica. Springer, ISBN 978-3-319-56639-9. https ://doi.org/10.1007/978-3-319-56639 -9
Klokočník J, Kostelecký J, Cílek V, Bezděk A, Pešek I (2018) Gravito- topo-graphic signal of the Lake Vostok area, Antarctica, with the most recent data. Polar Sci. https ://doi.org/10.1016/j.polar .2018.05.002
Mataragio J, Kieley J (2009) Application of full tensor gradient invariants in detection of intrusion-hosted sulphide mineralization: implications for deposition mechanisms. Min Geosci EAGE First Break 27:95–98 Murphy CA, Dickinson JL (2009) Exploring exploration play models with
FTG gravity data. 11th SAGA Biennial Technical Meeting and Exhibition, Swaziland, pp 89–91, 16–18 Sept
Pavlis NK, Holmes SA, Kenyon SC, Factor JK (2012) The development and evaluation of the Earth Gravitational Model 2008 (EGM2008). J Geo-phys Res 17(B04406):2012. https ://doi.org/10.1029/2011J B0089 16
Saad AH (2006) Understanding gravity gradients—a tutorial, the meter reader. In: Van Nieuwenhuise B (ed) The leading edge, pp 941–949 August issue
Schmidt RA (1962) Australites and Antarctica. Science 138(3538):443–444.
https ://doi.org/10.1126/scien ce.138.3538.443
von Frese RR, Potts L, Wells S, Gaya-Piqué L, Golynsky A, Hernandez O, Kim J, Kim H, Hwang J (2006) Permian–Triassic mascon in Antarctica. Eos Trans AGU, J Assem Suppl 87 (36): T41A–08
von Frese RR, Potts L, Wells S, Leftwich T, Kim H et al (2009) GRACE gravity evidence for an impact basin in Wilkes Land. Antarctica. Geochem Geophys Geosyst 10(2):Q02014. https ://doi.org/10.1029/2008g c0021 49
von Frese RR, Kim HR, Leftwich TE, Kim JW, Golynsky AV (2013) Satellite magnetic anomalies of the Antarctic Wilkes Land impact basin inferred from regional gravity and terrain data. Tectonophysics 585:185–195
Weihaupt JG (1976) The Wilkes Land anomaly: evidence for a possible hypervelocity impact crater. J Geophys Res 81(B32):5651–5663. https :// doi.org/10.1029/jb081 i032p 05651
Weihaupt JG (2010) Gravity anomalies of the Antarctic lithosphere. Litho-sphere 2:454–461. https ://doi.org/10.1130/l116.1


![Fig. 16 I1 [s−4] for southern Australia with EIGEN 6C4](https://thumb-us.123doks.com/thumbv2/123dok_us/877581.1105439/9.595.59.541.88.514/fig-i-s-southern-australia-eigen-c.webp)
![Fig. 17 I2 [s−6] for southern Australia with EIGEN 6C4](https://thumb-us.123doks.com/thumbv2/123dok_us/877581.1105439/10.595.59.539.83.700/fig-i-s-southern-australia-eigen-c.webp)
