InSAR-derived crustal deformation and fault models of normal faulting
earthquake (
M
j7.0) in the Fukushima-Hamadori area
Tomokazu Kobayashi, Mikio Tobita, Mamoru Koarai, Takaki Okatani, Akira Suzuki, Yuko Noguchi, Masayuki Yamanaka, and Basara Miyahara
Geospatial Information Authority of Japan, 1 Kitasato, Tsukuba, Ibaraki 305-0811, Japan
(Received December 27, 2011; Revised July 30, 2012; Accepted August 31, 2012; Online published January 28, 2013)
Applying interferometric SAR (InSAR) analysis using ALOS/PALSAR data to inland crustal earthquakes in the Fukushima-Hamadori area, we succeeded in mapping a ground displacement associated with the Mj 7.0
earthquake that occurred on 11 April, 2011. The most concentrated crustal deformation is located ∼20 km west of the city of Iwaki, showing displacements away from the satellite with∼2.2 m at the maximum. Clear displacement discontinuities are recognized with an offset of∼1.6 m at the maximum, which are just on the Shionohira, Idosawa and Yunotake faults. From field surveys, we found that earthquake surface faults appeared with a vertical offset of∼1.9 m, consistent with the InSAR observation, and their locations correspond to the discontinuities in the interferogram. We inverted the InSAR data to construct slip distribution models, and our models show (1) nearly pure normal fault motions (2) on west-dipping planes (3) with moderate-dip-angles (50– 65◦). The inferred west-dipping normal fault motion on the Yunotake fault is correlated with the present-day topographic features, consistent with the idea that the historically-repeated normal faultings have developed the topography. On the other hand, for the Shionohira and Idosawa faults antithetical relationships are presented, maybe suggesting that large normal faultings have been infrequent historically.
Key words: Fukushima-Hamadori (Mj 7.0), InSAR, earthquake surface faults, normal fault, Shionohira fault,
Idosawa fault, Yunotake fault.
1.
Introduction
A megathrust earthquake with a moment magnitude (Mw) of 9.0 occurred on 11 March, 2011 (JST),
ruptur-ing the plate boundary on the east off northeastern Japan (Ozawaet al., 2011). Following theMw9.0 event, many
in-land crustal earthquakes occurred in addition to aftershocks on the plate boundary (Hiroseet al., 2011). The Fukushima-Hamadori area and the surroundings are one of the regions where the seismicity drastically changed from a quiescent stage to an active stage. In this region, the crustal deforma-tion rate is not so high and the region had been seismically inactive. No earthquakes exceeding a JMA (Japan Mete-orological Agency) magnitude (Mj) 4.0 have occurred in
the crust during the ten years prior to the Mw 9.0 event.
However, more than 20 earthquakes exceedingMj5.0 have
already occurred since theMw9.0 event, as of December,
2011 (Fig. 1). The timing of the seismicity activation sug-gests a possible causal relationship with theMw9.0 event. It
is further striking that most of the earthquakes are of a nor-mal fault type, which is not a typical type for the region of reverse/strike-slip motions reflecting the plate loading in an east-west direction. The crust along the coastal northeast-ern zone of Japan is considered to be subjected to a strong extensional stress change due to the reverse fault slip of the
Copyright cThe Society of Geomagnetism and Earth, Planetary and Space Sci-ences (SGEPSS); The Seismological Society of Japan; The Volcanological Society of Japan; The Geodetic Society of Japan; The Japanese Society for Planetary Sci-ences; TERRAPUB.
doi:10.5047/eps.2012.08.015
Mw9.0 event and the subsequent afterslip, which
presum-ably culminates in the promotion of a normal-fault slip. On 11 April, 2011, a large inland earthquake, with Mj
7.0, struck the Fukushima-Hamadori area. This is the largest event among the inland crustal earthquakes since the Mw 9.0 event, as of the time of writing. The seismic
data analyses show that the source mechanism is also a nor-mal fault type, but this event seems to be rather compli-cated in that the rupture style cannot be accounted for by a slip on a single fault plane. This is because several earth-quake surface faults appeared with (sub)meter order, sug-gesting that seismic ruptures proceeded on multiple fault planes. Despite the several such outstanding features of this event, however, it remains uncertain where and how the faults were involved in the seismic event. Obtaining de-tailed crustal deformation data and constructing fault mod-els are crucial to understanding the unclear points.
Satellite synthetic aperture radar (SAR) data can provide detailed and spatially-comprehensive ground information, and an interferometric SAR (InSAR) enables us to measure ground deformation with high precision (e.g., Massonnet and Feigl, 1998; B¨ugmann et al., 2000). One of the ad-vantages of InSAR observation is that local crustal defor-mation can be detected. Although GNSS sites (GEONET) are densely deployed with an average placement interval of ∼20–30 km nationwide, it remains difficult to obtain high quality displacement data for small- to moderate-sized earthquakes, impeding detailed analysis of the source
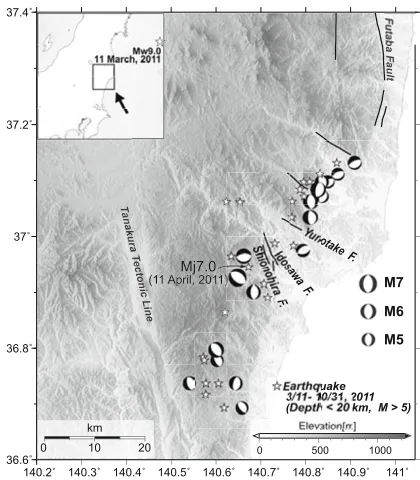
Fig. 1. Tectonic setting of the Fukushima-Hamadori area. The solid lines are active fault traces presented by the Research Group for Active Faults of Japan (1991). White stars are the earthquakes with magnitudes larger thanMj5 that occurred in the crust after theMw9.0 event on 11 March, 2011. Beachball diagrams are from NIED (National Research Insti-tute for Earth Science and Disaster Prevention) Earthquake Mechanism Search (http://www.fnet.bosai.go.jp/event/search.php?LANG=en).
erties, such as fault modeling. Alternatively, the ground res-olution of SAR data (ALOS/PALSAR) is∼10 m, and the InSAR observation works well to detect small- to moderate-sized ground deformation anomalies over a large area.
To obtain a further understanding of where and how rup-tures proceeded in theMj7.0 event, for which a complicated
source process is expected from the field survey, the SAR data analyses surely contribute to provide detailed and vital information regarding surface changes quantitatively. The primary aim of this paper is to understand the source prop-erties of theMj7.0 event by constructing an elaborated fault
model using InSAR-derived crustal deformation data. We first describe the SAR data analysis procedure in Section 2. In Section 3, we describe the characteristics of the crustal deformation associated with the inland crustal earthquakes; in particular, regarding displacement discontinuities corre-sponding to surface ruptures. On the basis of the InSAR data, we construct fault models using a rectangular fault plane with a uniform slip in Section 4. In Section 5, we construct a slip distribution model for theMj7.0 event by
an inversion approach. Finally, in Section 6, we discuss the reliability of our derived slip distribution model, the rela-tionship between the inferred fault motions and the present-day topographic features, and the effect of mainshock fault rupture on other fault ruptures.
2.
SAR Data Analysis
We collected ALOS/PALSAR images to reveal the crustal deformation due to the earthquake that occurred in Fukushima-Hamadori area. In Japan, many faults, includ-ing the seismic source we now study, are located in
moun-tainous areas with a vegetated environment, and thus the PALSAR’s L-band sensor should be a powerful tool for geodetic observation to extract ground information, even in mountains. JAXA (Japan Aerospace Exploration Agency) carried out urgent observations for the great earthquake (Mw9.0) on 20 March (path 404), 7 April (path 56), and 18
April (path 403) with a fine beam mode, and on 14 March (path 60) and 31 March (path 61) with a ScanSAR mode, respectively, which covers our study area. Among them we used three paths of fine beam mode for the interferometric analysis, because the interferometric coherence of the ob-tained images using ScanSAR was too low to detect ground displacements, which may have resulted from large perpen-dicular baselines (∼2 km and ∼5 km). ALOS had com-pleted its mission on 12 May, 2011, due to a power genera-tion anomaly that occurred on 22 April, 2011. Thus, no im-age had been acquired since the date. The ALOS/PALSAR data was processed using GSISAR software (Fujiwara and Tobita, 1999; Fujiwara et al., 1999; Tobita et al., 1999; Tobita, 2003).
Obvious long-wavelength phase changes caused by the
Mw9.0 event were included in the original interferograms
(Imakiire and Kobayashi, 2011). To pick up the crustal deformation due to the inland earthquakes, we assumed that the far-field displacement was zero and that the resid-ual phases were expressed by a quadratic surface, and we subtracted the evaluated bilinear function from the original interferogram. We use the residual phase changes as the crustal deformation data associated with the inland earth-quakes.
3.
Crustal Deformation Map
3.1 Characteristics of ground surface displacement
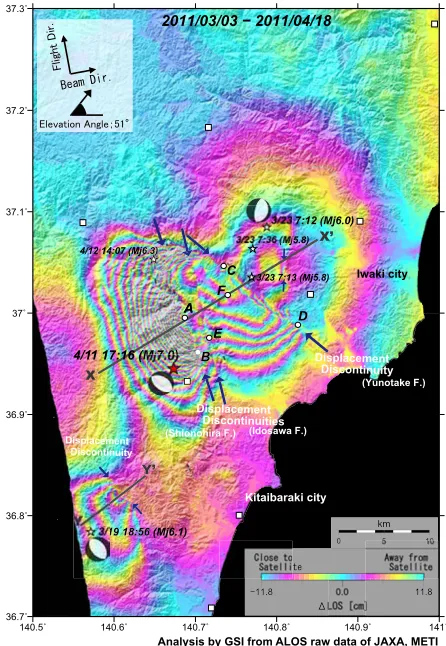
Figure 2 shows the interferogram obtained from the as-cending orbit data of path 403 acquired before, and after, the
Mj7.0 event (3 March, 2011–18 April, 2011). The crustal
deformation is distributed over an∼40–50-km range, show-ing displacements away from the satellite. The most con-centrated crustal deformation is located∼20 km west of the city of Iwaki. A maximum displacement of∼2.2 m is observed at point A (Fig. 2). In the further west of the in-tensive deformation area showing slant range lengthening, in contrast, small but clear slant range shortening signal is observed with∼10 cm. The importance of the shortening for the fault modeling is discussed later. Active faults, re-ferred to as Shionohira, Idosawa and Yunotake faults, exist in the deformation area (Research Group for Active Faults of Japan, 1991; Ishiyamaet al., 2011). This presumably suggests that these faults contributed to the seismic ruptures of theMj7.0 event in some way. The relationship with the
active faults will be described in the next section.
ow-Fig. 2. Interferogram obtained from the SAR data acquired on 3 March, 2011 and 8 April, 2011 (path 403). Arrows indicate the location of the displacement discontinuities. Points A to F are locations of photographs shown in Fig. 5. Lines X–Xand Y–Yare cross-section lines shown in Fig. 4. White squares represent the GEONET sites. The length of the perpendicular baseline is 331 m.
ing to the high coherence, the InSAR map of the Mj 7.0
event enables us to investigate the ground surface change over the entire source area in detail.
In addition to theMj7.0 event, additional crustal
defor-mation is detected by the InSAR analyses using different SAR data pairs. Figure 3 shows interferograms obtained from the data acquired before the Mj 7.0 event. In the
in-terferogram of Fig. 3(a), which is obtained from the SAR data pair of 2 February, 2011, and 20 March, 2011, we can recognize an ear-shaped displacement distribution, caused by the Mj6.1 event that occurred on 19 March, 2011. The
most concentrated crustal deformation is located∼10 km west of the city of Kitaibaraki, with a maximum slant range lengthening of∼40 cm. Figure 3(b) shows an interferogram obtained from the SAR data pair of 20 November, 2010, and 7 April, 2011. Crustal deformation due to theMj6.0 event
(23 March, 2011), in addition to that of the Mj 6.1 event,
can be clearly seen in the interferogram, located∼10 km west of the city of Iwaki. Comparing the two source re-gions to the active fault traces indicated by red lines, both seismic events seem to be irrelevant to known active faults. The corresponding phase changes are included also in the interferogram of Fig. 2, although the signal of the Mj6.0
event appears together with the phase changes due to the
Mj7.0 event.
3.2 Displacement discontinuities corresponding to
ground surface ruptures
It is notable that we can identify clear major and minor displacement discontinuities in the InSAR map (Fig. 2). In particular, three main displacement boundaries can be rec-ognized with lengths of tens and several kilometers in the source region of theMj7.0 event, indicated by arrows. The
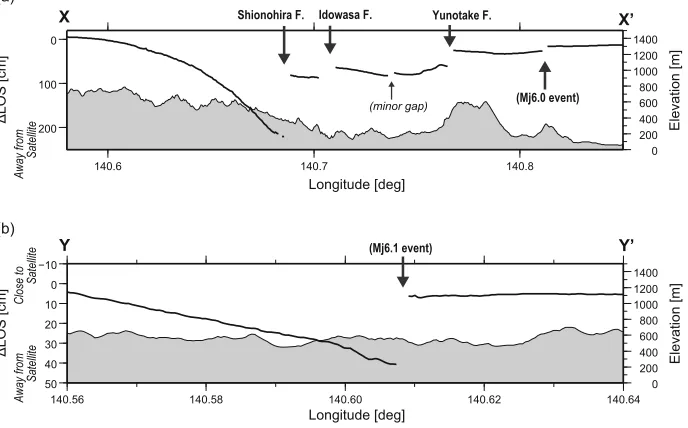
discontinuity lines run just on the Shionohira, Idosawa and Yunotake fault traces. Figure 4(a) shows a profile of the line-of-sight (LOS) displacement along the cross-section line of X–X (Fig. 2). Displacement jumps can be seen at some points, which probably correspond to surface rup-tures. The offsets strongly suggest that it is not a single fault rupture, but rather multiple ruptures which are involved in the seismic event. According to Hikima (2012), multiple shocks are recognized in the seismograms. The largest dis-placement offset is observed along the Shionohira fault. The maximum discrepancy across the discontinuity is ap-proximately 1.6 m. On the other hand, the maximum offset for the Yunotake fault is observed as∼60–70 cm.
Figure 5 shows photographs taken at some points corre-sponding to the displacement discontinuities in the interfer-ogram. The positions of photographs (A to F) are shown by white circles in Fig. 2. Field surveys reveal that earthquake surface faults appeared to be associated with the Mj 7.0
event, and we confirmed that the discontinuities in the inter-ferogram do correspond to the surface ruptures. The pho-tographs A and B, viewed from west and north, respectively, show that the hanging wall block drops down relative to the footwall one, which is of normal fault with west-dipping. From our field survey, the ground offset is measured to be approximately 1.9 m (photo A), equivalent to a LOS dis-placement of∼1.5 m. The maximum LOS displacement of the offset measured from the InSAR data agrees with the field observation.
The photographs C and D show the ground offsets taken at the Yunotake fault (Fig. 2), viewed from south and south-east, respectively. They also evidently show that the hang-ing wall block in the southwest drops down relative to the footwall one in the northeast, showing normal fault mo-tions.
We also detected some surface cracks along the Idosawa fault in our field survey (Photo E). They suggest that some surface change did occur along the Idosawa fault as iden-tified in the interferogram, but we were not able to infer the fault motion sense and/or amount of offset from the ob-served cracks.
In addition to the above-mentioned major discontinuities, we can identify several minor displacement boundaries with lengths of a few kilometers, which may not be seismic faults but so-called secondary faults. One of the minor discontinuities can be clearly seen in the cross-section of Fig. 4(a), indicated by a small arrow. A small, but clear, gap is detected. The gap is less than 10 cm. We can find out some cracks at, and around, the offset position (photo F), but they are not so clear that we can estimate the sense of ground movement.
Displacement discontinuities can be recognized associ-ated with not only the Mj 7.0 event but also the Mj 6.1
dis-Fig. 3. (a) Interferogram obtained from SAR data acquired on 2 February, 2011, and 20 March, 2011 (path 404). Perpendicular baseline (Bp) is 811 m. (b) Interferogram from SAR data acquired on 20 November, 2010, and 7 April, 2011 (path 56). Bp is 965 m. Displacement discontinuities can be recognized for both the events (arrows). White squares represent the GEONET sites.
Fig. 4. LOS displacement changes along the cross-sections of (a) X–Xand (b) Y–Yshown in Fig. 2. Displacement jumps are identified at some points, indicated by arrows. Shaded profiles indicate the corresponding topography.
placement profiles show the clear gaps of∼10 cm for the
Mj 6.0 event (Fig. 4(a)) and∼30 cm for theMj6.1 event
(Fig. 4(b)). These suggest that significant fault ruptures oc-curred at a rather shallow depth, although there are no re-ports of the appearance of earthquake surface faults or
sur-face cracks.
Fig. 5. Photographs showing earthquake surface faults or cracks observed from the field survey. Locations where the photographs were taken (A to F) are shown in Fig. 2. A: (140.687◦E, 36.995◦N), B: (140.703◦E, 36.961◦N), C: (140.735◦E, 37.046◦N), D: (140.826◦E, 36.989◦N), E: (140.717◦E, 36.975◦N), F: (140.731◦E, 37.023◦N).
ground anomalies such as the displacement boundaries. The detection of the displacement boundaries and an awareness of their spatial extent demonstrate the advantage of the In-SAR analysis in that small- to moderate-sized ground de-formation anomalies can be observed over a large area with a high spatial resolution.
4.
Rectangular Fault Models with Uniform Slip
for the
Mj7.0 and
Mj6.0 Events
On the basis of the obtained interferogram data, we first try to construct a fault model under the assumption of a rectangular fault with a uniform slip in an elastic half-space (Okada, 1985). A rectangular fault model has the advantage that it can represent a macroscopic feature of the source property with its simple notation. In the interferogram of theMj7.0 event, the phase changes associated with theMj
6.1 and the Mj 6.0 events are included. The effect of the
Mj6.0 event, especially, is not negligible for the modelling
of the Mj 7.0 event. Thus, we first construct the Mj 6.0
event model. The LOS displacements predicted by the two models are subtracted from the original interferogram, and then the residual is used for the modelling of the Mj 7.0
event. For theMj6.1 event, we used a fault model that had
already been constructed by Kobayashiet al.(2011).
Table 1. Fault parameters of our preferred model for theMj6.0 event (23 March, 2011). We define the location of each fault as the center. The units of length, width, and depth are in kilometers, those of dip, strike, and rake are in degrees, and the unit of slip is in meters. The moment magnitude is calculated with the rigidity of 30 GPa. The parenthesized numbers are the standard deviation (1σ). In the lowest row, the fault parameters from the CMT solution (NIED Earthquake Mechanism Search (http://www.fnet.bosai.go.jp/event/search.php?LANG=en)) are listed for comparison.
Fault Longitude Latitude Depth Length Width Strike Dip Rake Slip Mw
1 140.802 37.044 4.2 9.2 3.3 182.3 67.1 –111.7 0.9 5.9
(0.004) (0.007) (0.6) (1.0) (0.6) (2.9) (15.7) (18.8) (0.3)
CMT 140.788 37.085 7.6 — — 191/20 64/27 –94/–82 — 5.7
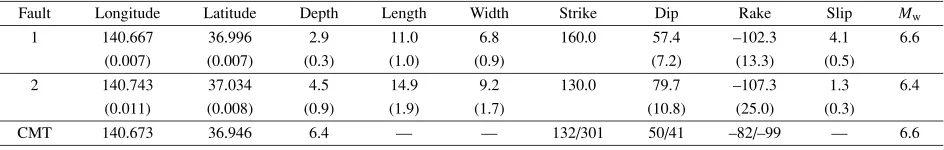
Table 2. Fault parameters of our preferred model for theMj7.0 event (11 April, 2011). The definition of fault parameters is the same as in Table 1. Faults No. 1 and 2 indicate the fault planes corresponding to the Shionohira and the Yunotake faults, respectively.
Fault Longitude Latitude Depth Length Width Strike Dip Rake Slip Mw
1 140.667 36.996 2.9 11.0 6.8 160.0 57.4 –102.3 4.1 6.6
(0.007) (0.007) (0.3) (1.0) (0.9) (7.2) (13.3) (0.5)
2 140.743 37.034 4.5 14.9 9.2 130.0 79.7 –107.3 1.3 6.4
(0.011) (0.008) (0.9) (1.9) (1.7) (10.8) (25.0) (0.3)
CMT 140.673 36.946 6.4 — — 132/301 50/41 –82/–99 — 6.6
4.1 Mj6.0 event on 23 March, 2011
The interferogram has ground surface changes over a range of several tens of kilometers, producing too many values to be easily assimilated in a modeling scheme. In order to reduce the number of data for the modelling anal-ysis, we resampled the interferogram data beforehand, us-ing a quadtree decomposition method. Essentially, we fol-lowed an algorithm presented by J´onssonet al.(2002). For a given quadrant, if, after removing the mean, the residue is greater than a prescribed threshold (1 cm in our case), the quadrant is further divided into four new quadrants. This process is iterated until either each block meets the spec-ified criterion, or until the quadrant reaches a minimum block size (8× 8 pixels in our case). Upon application of the above-mentioned procedure, the sizes of interfero-gram data sets were reduced from ∼5.3 million to 1948. For the modeling, we applied a simulated annealing method for searching the optimal fault parameters (e.g., Cervelliet al., 2001). We randomly gave parameters within a search range of 140.75◦–140.85◦ in longitude, 37.00◦–37.10◦ in latitude, 0.1–10 km in depth, 1–10 km in length, 1–5 km in width, 180◦–220◦ (0◦–40◦) in strike, 10◦–90◦ in dip, – 130◦– –50◦ in rake, and 0.1–2 m in slip amount, respec-tively. To estimate the individual confidence of inferred pa-rameters, we employed a bootstrap method (Efron, 1979). We attempted a two-segment model in addition to the one-segment model. As a result, the AIC (Akaike’s information criterion) (Akaike, 1974) values support the one-segment model (AIC=–2776) rather than the two-segment model (AIC=–2619). Figure 6 shows the LOS displacement cal-culated using our preferred model and the residuals between the observations and the calculations. Our model is able to reproduce well the observations. The estimated fault pa-rameters are listed in Table 1. Our fault model shows (1) a west-dipping fault plane with a dip angle of 67◦, (2) a NS-oriented strike, and (3) a nearly pure normal fault motion. The seismic moment is estimated to be 7.88×10¹⁷ N m (Mw5.9) with a rigidity of 30 GPa.
4.2 Mj7.0 event on 11 April, 2011
We attempt to construct the rectangular fault model of theMj7.0 event. We downsampled the interferogram data
from∼6.2 million to 5298 in the same manner as in the previous section. We assumed a two-segment model that consists of the Shionohira and Yunotake faults. We tried a three-segment model adding the Idosawa fault to the segment model, but the AIC estimate favored the two-segment model. For the parameter search of the Shionohira fault, we randomly gave parameters within a search range of 140.63◦–140.69◦in longitude, 36.97◦–37.03◦in latitude, 5– 20 km in length, 1–10 km in width, 30◦–90◦in dip, –135◦– –45◦ in rake, and 1–6 m in slip, respectively, while for the Yunotake fault, 140.73◦–140.78◦in longitude, 37.01◦– 37.04◦ in latitude, 5–15 km in length, 1–10 km in width, 30◦–90◦ in dip, –135◦– –45◦ in rake, and 0–5 m in slip, respectively. The strikes are fixed at the 160◦ (340◦) and 130◦(310◦) for the Shionohira and the Yunotake faults, so as to fit to the averaged orientations of the displacement dis-continuities, respectively. For the calculation, we attempted both west- and east-dipping faults. The appearances of the earthquake surface faults strongly suggest that significant slips occurred near the ground surface, thus we fix the fault top position at a depth of 0 km below sea level (bsl). Esti-mated fault parameters and their errors are listed in Table 2. The total seismic moment is estimated to be 1.45×10¹⁹
N m, equivalent to Mw6.7 with a rigidity of 30 GPa
(Sh-ionohira fault: 9.20×10¹⁸ N m (M
w6.6), Yunotake fault:
5.35× 10¹⁸ N m (M
w6.4). Our fault model shows that
the slips are nearly pure normal fault motions with dip an-gles of∼60◦and∼80◦for the Shionohira and the Yunotake faults, respectively. For both the faults, west-dipping faults are preferable to east-ones.
Fig. 7. Same as Fig. 6 but for the earthquake on 11 April, 2011 (Mj7.0). Contour interval is 10 cm. A contour line of –5 cm is also shown in the western margin to make the LOS shortening clear.
still remains non-negligible displacements, which probably originate in the spatial inhomogeneity of slip on the fault planes and a lack of the contribution of the Idosawa fault. A more elaborated fault model is constructed in the next section.
5.
Slip Distribution Model for the
Mj7.0 Event
To model the ruptures associated with the Mj7.0 event
more precisely, we construct a slip distribution model by a least squares method. The fault geometry is assumed to be a plane fault, and we put each plane by fitting the surface breaks to the interferograms by trial and error. We set three rectangular faults corresponding to the Shionohira, Yuno-take, and Idosawa faults. The fault top position is fixed to the depth of 0 km bsl. The individual fault is divided into square patches with a size of 1×1 km. We use the dislocation equations derived by Okada (1985) to calculate the surface displacement in the variable LOS directions. In the inversion, only the dip-slip and strike-slip components are estimated for each patch. Because of no constraint on the slip direction, there arose physically implausible slips in places, but they are minor in the overall slip distribution. The increase of model parameters gives rise to instability of the solution. To stabilize the solution, we here impose a spatial smoothness constraint on the slip distribution us-ing a Laplacian operator. The relative weight of the con-straints is determined by Akaike’s Baysian information cri-terion (Akaike, 1980). We assume the Shionohira and the Yunotake planar faults dipping westward, following the re-sults in the previous section, while for the Idosawa fault we tried the possibility of both west- and east-dipping faults. The problem we solve is a nonlinear inversion on a param-eter of the dip angle. We here dparam-etermine the dip angle by a grid search, in which we first conduct the grid search with a coarse interval of 10◦and then with a finer interval of 5◦ surrounding the dip angle determined in the previous step. We set the search range from 40◦to 90◦, referring to the re-sults in the previous chapter that low-angle fault planes are not favourable.
We cannot neglect the contribution of the cross-terms of the covariance matrix for the InSAR data, because they have a strong spatial correlation in general, which largely results from the variations of atmospheric water vapour (Lohman and Simons, 2005; Fukahata and Wright, 2008). We incor-porate the cross-terms of the covariance matrix in the inver-sion scheme, following the equation presented by Fukahata and Wright (2008), and now take the characteristic corre-lation distance of errors to be 10 km (Wrightet al., 2003; Fukahata and Wright, 2008).
Figure 8 shows the calculated LOS displacement pre-dicted from our model and the residual between the ob-servations and the calculations. Compared with the result of uniform slip models in the previous chapter, the slip dis-tributed model significantly reduces the residuals and is able to account for the observations better. In particular, there is little residual in the proximity of the Yunotake fault.
The optimal dip angles for Shionohira, Yunotake, and Idosawa faults are determined to be 50◦, 65◦, and 50◦, re-spectively. The total seismic moment is 1.55×10¹⁹ N m (Mw 6.7) assuming a rigidity of 30 GPa, and the released
moments for each fault are estimated to be 9.22×10¹⁸ N
m (Mw6.6), 4.22×10¹⁸ N m (Mw6.4), and 2.09×10¹⁸
N m (Mw6.1) for the Shionohira, Yunotake, and Idosawa
faults, respectively. According to the results of JMA CMT, NIED CMT, and Global CMT solutions, the seismic mo-ments are 1.2×10¹⁹N m (M
Fig. 8. (a) LOS displacement field calculated from our slip distributed model for the Mj 7.0 event. (b) Residual between the observations (Fig. 6 (a)) and the calculations (a). White frames indicate the surface projections of our fault model and the thick white lines stand for the upper edges. The contour interval is the same as in Fig. 7.
6.6), and 1.2×10¹⁹N m (M
w6.7), respectively. Our result
is good agreement with them.
Figure 9 shows the estimated slip distributions. The ma-jor slip on the Shionohira fault occurred near the ground surface. The slips are nearly pure normal fault motions over all the fault plane. For the Yunotake fault, the major slip is distributed at a depth less than 5 km along the dip from the fault top, while at a greater depth no significant slip is inferred. A normal fault motion is dominant over all the fault plane. Slips of∼2 m are estimated at the northwest of the fault, and the shallow slip significantly includes a sinis-tral component. The slip on the Idosawa fault also shows a nearly pure normal fault motion as well as the other two faults. The major slips are distributed at, and around, 5 km along the dip from the fault top. The estimated maximum slip is less than 1 m, which is much smaller than the slips on the other two faults.
Fig. 9. Slip distribution on (a) the Shionohira fault, (b) the Yunotake fault, and (c) the Idosawa fault, inferred from the inversion of the InSAR displacement. The arrows show slip vectors of the hanging wall. The contour interval is 50 cm. The positions of the left and right upper edges for each fault plane are shown in Fig. 8.
6.
Discussion
6.1 Reliability of the fault model
Fig. 10. Residual distribution as a function of dip angle of the Yunotake fault. The vertical axis indicates the normalized residual to be 0 to 1. On each panel, the dip angle of the Shionohira fault is fixed at a certain angle indicated at the upper left. Individual lines on each panel are the residuals of when the dip angle of the Idowasa fault is fixed at a certain angle. The characters “W” and “E” mean west-dipping and east-dipping for the Idosawa fault, respectively.
Fig. 11. Simulated interferograms calculated from west-dipping faults with dip angles of (a) 80◦, (b) 60◦, and (c) 40◦, respectively. A uniform slip on each single rectangular fault in an elastic half-space is assumed. Black frames indicate surface projections of each fault. One cycle of fringe is 11.8 cm. Broken contour lines are drawn only for the LOS shortening area. An ascending orbit with an off-nadir angle of 34.3◦is assumed.
in all cases, west-dipping is preferable to east-dipping and moderate dip angles, identical to the Shionohira fault, are favorable. It means that the dip angles are well constrained in the residual space.
Next, let us confirm the reliability of the dip angle for the Shionohira fault from a different aspect. For both the rectangular fault model and the slip distribution model, the preferred dip angle is evaluated to be 50 ∼60◦. Accord-ing to field surveys along the fault, however, the dip an-gle seems to be high as it is shown that the hanging wall block falls down nearly vertically (Fig. 5(A)). To test the reliability of the moderate angle, we employed a forward modeling. Here, we gave a uniform normal-fault-slip of 5
Fig. 12. A 3D mapping of interferogram draped over topographic relief, viewed from N165◦E. Vertical displacements predicted from our fault models are depicted in the middle layer. There is neither overlap nor crossing in the three planes.
can reproduce well the characteristics that neither high- nor low-angle models can explain (Fig. 11(b)). It strongly sug-gests that a significant normal fault slip is inevitable to oc-cur on not high-/low- but moderate-dip-angle fault plane. We could not rule out the possibility that a slip occurred with a high-dip-angle near the ground surface, such as a listric fault, but such a curved fault plane is not implied in the aftershock distribution from the JMA catalog.
6.2 Relationship between fault motions and topogra-phy
A 3D mapping of an interferogram, draped over the topo-graphic relief, is shown in Fig. 12 to facilitate comparison between the InSAR map, the topography, and the configu-ration of our fault models. Let us first consider the Yuno-take fault area. Vertical displacements predicted from our models are depicted in the middle layer. Our fault model shows that the Yunotake fault is of normal fault motion with a west-dipping plane, producing an upheaval at the north-eastern side of the fault and subsidence at the southwestern side (Fig. 12). Comparing this to the topography, we can clearly see that the normal fault motion is correlated with present-day topography, in that the mountainous area is at the northeastern side of the fault. According to the Research Group for Active Faults of Japan (1991), the topographic high corresponding to the fault scarp has been recognized as the fault features (fault topography) for the Yunotake fault. The coseismic slip motion is quite consistent with the orien-tation of the long-term cumulative displacement, supporting the idea that the normal fault motions have repeated
histor-ically on the Yunotake fault, and have contributed to the development of the present-day topography. A right lateral component, besides the dip slip, has been also identified from the fault outcrop (According to the Research Group for Active Faults of Japan, 1991), but our fault model shows no right lateral slip but rather, partly, a left lateral one.
Also for both the Shionohira and the Idosawa faults, nor-mal fault motions on west-dipping planes are inferred from our modeling. The fault model predicts that the largest ground subsidence occurred in the west of the Shionohira fault (Fig. 12). By analogy with a similar mechanism inter-preted for the Yunotake fault, we may speculate that if nor-mal faulting had been experienced on the faults repeatedly actively, a topographic high would have been developed in the east. The topography, however, is antithetical to the co-seismic displacements with normal fault motions, although earthquake surface faults are just on the topographic linea-ments (Figs. 4 and 12). Little correlation between the fault motions and the present-day topography may suggest that large normal fault slip events have been rare on the Shiono-hira and the Idosawa faults historically.
6.3 Are the ruptures on the other two faults promoted by that on the Shionohira fault?
Ruptures on multiple faults are probably involved in the
Mj 7.0 event, but, from the InSAR data we are unable to
obtain information regarding the time history of the rup-tures. According to analyses of seismic waveform data, the rupture of the Mj 7.0 event started on the Shionohira
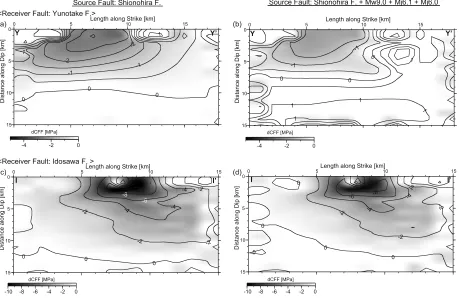
Fig. 13. CFF distributions on the Yunotake fault (a, b) and on the Idosawa fault (c, d). Left panels show theCFF values of when the slip on the Shionohira fault is used, while right panels show the values adding the effects of theMw9.0, theMj6.1, and theMj6.0 events. Gray-colored areas represent negative sign values.
Fig. 14. Seismicity map during one month before (a) and after (b) theMj7.0 event. Dots indicate earthquakes shallower than 20 km. Broken lines are active fault traces presented by the Research Group for Active Faults of Japan (1991). The star indicates the hypocenter ofMj7.0 event.
about 10 s (Hikima, 2012). Are the ruptures on the Yuno-take fault promoted by those on the Shionohara fault? A Coulomb Failure Function change (CFF) can be an indi-cator to judge whether the static stress change is conducive to slip on a fault plane. We first test whether or not the slip on the Yunotake fault can be facilitated by the static stress change caused by the slip on the Shionohira fault. Refer-ring to the geometries and the rakes, we set each patch of our slip model for the Yunotake fault as a receiver fault. We assumed 0.4 as an effective coefficient of friction, including
a pore pressure effect, according to Steinet al.(1994), and the rigidity of 30 GPa. Figure 13(a) shows the estimated
from 0.2 to 0.8, and confirmed that in all cases theCFF values are negative at shallow depths as well (–3.9 to –2.5 MPa at the maximum).
Figure 13(b) shows theCFF distribution on the Yuno-take fault, but adding the effect of static stress changes caused by the Mw 9.0, the Mj 6.1, and theMj 6.0 events.
We used the fault model proposed by the Geospatial Infor-mation Authority of Japan (GSI) for theMw9.0 event (GSI,
2011).CFF values with a positive sign are expected over all the fault plane, but negativeCFF values still remain in the major slip area, suggesting that the static stress change does not play a role in promoting the major slip. Although the temporal relationship between the onset of the Shiono-hira fault and the Idosawa fault is not well-understood, we attempt an estimate ofCFF for the Idosawa fault under the assumption that the rupture on the Shionohira fault was followed by that on the Idosawa fault. Also for the Idosawa fault,CFF values with a negative sign are distributed on the major slip area, indicating the suppression of the slip (Figs. 13(c) and (d)).
On the other hand, it is possible that the occurrence of aftershocks reacts to the static stress changes. Figure 14 shows the seismicity in, and around, the source region of the Mj 7.0 event. Figures 14(a) and (b) are the seismicity
maps during one month before, and after, the occurrence of the Mj 7.0 event, respectively. We obviously find that
aftershocks actively occurred in, and around, the Shionohira fault after the Mj 7.0 event, while around the Yunotake
fault no remarkable increase of earthquakes is noticeable. Although the source mechanisms of the aftershocks in, and around, the Yunotake fault are not known well, the inactive seismicity might reflect the stress shadow area produced by the mainshock slip on the Shionohira fault.
The analysis result on the static stress change does not support the idea that the static stress change due to the slip on the Shionohira fault is responsible for the initiation of the rupture on both the Yunotake fault and the Idosawa fault. Other mechanisms, such as dynamic triggering, may have played a role in inducing the ruptures on the other two faults. The problem concerning the triggering of ruptures is beyond the scope of this paper. This question is a matter for future studies.
7.
Concluding Remarks
We have applied an interferometric SAR (InSAR) analy-sis using ALOS/PALSAR data to inland crustal earthquakes in the Fukushima-Hamadori area and we have detected the crustal deformation associated with theMj7.0 event. The
following conclusions were derived from the analyses:
(1) The most concentrated crustal deformation is located
∼20 km west of the city of Iwaki, showing displace-ments away from the satellite with∼2.2 m at the max-imum.
(2) Clear displacement discontinuities are recognized in the interferograms, with an offset of ∼1.6 m at the maximum, which are just on the Shionohira, the Yuno-take, and the Idosawa faults.
(3) From the field surveys, we found that earthquake sur-face faults appeared with a vertical offset of∼1.9 m at
the maximum, equivalent toLOS of∼1.5 m. Their locations match the discontinuities identified in the in-terferogram.
(4) Our slip distribution model shows nearly pure normal fault motions on west-dipping planes with a moderate dip angle for all three faults (Shionohira, Yunotake, and Idosawa).
(5) The west-dipping normal fault motion on the Yunotake fault is correlated with present-day topographic fea-tures, while those on both the Shionohira and Idosawa faults are inversely correlated with the topography. (6) ACFF estimate suggests that the static stress change
due to the mainshock fault rupture on the Shionohira fault does not initiate the slips on the other two faults, maybe suggesting that other mechanisms are involved in the triggering of rupture on these two faults.
Acknowledgments. PALSAR data were provided from the Earth-quake Working Group under a cooperative research contract with JAXA (Japan Aerospace Exploration Agency). The ownership of PALSAR data belongs to JAXA and METI (Ministry of Econ-omy, Trade and Industry). We used hypocenter data processed by the Japan Meteorological Agency (JMA). We used GMT (The Generic Mapping Tools) provided by Wessel and Smith (1998) for constructing the figures. We thank two reviewers (Dr. P. S. Agram and an anonymous reviewer) and the editor (Prof. Miura) for their helpful comments to improve our manuscript.
References
Akaike, H., A new look at the statistical model identification,IEEE Trans. Auto. Control,119, 716–723, 1974.
Akaike, H., Likelihood and the Bayes procedure, inBayesian Statistics, edited by J. M. Bernardo, M. H. DeGroot, D. V. Lindley, and A. F. M. Smith, 143–166 pp., University Press, Valencia, Spain, 1980. Bugmann, R., P. A. Rosen, and E. J. Fielding, Synthetic aperture radar in-¨
terferometry to measure Earth’s surface topography and its deformation,
Ann. Rev. Earth Planet. Sci.,28, 169–209, 2000.
Cervelli, P., M. H. Murray, P. Segall, Y. Aoki, and T. Kato, Estimating source parameters from deformation data, with an application to the March 1997 earthquake swarm off the Izu Peninsula, Japan,J. Geophys. Res.,106, 11217–11237, 2001.
Efron, B., Bootstrap methods: another look at the jacknife,Ann. Statist.,7, 1–26, 1979.
Fujiwara, S. and M. Tobita, SAR interferometry techniques for precise surface change detection,J. Geod. Soc. Jpn.,45, 283–295, 1999 (in Japanese with English abstract).
Fujiwara, S., M. Tobita, M. Murakami, H. Nakagawa, and P. A. Rosen, Baseline determination and correction of atmospheric delay induced by topography of SAR interferometry for precise surface change detection,
J. Geod. Soc. Jpn.,45, 315–325, 1999 (in Japanese with English ab-stract).
Fukahata, Y. and T. J. Wright, A non-linear geodetic data inversion using ABIC for slip distribution on a fault with an unknown dip angle, Geo-phys. J. Int., 173, 353–364, doi:10.1111/j.1365-246X.2007.03713.x, 2008.
Geospatial Information Authority of Japan, The 2011 off the Pacific coast of Tohoku Earthquake: Crustal Deformation and Fault Model (Prelimi-nary), http://www.gsi.go.jp/cais/topic110313-index-e.html, 2011. Hikima, K., Rupture process of the April 11, 2011 Fukushima Hamadori
Earthquake (Mj7.0)—Two fault planes inferred from strong motion and relocated aftershocks—,J. Seismol. Soc. Jpn.,64, 243–256, 2012 (in Japanese with English abstract).
Hirose, F., K. Miyaoka, N. Hayashimoto, T. Yamazaki, and M. Naka-mura, Outline of the 2011 off the Pacific coast of Tohoku Earthquake (Mw 9.0)—Seismicity: foreshocks, mainshock, aftershocks, and in-duced activity—,Earth Planets Space,63, 513–518, 2011.
Ishiyama, T., H. Sato, N. Kato, K. Yagi, T. Miyagi, and T. Imaizumi, The surface earthquake fault of the 11th April 2011 earth-quake in Hamadoori Fukushima pref. (report:1), http://outreach.eri.u-tokyo.ac.jp/eqvolc/201103 tohoku/eng/hamadoori/#report1, 2011. Jonsson, S., H. Zebker, P. Segall, and F. Amelung, Fault slip distribution of´
the 1999 Mw 7.1 Hector Mine, California, earthquake, estimated from satellite radar and GNSS measurements,Bull. Seismol. Soc. Am.,92, 1377–1389, 2002.
Kobayashi, T., M. Tobita, T. Nishimura, A. Suzuki, Y. Noguchi, and M. Yamanaka, Crustal deformation map for the 2011 off the Pacific coast of Tohoku Earthquake, detected by InSAR analysis combined with GEONET data,Earth Planets Space,63, 621–625, 2011.
Lohman, R. B. and M. Simons, Some thoughts on the use of In-SAR data to constrain models of surface deformation: noise struc-ture and data downsampling,Geochem. Geophys. Geosyst.,6, Q01007, doi:10.1029/2004GC000841, 2005.
Massonnet, D. and K. L. Feigl, Radar interferometry and its application to changes in the earth’s surface,Rev. Geophys.,36, 441–500, 1998. Okada, Y., Surface deformation due to shear and tensile faults in a
half-space,Bull. Seismol. Soc. Am.,75, 1135–1154, 1985.
Ozawa, S., T. Nishimura, H. Suito, T. Kobayashi, M. Tobita, and T. Imaki-ire, Coseismic and postseismic slip of the 2011 magnitude-9 Tohoku-Oki earthquake,Nature,475, 373–376, doi:10.1038/nature10227, 2011. Research Group for Active Faults of Japan,Active Faults in Japan: Sheet Maps and Inventories, revised edition, University of Tokyo Press, 1991
(in Japanese with English summary).
Stein, R. S., G. C. P. King, and J. Lin, Stress triggering of the 1994 M=6.7 Northridge, California earthquake by its predecessors,Science,265, 1432–1435, 1994.
Takada, Y., T. Kobayashi, M. Furuya, and M. Murakami, Coseismic dis-placement due to the 2008 Iwate-Miyagi Nairiku Earthquake detected by ALOS/PALSAR: Preliminary results,Earth Planets Space,61, e9– e12, 2009.
Tobita, M., Development of SAR interferometry analysis and its applica-tion to crustal deformaapplica-tion study,J. Geod. Soc. Jpn.,49, 1–23, 2003 (in Japanese with English abstract).
Tobita, M., S. Fujiwara, M. Murakami, H. Nakagawa, and P. A. Rosen, Accurate offset estimation between two SLC images for SAR interfer-ometry,J. Geod. Soc. Jpn.,45, 297–314, 1999 (in Japanese with English abstract).
Wessel, P. and W. H. Smith, New, improved version of Generic Mapping Tools released,Eos Trans. AGU,79, 579, 1998.
Wright, T. J., Z. Lu, and C. Wicks, Source model for the Mw 6.7, 23 October 2002, Nenana Mountain Earthquake (Alaska) from InSAR,
Geophys. Res. Lett.,30, 1974, doi:10.1029/2003GL018014, 2003.