R E S E A R C H
Open Access
Performance of distributed beamforming for
dense relay deployments in the presence of
limited feedback information
Turo Halinen
1*, Alexis A Dowhuszko
1and Jyri Hämäläinen
1,2Abstract
This paper studies the impact of quantized channel feedback on the performance of a (coherent)distributed
beamforming(DBF) scheme. The analysis is done in the context of a wireless access network, and the goal is to provide an adequate broadband coverage for users located inside buildings. In the examined scenario, instead of trying to reach the servingbase station(BS) directly, we assume that each mobileuser equipment(UE) receives assistance from a cooperative group of network elements that is placed in close proximity (e.g., in the same room or office). This cluster of cooperative network elements is formed by a large number of low-costrelaying stations(RSs), which have fixed locations and are equipped with only one antenna. To simplify the analysis, communication in the first hop (i.e., from the mobile UE to the elements of the cluster) is assumed practically costless, making the bottleneck lie in the second hop of the system (i.e., from the elements of the cluster to the serving BS). Closed-form approximations for three different performance measures are derived (i.e., outage probability, ergodic capacity, bit error probability), providing accurate predictions of the fundamental limits that proposed system architecture is able to provide. Our analysis reveals that the achievable end-to-end performance when using a small amount of phase feedback information (per RS in the second hop) is very close to the full phase information upper bound, paving the way to the use of massive DBF architectures as a practical way to cope with high data rate demands of future wireless systems.
Keywords: Cooperative communications, Distributed beamforming, Decode-and-forward relays, Heterogeneous networks, Limited feedback information, Massive network element deployments, Non-perfect channel knowledge, Performance prediction
1 Introduction
The demand of mobile data has been growing at a steady pace in the last few years, as the usage of new types of mobile devices such as smartphones and tablets has become a mainstream. This tendency has been also fueled by the introduction of new mobile applications, creating a new category of users that call for a better support of high data rates. It is not surprising that many indepen-dent sources have predicted a dramatic increase in mobile broadband traffic in the next few years [1]. In addition, by the year 2020, it is also expected that every one of us will be surrounded by an average number of 10 wireless-enabled devices, resulting in a 10-fold increase in the
*Correspondence: turo.halinen@aalto.fi
1Department of Communications and Networking, Aalto University, P.O. Box 13000, Aalto FI-00076, Finland
Full list of author information is available at the end of the article
number of equipment that will admit wireless connectiv-ity (more than 50 billion connected devices are expected to be supported worldwide by the end of the decade) [2]. To cope with these demands, novel wireless network architectures will be required [3]. In line with this, one interesting option is based on deploying a large number of low-cost relaying stations (RSs) with fixed locations in hotspot areas of the mobile network (e.g., on walls and ceilings) [4]. The massive deployment of inexpen-sive RSs enables the implementation of adistributed beam forming(DBF) scheme, providing an improvement in the signal-to-interference-plus-noisepowerratio(SINR) of the different end-to-end wireless connections (i.e., boosting the desired signal energy at the destination and miti-gating the co-channel interference that is generated by neighbors).
Since the majority of voice calls and data usage ses-sions take place inside buildings by nomadic (mobile) users [5], the delivery of adequate indoor broadband cov-erage is crucial [6,7]. The provision of indoor broadband wireless access from macro-base stations (BSs) located outdoors is not a good option in practice: the high pen-etration losses caused by walls and floors put an indoor user equipment (UE) in a very disadvantageous situa-tion (i.e., the energy consumpsitua-tion required for the sig-nal transmission is increased, decreasing the amount of information that can be transferred effectively). For a customer that demands wireless connectivity in a small apartment or office, one possible solution is to deploy a low-power femto-/home BS and to provide connectivity to the core network of the service provider using, e.g., a residential digital subscriber line [8]. For corporate cus-tomers that demand an adequate broadband coverage in an office building, a hotel, or an airport, another option is to deploy a distributed architecture that relies on fiber optics (or power lines) to connect remote radio access units with a centralized processing unit [9,10]. In this work, a slightly different approach that combines concepts of the two previously described methods is considered: we focus on studying the performance of an indoor UE, when its transmitted signal is boosted by a massive cluster of cooperative network elements that are located in close proximity (i.e., in the same room or office) [4]. Such an approach is similar to the hierarchical cooperation scheme proposed in [11], when cooperation for long-range com-munications is only implemented inside the transmitting cluster. Compared to [12], we assume that the transmit-ting cooperative network is composed of alargenumber of fixed low-cost RSs (located in the walls and ceiling of the room) that enable the implementation of a distributed transmission in the link between the indoor UE (or main transmitter) and the macro-BS (or main receiver). Since the cost of deploying these RSs should be low by defi-nition, the cooperative strategy that they can implement in practice is restricted to single-layer DBF with limited channel feedback information at the transmitter side.
The main idea behind DBF is simple: distribute the message within many disperse antenna elements and then coordinate the retransmission in the direction of the intended destination [13,14]. Unlike the aforemen-tioned cases, we consider the implementation of a joint transmission scheme within the cluster of RSs that sur-rounds the main transmitter. In other words, we assume that an equivalentdistributed antenna system(DAS) can be configured sharing a common message in the first hop (i.e., replacing wired links by almost costless wire-less links due to close proximity) and implementing a DBF scheme with limited feedback in the second hop. Since it is assumed that the bottleneck of the system lies in the second hop, end-to-end performance can be
improved, implementing a coherent transmission scheme from the cluster of RSs to the main receiver (i.e., adjust-ing the phases of the channel gains that the main receiver observes from each of the antenna elements that sur-rounds the main transmitter). This enables the coherent combination of the multiple replicas of the original mes-sage at the intended destination. The potential advantages of deploying a DBF architecture are well known in the lit-erature: full diversity benefit and M-fold power gain for Mactive array elements in the network [15]. Note that to achieve the full diversity benefit, the inter-antenna separa-tion in the second hop should be larger than the coherence distance of the channel; this is typically the case, e.g., when dealing with omnidirectional antennas in indoor environ-ments with rich scattering (in this situation, the coherence distance is usually a fraction of the wavelength of the wire-less system). We note that in the absence ofchannel state information(CSI) at the disperse antenna elements, the use of distributed space-time coding was also suggested, obtaining full diversity gains in the second hop [16].
The main challenges in our DBF scheme are the syn-chronization of radio-frequency carriers at the different RSs [17] and the estimation of each individual channel gain that the main receiver observes from each RS antenna in the second hop. An adaptive 1-bit feedback DBF algo-rithm that tries to solve these problems was developed by Mudumbai et al. in [18]. In the so-called Mudum-bai’s algorithm, random phase perturbations are applied independently in every disperse antenna element at each iteration, but only those phase perturbations that improve the receivedsignal-to-noisepowerratio(SNR) at the main receiver are retained. Even though Mudumbai’s algorithm is simple to implement in practice, in this paper, we take a slightly different approach. We assume that the main receiver has the capability to estimate the phases of indi-vidual channel gains from each RS antenna in the second hop, using anN-bit uniform quantizer. This assumption is in line with different usage cases that are currently under study in 3GPP standardization, where the cellu-lar network is proposed to assist a very cellu-large number of wireless-enabled devices and carry out control duties in, e.g., device-to-device communications [19].
on a per-RS basis along a proper time span (proportional to the coherence time of the wireless channel) that keeps the cost of control mechanisms at reasonable levels. To complement the research presented in [4], in this work, we study the effect of limited phase feedback informa-tion, deriving closed-form approximations to characterize three different physical layer performance measures: out-age probability, ergodic capacity (i.e., mean achievable data rate), and bit error probability. Based on the pre-sented analysis, we conclude that a relatively small amount of phase signaling information (i.e.,N= 3 phase feedback bits per individual antenna) is sufficient to obtain a per-formance close to the one observed in the case of perfect channel phase information in the second hop.
The rest of the paper is organized as follows. Section 2 presents the system model, the assumptions on the limited feedback DBF algorithm, and the details of the perfor-mance criterion that will be used to carry out the analysis. Section 3 provides a closed-form expression for the prob-ability distribution function of the received SNR of the system and then extends to the analysis of different per-formance measures. Section 4 presents numerical results that measure the effect of both the amount of feedback bits per channel and the number of network elements in the selected performance criteria. Finally, conclusions are drawn in Section 5. To facilitate the reading, most fre-quently used abbreviations are listed in the ‘Abbreviations’ section.
2 System model
The layout of our cooperative relaying system is illustrated in Figure 1. The system consists of a main transmitter, a main receiver, and a cluster of Mactive RSs (in fixed positions) that provides the array elements of the DBF scheme that is implemented in the second hop. All devices are equipped with a single transmit/receive antenna. In our system model, the main transmitter and the RSs in
the cluster operate in half-duplex mode, in a
decode-and-forward (DF) fashion. Thus, during the first hop of durationT1, the message intended for the main receiver is sent from the main transmitter to the nearby array ele-ments (i.e., the antennas of the distributed RSs). During the second hop of durationT2, the message is sent from the array elements to the main receiver. It is assumed that the array elements share the same physical location with the main transmitter (e.g., same room or office). The average (distance-dependent) path loss attenuations in the links of the first hop are assumed to be small, and chan-nel gains are either considered static or slowly varying (e.g., line-of-sight channel model). This makes it possi-ble to assume that communication in the first link can be accomplished with (almost) no cost in terms of power and/or time (i.e.,T1T2). However, if the array elements were distributed in different locations with respect to the
main transmitter (e.g., in different rooms), the penetra-tion losses caused by the walls and floors would increase the cost of communication in the first hop. Nevertheless, the longer distance that would typically exist between the clustered array elements and the main receiver in our pro-posed indoor-to-outdoor channel model implies a larger average path loss attenuations in the links of the second hop when compared with the ones of the first hop. In addi-tion, it is also reasonable to consider that the chance of having aline-of-sight(LoS) connection is much lower in the second hop when compared with the probability of having a LoS link in the first one. All these assumptions make the second hop the bottleneck of the system; so, its analysis is the main objective of this paper. Particularly, we focus on the forward direction of the communication link (i.e., from main transmitter to main receiver) due to, as opposed to the main receiver, transmit power of RSs should be kept low to reduce their deployment cost as much as possible.
As depicted in Figure 1, a low-rate, reliable, and delay-free feedback channel exists between the main receiver and the elements of the disperse antenna array (i.e., the cluster of RSs). The main receiver uses this feedback chan-nel to convey the quantized phase adjustment that each element of the antenna array should apply in transmis-sion to maximize the SNR in reception. In other words, the limited feedback information that the main receiver reports is used to establish a DAS in the second hop. Multiple active array elements transmit cooperatively at the same time, focusing the resulting beam towards the direction of the intended destination over the second hop.
Based on the model presented above, the signal that the main receiver experiences (in a spectrum portion with a flat frequency response) at transmission time interval i attains the following (dot product) form:
r[i]=(h[i]·x[i])+n=(h[i]·w[i])s+n, (1)
where x[i]= (x1[i]. . .xM[i])is a row vector that con-tains the transmitted signals in the second hop (one per element in the cluster of RSs),h[i]= (h1[i]. . .hM[i])is the aggregate row channel vector (with zero-mean com-plex Gaussian coefficients) that contains the channel gains from each RS to the common receiver, andnisadditive white Gaussian noise(AWGN) with powerPN. Transmit vectorx[i] is related to the common information symbols via linear beamforming, wherew[i]=(w1[i]. . .wM[i])is a beamforming vector that determines the phase that each RSmshould apply (before its transmission) on the infor-mation intended for the common receiver (w[i]2 = 1 should be verified). Power control is not applied in the array elements, and thus, the total transmit powerPtx in the second hop remains fixed during the whole duration of the communication.
The received SNR that the main receiver experiences at transmission time intervaliis then given by the following:
γ[i]=|h[i]·w[i]| 2E{|s|2}
PN =
M
m=1
γm[i]wm[i]ejψm[i] 2
,
(2)
where
γm[i]= Ptx
Lm[i]PN m=1,. . .,M (3)
represents the mean received SNR from themth array ele-ment,Lm[i] is the total path loss attenuation for themth signal path (i.e., combines distance-dependent average path loss and shadow fading), ψm[i] is the correspond-ing channel phase response, and wm[i]∈ C1×1 is the beamforming weight that themth array element applies in transmission.
2.1 General assumptions
In our system model, the mean SNR in Equation 3 is assumed to be invariant in a time scale that is propor-tional to the duration of a data session (since all RSs in the second hop admit a fixed location). Thus, the chan-nel is considered not to change significantly in time, and therefore, γm[i]= γm, ψm[i]= ψm is assumed. Based on the time invariant nature of the system, we can also ignore the time index i from the weights wm[i]’s (that are used to perform phase adjustments at the mth ele-ment of the antenna array). In the presence of channel gains that remain static during the whole duration of the data session, the feedback messages for phase adjustments at the different RSs can spread over an appropriate time
span (i.e., i = 1, 2,. . .,I). Thus, the presented perfor-mance analysis considers the resulting sum channel when all phase adjustments have been appropriately performed (i.e., afterItime intervals of the sequential DBF algorithm that is implemented).
It is also assumed that phasesψmare samples of inde-pendent and identically distributed (i.i.d.) uniform ran-dom variables(RVs), taking values in the interval(−π,π ). The performance of the proposed DBF algorithm is studied over a random initial phase configuration (i.e., with noa prioriinformation). To fulfill the accurate tim-ing requirements at each element of the disperse antenna array, we assume that each RS in the cluster is able to monitor standard synchronization signals either from the destination (i.e., the main receiver) in the reverse link or from the source (i.e., the main transmitter) in the forward link [17].
If the proposed DBF system is not properly designed, the signal phase shifts that each individual array element apply may create a frequency selective behavior in the equivalent channel that results in the second hop (i.e., increased multipath effect). Yet, in our system model, we assume that the elements of the antenna array are per-fectly synchronized or that the synchronization error is small compared to the symbol length. As a consequence, the delay spread of the effective channel will not be (con-siderably) increased in this situation.
2.2 Limited feedback scheme
As shown in Figure 1, in the second hop of the
communication link there are M active array
ele-ments transmitting the same complex symbols s to the
main receiver. In order to maximize the SNR at the main receiver, each array element adjusts its transmit-ted signal using a complex, individual beamforming weight
wm=
1 Me
−jφm, φ
m∈Q,
Q=
(2n−1) π
2N : n=1,. . ., 2 N
,
(4)
The selection of phasesφm’s is done at the main receiver and is carried out as follows:
1. The receiver first estimates the phasesψmfrom each element of the distributed antenna array, using a specific signal as reference.
2. It then selects the phasesφmfrom quantization setQ such that|θm| = |φm−ψm|is minimized.
As a result, adjusted phasesθmwill be uniformly i.i.d. in the interval−π/2N,π/2N [20]. Thus, phase adjustments are done independently, using a common phase reference at the receiver side.
3 Performance analysis
In this paper, three different performance measures that have been extensively studied in the literature are com-puted [21]:
1. Ergodic capacity. It represents the long-term average transmission. It can be achieved implementing coding schemes that span code words over several coherence time intervals of the fading channel (valid for applications with no strict delay constraints). 2. Outage probability. It constitutes a more appropriate
performance indicator in case of constant-rate delay-limited transmissions, where coding must be carried out over a single channel realization. Represents the probability that an outage occurs within a specified time period because target data rate cannot be achieved within current channel conditions. 3. Bit error probability. It identifies the probability of
making a wrong estimation (in reception) of the information bit that is being transmitted.
Before starting the computation of the previous per-formance measures, we need to determine suitable expressions for probability density function (PDF) and cumulative distribution function (CDF) of the received SNR in the second hop. According to the system model presented in section 2, the expression for SNR attains the following form: are known and remain constant due to the static location of transmitters and receiver during the whole duration of communication. Since we want to analyze the effect of feedback signaling resolution (i.e.,N) and the number of elements in the antenna array (i.e.,M) in the perfor-mance of the DBF system, suitable expressions for the PDF fγ[i]|γ1,. . .,γM and CDF Fγ[i]|γ1,. . .,γM are
required. Unfortunately, a treatable closed-form expres-sion for these distributions can only be obtained for very specific situations (i.e., not for all values of M and N). However, since in this paper we are interested in studying performance when the number of elements in the dis-tributed antenna array is high (i.e., whenM≥10), we will use the central limit theorem to show that RV presented in Equation 5 can be accurately approximated as the sum of two independentchi-squared(χ2) distributed RVs (one central and one non-central), each with one degree of freedom.
3.1 PDF approximation for a large number of array elements
Due to the Euler’s formula, the RV
H[i]=Ptx/PN
h[i]·w[i] =XR[i]+jXI[i] (6)
can be written in terms of its real and imaginary parts, with
Based on the fact that Mis large, we use the central limit theorem to claim that both real and imaginary parts ofH[i] are Gaussian with meansμRandμI, respectively [22]. Since the imaginary part of H[i] is a sum of sine functions with symmetrically distributed phases, its mean equals zero (i.e., individual phases θm[i] are uniformly i.i.d. in interval (−π/2N,π/2N) for all m, and the sine function is an odd function). Similarly, it is possible to show that the expected value of the real part of H[i] is non-negative (actually,μR=0 only whenN=0). Based on the discussion presented in the Appendix, we claim that it is possible to approximate RV|XI[i]|2as a centralχ2 dis-tribution with 1 degree of freedom and RV|XR[i]|2as a non-centralχ2distribution with 1 degree of freedom and non-centrality parameters21(unknown for the moment). Finally, the parameters that are required to use the pro-posed approximation for the PDF and CDF of the received SNR can be obtained from the first two raw moments of RVsXR[i] andXI[i], whose closed-form expressions are obtained through simple but tedious computations:
and
As shown in the Appendix, the PDF for the received SNR that our DBF algorithm provides (i.e.,Z = |XR|2+ |XI|2) can be now expressed as a weighted sum of non-centralχ2PDFs, i.e.,
are the standard deviations of the real and imaginary parts of Equation 6, respectively ,
Wk(σ1,σ2)=
is the corresponding weighting factor, and
fk(z)= kth order modified Bessel function of the first kind (see the Appendix for more details). As seen in Figure 2, the weighting factor presented in Equation 13 is only signif-icantly different from zero for low values ofk; therefore, only a few terms of the sum in Equation 11 are needed to obtain an accurate approximation for the resulting PDF.
Following a similar procedure, the corresponding CDF for the received SNR can be expressed as a weighted sum of non-centralχ2CDFs, i.e.,
FZ(z)=
is the closed-form expression for a non-central χ2CDF
with 2(k + 1) degrees of freedom and non-centrality
parameter s12, and QM(a,b) is the generalized Marcum Q-function of orderM[23].
0 2 4 6 8 10 12 14 16 18 20
Index of weighting factor
Amplitude of weighting factor
Figure 2Amplitude of different weighting factorWk(σ1,σ2)’s.
They are used to approximate the PDF/CDF of the received SNRγ[i]
as a weighted sum of non-centralχ2PDFs/CDFs with different
degrees of freedom. Channel phase resolutions (bit/RS):N=1 (o),
N=2 (•), andN=3 (+).
3.2 Outage probability
To evaluate the performance of a mobile communication system in practice, it is usually assumed that transmission is successful if the SNR that is observed in reception (for the given transmission time interval) is good enough, or equivalently, if the received SNR value is above a given threshold. In other words, transmission to a given user is said to be feasible if its instantaneous received SNR satisfies the following:
γ[i]≥γ0, (17)
where the thresholdγ0is selected to guarantee a certain quality of service (for the given transmission rate). In this situation, the statistical performance requirement
Pr{γ[i]≤γ0} =Prout(γ0) (18)
is defined as the outage probability of the mobile com-munication system, for the given target SNR value γ0. Note that the closed-form CDF expression derived in Equations 15 and 16 can be used to compute the outage probability of the system in a straightforward way.
3.3 Ergodic capacity
The ergodic capacity [23] is defined as follows:
is a reference average SNR for the second hop of our distributed antenna system and
z= |h[i]·w[i]|2 (21)
can be approximated as the sum of twoχ2distributions, a central and a non-central one, with 1 degree of freedom in both cases (see Section 3.1 for more details).
3.3.1 No channel signaling
When there is no channel signaling (i.e.,N=0), it is pos-sible to see that the PDFs of both RVsXRandXIfollow a Gaussian distribution with zero mean and identical vari-ance (i.e., σ12 = σ22 = σ2). Since these RVs can be interpreted as the real and imaginary components of a circularly symmetric complex Gaussian RV, it is possible to conclude that RVZ will be exponentially distributed according to the following:
fZ(z)=βe−βz, β= 1
2σ2. (22)
Then, plugging Equation 22 in Equation 19 and using rela-tion derived in Appendix C of [24], we get the following:
C(γ )=log2(γ )¯ +log2(e)
is the exponential integral function of the first order [25]. 3.3.2 Limited channel signaling
In the presence of limited channel signaling (i.e., when
N ≥ 1), the previous analysis does not hold anymore.
Thus, to find a suitable closed-form expression in this sit-uation, we plug approximation (11) in Equation 19, i.e.,
C(γ )= sented in Equation 14. Since the exact computation of Equation 25 is not simple in this situation, a well-known approximation is used instead. It is known that when an RV is concentrated near its mean, Jensen’s approximation
E{g(z)} ≤g(E{z}) (26)
gets particularly accurate when ‘g(·)’ is a concave func-tion [22]. To analyze the degree of variability of RV Z
around its mean, we propose to use the following fading figure:
can be computed with the aid of closed-form expressions derived in Equations 9 and 10; see reference [24] for more details. It can be seen from Table 1 that the values of fad-ing figures are always larger than 1, and they tend to grow asMandNincrease. The only exception is the caseN=0, where no coherent combining gain is possible due to the absence of channel feedback information to carry out the co-phasing procedure in transmission; thus, in this par-ticular situation, the fading figure parameter takes values close to 1 in all cases (and tends asymptotically to the uni-tary value since the central limit theorem starts to work in a better way when the number of distributed antenna elementsMgrows large). It is important to highlight that caseN=0 was analyzed separately in Section 3.3.1, follow-ing a different approach with respect to the case where limited channel signaling is available.
Therefore, closed-form approximation
results, providing a good solution for feedback resolu-tions that verifyN≥1. Actually,closed-form formula (29) provides a strict upper bound for the ergodic capacity, which becomes asymptotically optimal as the channel phase resolution grows large (i.e., asN→ ∞).
3.4 Bit error probability
The average bit error probability can be expressed using
Pe=
is the error rate when the modulation scheme is BPSK.
Table 1 Fading figure values of received SNR in the presence of differentNandM
Feedback resolutions M=10 M=20
N=0 1.112 1.053
N=1 12.62 23.18
N=2 262.0 521.4
WhenfZ(z)is the PDF of a non-centralχ2distributed
RV with ndegrees of freedom, the average BEP can be
written as follows:
whereM=n/2 is the multichannel order,
κ= s
2
2σ2 (33)
is the ratio between the energy of the deterministic com-ponent and the average received energy via the random component
is the confluent hypergeometric function, where
(b)n= (b+n)
(b) (36)
is the so-called Pochhammer’s symbol (also known as ris-ing factorial) [25]. WhenM=1, the error rate is given by
Pe(1)=Q(u,w)−
For more details, see [26].
Based on the previous formulas, it is possible to show that the BEP that the distributed antenna system provides in the second hop, when the SNR at the main receiver is approximated as a weighted sum of non-centralχ2 dis-tributions with different degrees of freedom, attains the following closed-form expression:
In this section, we analyze the performance of the pro-posed (coherent) DBF algorithm based on the previously presented analyses. We investigate the corresponding out-age probability, ergodic capacity, and bit error proba-bility for different amounts of channel phase signaling (i.e., diverse N), for different channel amplitude models (dependent on the physical location of the cooperative network elements), and for various numbers of active RSs (i.e., diverseM).
Regarding the long-term part of the channel model, we consider that the mean received SNRs from the differ-ent array elemdiffer-entsγm’s are assumed to be fixed over the whole duration of the data communication. In addition, in those cases where array elements are grouped into two different clusters (with exactly half the number of active array elements in each one), we use the notation
δ= γ(1)
γ(2) (40)
to represent the power imbalance situation between both groups. Here,γ(1)andγ(2)represent the individual aver-age SNRs of the active array elements in the first cluster (stronger channel gains) and the second cluster (weaker channel gains), respectively. The channel amplitudes from different array elements in the second hop are random samples of a Rayleigh distribution, with unitary second raw moment. This is equivalent to say that the individ-ual instantaneous SNR values (observed from each of the array elements in the second hop) are considered to be exponential i.i.d. RVs, with unitary mean valueγm=1.
4.1 Outage probability
0 2 4 6 8 10 0
0.1 0.2 0.3 0.4 0.5 0.6 0.7 0.8 0.9 1
Received SNR Threshold (γ0)
Outage Probability (Pout)
Figure 3Outage probability as a function of SNR thresholdγ0
for a DBF withM=10array elements.Solid lines: no CSI (◦),N=1 (),N=2 (),N=3 (∇). Dashed-dotted line denotes full CSI at array elements. Simulated values are denoted by (∗). Channel amplitudes from different array elements in the second hop are random samples of a Rayleigh distribution, with unitary second raw moment (i.e., γm=1).
array elements (e.g., whenM=20), the obtained approxi-mation shows a similar behavior with better accuracy (the figures that show this behavior are not included since they do not bring new insights in the main matter of the paper). In Figure 3, the outage probability in absence of channel phase signaling is used as a baseline. It is found that per-formance in terms of outage probability clearly increases with additional phase bits in the feedback link. We also note that ifN=3, then the performance of DBF algorithm is very close to the one observed with full CSI at the elements of the distributed antenna array.
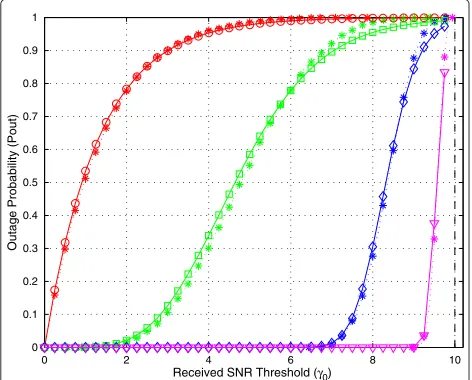
Figure 4 shows the outage probability for a given SNR threshold when implementing the DBF algorithm in dif-ferent channel power imbalance situations in the presence ofM=10 active array elements. In this case, array elements are grouped in two clusters (of the same size) that are located at different distances from the main receiver. Note that mean received SNR values for different antenna ele-ments were selected to guarantee the same performance for different channel power imbalance situations, in the absence of signaling information (this is the reason why different performance curves overlap for different chan-nel power imbalance situations whenN=0). Solid lines, dashed lines, and dotted lines represent perfect channel
power balance (i.e.,δ = 0 dB), medium channel power
imbalance (i.e.,δ=3 dB), and high channel power imbal-ance (i.e., δ = 6 dB) situations, respectively. Based on the results, we observe that the power imbalance level in the channel amplitude model increases the outage
prob-0 2 4 6 8 10
0 0.1 0.2 0.3 0.4 0.5 0.6 0.7 0.8 0.9 1
Received SNR Threshold (γ0)
Outage Probability (Pout)
Figure 4Outage probability as a function of SNR thresholdγ0
for DBF with 10 array elements.Solid lines: perfect channel power balance (i.e.,δ=0dB). Dashed lines: medium channel power imbalance (i.e.,δ=3dB). Dotted lines: large channel power imbalance (i.e.,δ=6dB). Channel feedback: no CSI (red),N=1 (green),N=2 (blue), andN=3 (magenta). Dashed-dotted line (black): full CSI at array elements. Channel amplitudes are fixed according to the different channel power imbalance situations.
ability of the DBF algorithm. The larger the number of phase bits N, the larger is this the impairment in abso-lute values. The same behavior is visible when the number of active array elements increases (again, these figures are not included since those results are similar to the ones that are observed in Figure 4). As expected, in the pres-ence of individual channel gains with different average path loss characteristics (i.e., with different long-term sig-nal strength), the variability of the received SNR increases at the main receiver, causing a less abrupt improvement in the sigmoid function of the CDF as the value ofγ0grows.
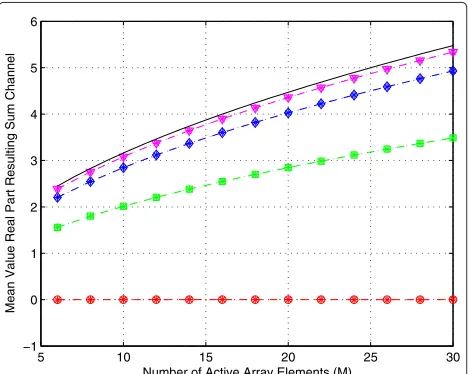
Finally, Figure 5 presents the maximum SNR thresh-old that can be guaranteed for a given outage probability when implementing the proposed DBF algorithm in a per-fect channel power balance case (i.e., when δ = 0 dB). These curves admit almost linear behavior with respect to the number of active array elementsM. Based on these curves, we observe that the gap between the different out-age probability curves decreases as N grows. This is in accordance with the behavior of the expected value of the real part of the sum channel (i.e.,μR), given in Equation 8 and presented in Figure 6.
4.2 Ergodic capacity
5 10 15 20 25 30 0
5 10 15 20 25 30
Number of Active Array Elements (M)
Received SNR Threshold (
γ0
)
Figure 5Required SNR thresholdγ0for DBF to guarantee a
given outage probability.It is presented a function of the number active array elements. Outage probability:Prout=0.02(◦), Prout=0.1(), andProut=0.5 (). Channel feedback: no CSI (red), N=1 (green),N=2 (blue), andN=3 (magenta). Solid (black) line: full CSI at array elements. Simulated values are denoted by (∗). Channel amplitudes are fixed with perfect power balance.
to model the individual channel amplitudes in the sec-ond hop. In the case of limited channel phase signaling, the curves were plotted based on approximation (26). In the absence of channel phase signaling (i.e., forN=0), the closed-form expression (23) was used. Simulated point values (∗) are also included to verify the accuracy of the
5 10 15 20 25 30 −1
0 1 2 3 4 5 6
Number of Active Array Elements (M)
Mean Value Real Part Resulting Sum Channel
Figure 6Expected value for the real part of the sum channelμR.
It is presented as a function of the number active array elements. Dashed lines: no CSI (◦),N=1 (),N=2 (), andN=3 (∇). Solid (black) line: full CSI at array elements. Simulated values are denoted by (∗). Channel amplitudes are fixed with perfect power balance.
0 5 10 15 20 25 30
2 3 4 5 6 7 8 9
Number of Active Array Elements (M)
Ergodic Capacity [bits/s/Hz]
Figure 7Ergodic capacities for different numbers of phase bits.
They are presented as a function of the number of active array elements when the average SNRγ=10dB. Dashed lines represent the following theoretical curves:N=0 (◦),N=1 (),N=2 (), andN=3 (). Solid (black) line: full CSI at RSs. Simulated values are denoted by (∗). Channel amplitudes are fixed with perfect power balance.
approximation that was proposed to estimate the val-ues of the ergodic capacity in the different situations. Note that, as expected, the ergodic capacity performance increases when both the resolution of the channel phase information and the number of cooperative network ele-ments grow. The solid (black) line in Figure 7 represents the asymptotic upper bound with full CSI at the RSs. Note that the proposed approximation provides results very close to the theoretical upper bound, even when the channel phase feedback resolution takes values as low as N=3 bits/RS.
4.3 Bit error probability
0 1 2 3 4 5 6 7 8 9 10 5.5
6 6.5 7 7.5 8 8.5
Number of Feedback Bits (N)
Ergodic Capacity [bits/s/Hz]
Figure 8Ergodic capacities for different number of active array elements.They are presented as a function of the number of phase bits when the average SNRγ =10dB. Solid lines represent the theoretical curves:M=10 (),M=20 (), andM=30 (). Simulated values are denoted by (∗). Channel amplitudes are fixed with perfect power balance.
phase resolution exceedingN=3 bits/RS does not provide additional improvements in the end-to-end performance of our DBF architecture.
In the light of all results, we conclude that there is
no reason to use more than N=3 bits/RS to
imple-ment a DBF algorithm in a cooperative wireless scenario, provided that the number of cooperative antennas is large enough. Yet, the performance that is obtained with
0 2 4 6 8 10 12 14
10−7 10−6 10−5 10−4 10−3 10−2 10−1
Mean Received SNR (dB)
Bit Error Probability
Figure 9Bit error probabilities for different number of phase bits.The number of active array elements isM=20. Dashed lines represent the theoretical models:N=1 (),N=2 (), andN=3 (∇). Simulated values denoted by dotted lines with (∗). Solid (black) line represents the AWGN channel lower bound. Channel amplitudes are fixed with perfect power balance.
N=1 bit/RS is not good enough. However, the
perfor-mance obtained withN=2 bits/RS provides a reasonable trade-off betweenthe costof signaling overhead andthe benefitthat the improvement in the different performance measures under analysis (i.e., outage probability, ergodic capacity, and bit error probability) represents.
5 Conclusions
We studied the performance of a DBF algorithm in the presence of different amounts of channel phase feedback information. This analysis was done in the context of a wireless communication system, where the subscriber (main transmitter) receives assistance from a cooperative cluster of network elements that boosts its communi-cation to the macro-base station (main receiver). This cooperative network is formed by a large number of low-cost array elements deployed in the close proximity of the transmitter (e.g., the same room or office). Location of the array elements was assumed to be fixed during the whole duration of data transmission. Due to short distances, the communication over the first hop (i.e., from main trans-mitter to elements of the distributed array) was assumed to be costless in terms of transmission power and radio resource usage. Therefore, the bottleneck of the system model was assumed to be in the second hop (i.e., from the elements of the disperse antenna array to the main receiver).
Three different performance measures were used to study the performance of the DBF algorithm: outage probability, ergodic capacity, and bit error probability. To carry out the analysis, suitable closed-form approxima-tions for the PDF and the CDF of the received SNR in the second hop were derived. The parameters for the approximations were obtained from the first two raw moments of the resulting sum channel that the main receiver observes. With the aid of these PDF and CDF expressions, useful closed-form formulas for the selected performance parameters were derived. All these approxi-mations were validated using numerical simulations. Our analysis revealed that notable gains can be achieved in all performance measures when using a small amount of phase feedback information in the DBF algorithm that is configured in the second hop of our cooperative system scenario.
Appendix
PDF and CDF for sum ofχ2distributions
Let{Xl}nl=1 be independent Gaussian RVs with common varianceσ2and non-negative meanμl. Then, it is possible to show that sum
Y = n
l=1
follows a non-central χ2 distribution withn degrees of freedom [23]. The corresponding PDF expression is given by
is the non-centrality parameter of the distribution and
Iα(x)=
is theαth order modified Bessel function of the first kind [25]. It is known that the characteristic function of non-centralχ2distributed RV is defined in closed-form and is given by to acentralχ2distribution, whose PDF expression forn degrees of freedom is given by
fc,n(y)=
represents the Gamma function [23]. The characteristic function in this situation is given by
c,n(ω)=
Let us now assume that
Z=Y1+Y2 (49)
is the combination of two independent χ2 RVs: a
non-central χ2 RV with non-centrality parameter s12 and variance σ12, and a central χ2RV with varianceσ22.Let us consider that the degrees of freedom are equal in both cases (i.e.,n1 = n2 = n). Then, the characteristic
can be inverse-Fourier transformed to yield the following closed-form PDF expression:
When the degree of freedom of bothχ2RVs are unitary (i.e., whenn1 = n2 = 1), it is possible to show that the closed-form expression for the PDF of RVZcan be writ-ten as a weighted sum of non-centralχ2distributions with different degrees of freedom, i.e.,
fZ(z)=
the non-centralχ2distribution presented in (42), where 2(k+1)are the degrees of freedom of the different terms of the sum. It is also possible to show that the CDF in this situation admit the following form:
FZ,n(z) =
is the generalizedMth order MarcumQ-function [23]. In similar fashion to a previously presented PDF expansion, it is also possible to show that the CDF of RVZ (when
non-centralχ2distributions with different degrees of freedom,
is the CDF of a non-central χ2 distributed RV with n
degrees of freedom and parameterss12andσ12.
Abbreviations
AWGN: Additive white Gaussian noise; BS: Base station; CDF: Cumulative distribution function; CSI: Channel state information; DAS: Distributed antenna system; DBF: Distributed Beamforming; DF: Decode-and-forward; FBS: Femto-base station; i.i.d.: Independent and identically distributed; MBS: Macro-base station; PDF: Probability density function; RS: Relaying station; RV: Random variable; SINR: Signal-to-interference-plus-noise power ratio; SNR: Signal-to-noise power ratio; UE: User equipment.
Competing interests
The authors declare that they have no competing interests.
Author’s information
JH received his M.Sc. and Ph.D. degrees from the University of Oulu, Finland, in 1992 and 1998, respectively. From 1999 to the end of 2007, he was with Nokia and Nokia Siemens Networks where he worked on various aspects of mobile communication systems. Since 2008, he has been a professor in the Department of Communications and Networking in Aalto University. His current research interests include multi-antenna transmission and reception techniques, scheduling, relays, small cells, and design and analysis of wireless networks in general. He is an author or co-author to around 130 scientific publications and 35 US patents or patent applications. AAD was born in San Nicolas, Province of Buenos Aires, Argentina in 1978. He received his degree in telecommunications engineering from Blas Pascal University, Cordoba, Argentina in 2002 and his Ph.D. degree from the National University of Cordoba, Argentina in 2010. From 2003 to 2009, he has been with the Digital Communications Research Laboratory, National University of Cordoba, Argentina, carrying out research in the area of MIMO wireless
communications. Since the beginning of 2010, he has been working at the Department of Communications and Networking, Aalto University, Finland, taking a position as post-doctoral researcher. His current research interests lie in the area of interference management for future wireless networks, including multi-antenna schemes, time- and frequency-domain scheduling, and power control techniques. TH was born in Kokkola, Finland in 1982. He received his M.Sc. degree from the University of Oulu, Finland in 2010 and his Licentiate degree from Aalto University, Finland in 2013. He has been working as a researcher at Aalto University since 2010 at the Department of Communications and Networking. His main research interests are in the field of cooperative communication, particularly of distributed beamforming in the context of wireless access network.
Acknowledgements
This work was prepared in NETS2020 and SMAS project frameworks and was supported in part by Finnish Funding Agency for Technology and Innovation, Academy of Finland (under grant 133652), Nokia Siemens Networks, Ericsson Finland, Nokia, and Nethawk. This paper was presented in part at the First International Conference on Performance, Safety and Robustness in Complex Systems and Applications (PESARO) 2011.
Author details
1Department of Communications and Networking, Aalto University, P.O. Box
13000, Aalto FI-00076, Finland.2Ericsson R&D Center, Elektroniikkatie 10, Oulu
FI-90590, Finland.
Received: 21 June 2012 Accepted: 18 March 2013 Published: 26 April 2013
References
1. ITU, Assessment of the global mobile broadband deployments and forecasts for international mobile telecommunications. Report ITU-R M.2243 (00/2011), ITU (2011), pp. 1–96
2. Ericsson, More than 50 billion connected, devices. White paper, Ericsson, 1–12 (2011)
3. S Liu, J Wu, CH Koh, V Lau, A 25 Gb/s(/km2) Urban wireless network
beyond IMT-advanced. IEEE Commun. Mag.49(2), 122–129 (2011) 4. AA Dowhuszko, T Halinen, J Hämäläinen, O Tirkkonen, inProceedings of
the First International Conference on Performance, Safety and Robustness in Complex Systems and Applications, (PESARO). Performance of relay-aided distributed beamforming techniques in presence of limited feedback information (IARIA, Budapest, Hungary, April 17–22, 2011, pp. 28–34 5. G Mansfield, inFemto Cells Europe. Femtocells in the US market–business
drivers and consumer propositions AT&T, June 2008), pp. 23–25 6. R Pabst, B Walke, D Schultz, P Herhold, H Yanikomeroglu, S Mukherjee, H
Viswanathan, M Lott, W Zirwas, M Dohler, H Aghvami, DD Falconer, GP Fettweis, Relay-based deployment concepts for wireless and mobile broadband radio. IEEE Commun. Mag.42(9), 80–89 (2004)
7. M Husso, J Hämäläinen, R Jänti, J Li, E Mutafungwa, R Wichman, Z Zheng, AM Wyglinski, Interference mitigation by practical transmit beamforming methods in closed femtocells. EURASIP J. Wireless Commun. Netw.2010, 1–12 (2010)
8. V Chandrasekhar, J Andrews, A Gatherer, Femtocell networks: a survey. IEEE Commun. Mag.46(9), 59–67 (2008)
9. M Kuhn, S Berger, I Hammerstom, A Wittneben, Power line enhanced cooperative wireless communications. IEEE J. Sel. Areas Commun.
24(7), 1401–1410 (2006)
10. H Li, J Hajipour, A Attar, VCM Leung, Efficient HetNet implementation using broadband wireless access with fiber-connected massively distributed antennas architecture. IEEE Commun. Mag.18(3), 72–78 (2011) 11. A Özgür, OD Lévêque, NC Tse, Hierarchical cooperation achieves optimal
capacity scaling in ad hoc networks. IEEE Trans. Inform. Theory.
53(10), 3549–3572 (2007)
12. Q Li, RQ Hu, Y Qian, G Wu, Cooperative communications for wireless networks: techniques and applications in LTE-advanced systems. IEEE Wireless Commun.19(2), 22–29 (2012)
13. Z Ding, WH Chin, K Leung, Distributed beamforming and power allocation for cooperative networks. IEEE Trans. Wireless Commun.
7(5), 1817 –1822 (2008)
14. X Chen, S Song, K Letaief, inProceedings of IEEE International Conference on Communications. Transmit and cooperative beamforming in multi-relay systems (IEEE Cape Town, South Africa, 23–27 May 2010), pp. 1–5 15. R Mudumbai, D Brown, U Madhow, H Poor, Distributed transmit
beamforming: challenges and recent progress. IEEE Commun. Mag.
47(2), 102–110 (2009)
16. Y Jing, B Hassibi, Distributed space-time coding in wireless relay networks. IEEE Trans. Wireless Commun.5(12), 3524–3536 (2006)
17. D Gesbert, S Hanly, H Huang, S Shamai, O Simeone, W Yu, Multi-cell MIMO cooperative networks: a new look at interference. IEEE J. Sel. Areas Comm.
28(9), 1380–1408 (2010)
18. R Mudumbai, G Barriac, U Madhow, On the feasibility of distributed beamforming in wireless networks. IEEE Trans. Wireless Commun.
6(5), 1754 –1763 (2007)
19. L Lei, Z Zhong, C Lin, X Shen, Operator controlled device-to-device communications in LTE-advanced networks. IEEE Wireless Commun.
19(3), 96–104 (2012)
21. E Biglieri, J Proakis, S Shamai, Fading channels: information-theoretic and communications aspects. IEEE Trans. Inf. Theory.44(6), 2619 –2692 (1998) 22. A Papoulis,Probability, Random Variables, and Stochastic Processes, 3rd
edn. (McGraw-Hill, New York, 1991)
23. JG Proakis,Digital Communications, 4th edn. (McGraw-Hill, New York, 2001)
24. AA Dowhuszko, G Corral-Briones, J Hämäläinen, R Wichman, On throughput-fairness tradeoff in virtual MIMO systems with limited feedback. EURASIP. J. Wireless Commun. Netw.2009, 1–17 (2009) 25. M Abramowitz, IA Stegun,Handbook of Mathematical Functions: With
Formulas, Graphs, and Mathematical Tables. (Dover Publications, New York, 1970)
26. WC Lindsey, Error probabilities for Rician fading multichannel reception of binary and N-ary signals. IEEE Trans. Inf. Theory.10(4), 339–350 (1964)
doi:10.1186/1687-6180-2013-88
Cite this article as:Halinenet al.:Performance of distributed beamform-ing for dense relay deployments in the presence of limited feedback information.EURASIP Journal on Advances in Signal Processing20132013:88.
Submit your manuscript to a
journal and benefi t from:
7 Convenient online submission
7 Rigorous peer review
7 Immediate publication on acceptance
7 Open access: articles freely available online
7 High visibility within the fi eld
7 Retaining the copyright to your article

![Figure 2 Amplitude of different weighting factor Wk(σ1, σ2)’s.They are used to approximate the PDF/CDF of the received SNR γ [ i]as a weighted sum of non-central χ2 PDFs/CDFs with differentdegrees of freedom](https://thumb-us.123doks.com/thumbv2/123dok_us/905210.1109296/6.595.303.539.86.268/amplitude-different-weighting-approximate-received-weighted-central-differentdegrees.webp)