Open Access
Proceedings
Detecting disease-causing genes by LASSO-Patternsearch
algorithm
Weiliang Shi*
1, Kristine E Lee
2and Grace Wahba
3Address: 1Department of Statistics, University of Wisconsin Madison, 1300 University Avenue, Madison, Wisconsin 53706, USA, 2Department of
Ophthalmology & Visual Sciences, University of Wisconsin Madison, 610 North Walnut, 4th Floor WARF, Madison, Wisconsin 53726, USA and
3Departments of Statistics, Biostatistics and Medical Informatics and Computer Sciences, University of Wisconsin Madison, 1300 University
Avenue, Madison, Wisconsin 53706, USA
Email: Weiliang Shi* - [email protected]; Kristine E Lee - [email protected]; Grace Wahba - [email protected] * Corresponding author
Abstract
The Genetic Analysis Workshop 15 Problem 3 simulated rheumatoid arthritis data set provided 100 replicates of simulated single-nucleotide polymorphism (SNP) and covariate data sets for 1500 families with an affected sib pair and 2000 controls, modeled after real rheumatoid arthritis data. The data generation model included nine unobserved trait loci, most of which have one or more of the generated SNPs associated with them. These data sets provide an ideal experimental test bed for evaluating new and old algorithms for selecting SNPs and covariates that can separate cases from controls, because the cases and controls are known as well as the identities of the trait loci. LASSO-Patternsearch is a new multi-step algorithm with a LASSO-type penalized likelihood method at its core specifically designed to detect and model interactions between important predictor variables. In this article the original LASSO-Patternsearch algorithm is modified to handle the large number of SNPs plus covariates. We start with a screen step within the framework of parametric logistic regression. The patterns that survived the screen step were further selected by a penalized logistic regression with the LASSO penalty. And finally, a parametric logistic regression model were built on the patterns that survived the LASSO step. In our analysis of Genetic Analysis Workshop 15 Problem 3 data we have identified most of the associated SNPs and relevant covariates. Upon using the model as a classifier, very competitive error rates were obtained.
from Genetic Analysis Workshop 15
St. Pete Beach, Florida, USA. 11–15 November 2006
Published: 18 December 2007
BMC Proceedings 2007, 1(Suppl 1):S60
<supplement> <title> <p>Genetic Analysis Workshop 15: Gene Expression Analysis and Approaches to Detecting Multiple Functional Loci</p> </title> <editor>Heather J Cordell, Mariza de Andrade, Marie-Claude Babron, Christopher W Bartlett, Joseph Beyene, Heike Bickeböller, Robert Culverhouse, Adrienne Cupples, E Warwick Daw, Josée Dupuis, Catherine T Falk, Saurabh Ghosh, Katrina A Goddard, Ellen L Goode, Elizabeth R Hauser, Lisa J Martin, Maria Martinez, Kari E North, Nancy L Saccone, Silke Schmidt, William Tapper, Duncan Thomas, David Tritchler, Veronica J Vieland, Ellen M Wijsman, Marsha A Wilcox, John S Witte, Qiong Yang, Andreas Ziegler, Laura Almasy and Jean W MacCluer</editor> <note>Proceedings</note> <url>http://www.biomedcentral.com/content/pdf/1753-6561-1-S1-info.pdf</url> </supplement>
This article is available from: http://www.biomedcentral.com/1753-6561/1/S1/S60 © 2007 Shi et al; licensee BioMed Central Ltd.
Background
Rheumatoid arthritis (RA) is a complex disease with a moderately strong genetic component. Generally, females are at a higher risk than males and the mean onset of dis-ease is in the fifth decade. Many studies have implicated the HLA region on 6p21 with consistent evidence for sev-eral of the DR alleles contributing to risk. There remains much to learn about the genetic susceptibility for rheuma-toid arthritis and possible gene and environmental inter-actions.
Identification of disease-causing genes requires extensive evaluation of multiple potential genetic sites. The current trends in genetic epidemiology are to evaluate thousands of single-nucleotide polymorphisms (SNPs) along the chromosome to identify regions where the true disease-causing gene may lie. Tree-structured methods such as CART (classification and regression trees) [1] and Logic regression [2] usually select variables sequentially, and hence may miss the overall correlation structure of the variables. Random forest [3], which grows a large number of classification or regression trees with no trimming or pruning, has gained popularity in the analysis of genetic data. More recently a forward-stepwise penalized logistic regression [4] has been developed for screening gene-gene interactions, which is also a sequential method. We will be using the penalized likelihood method with the LASSO penalty to select SNPs, gene × gene interactions, and gene × environmental interactions. For Gaussian data the LASSO [5] was proposed as a variant of linear least-squares ridge regression. It was demonstrated that this approach tended to set many of the coefficients to zero, resulting in a sparse model, a property not generally obtained with quadratic penalties. LASSO-Patternsearch algorithm [6] was proposed to search patterns of multiple risk factors in large demographic studies. The core of the method is global, in that it deals with a very large number of patterns simultaneously, as opposed to sequential methods that constitute much of the literature in this area. In this paper, we applied the modified LASSO-Pattern-search algorithm on the simulated RA data from Genetic Analysis Workshop 15 (GAW15). The method has been modified in three places. First, we introduce a screen step to eliminate most of the noise SNPs and their interactions before applying the LASSO step. Second, we only consider the main effects and second-order interactions for compu-tation and interprecompu-tation. And last, we take advantage of the fact that we can extract separate training, tuning, and test data sets, all generated from the same (simulated) population. Therefore, we choose the tuning parameters by prediction accuracy on the tuning set, and, for quanti-tative comparison with other methods, estimate the pre-diction accuracy of the resulting model on the test set.
Methods
Data setWe have chosen to use the simulated data (Problem 3) from GAW15. This data simulation was set up to mimic the familial pattern of RA, including a strong effect of DR type at the HLA 2 locus on chromosome 6. A large popu-lation of nuclear families (two parents and two offspring) was generated. This population contains close to 2 mil-lion sibling pairs (3.6 milmil-lion subjects). RA affection sta-tus was determined for everyone from a complex genetic and environmental model. There were four loci (A on chromosome 16, B on chromosome 8, and C and D both on chromosome 6) in addition to a strong effect of the DR alleles that directly, or through interactions with smoking and gender, modeled RA status. Additional loci modeled severity and other related RA outcomes. From this popu-lation, a random sample of 1500 families was selected from among families with two affected offspring (the affected sib-pair (ASP) group) and another random sam-ple of 2000 families was selected from among families where no member was affected (control group). Within the 2000 families selected for the control group, one off-spring was randomly selected to be in the final control group.
Microsatellites and SNPs were generated on 22 auto-somes. These markers were designed to be like real human autosomes in terms of genetic and physical map lengths. The marker and trait loci were generated to have similar properties, such as linkage disequilibrium, to those observed in real data. We chose to analyze the SNPs, for all controls and the first sibling in the ASP group in Repli-cate 1. In addition, we used similar data from RepliRepli-cates 2 and 3 as tuning and test data sets.
LASSO-Patternsearch algorithm
The LASSO-Patternsearch algorithm [6] is an approach to identify patterns of risk factors that is built on a global core. We modify the original algorithm for use with genetic (SNP) data (add a screen step, consider only main effects and second-order interactions, and tune the smoothing parameters with a tuning set). Through the use of a series of basis functions described below, we can build a model for the relation between phenotype and variables that embodies main effects and two-factor inter-actions ("patterns"). The basis functions we use assume dichotomous risk factors. Responses are coded 1 for cases and 0 for controls; females are coded 1 and males 0; smokers as 1 and non-smokers as 0. Age is the only
con-tinuous risk factor and we code an elder group (≥ 55) as 1
DR4 = 2. For these three level variables, we define basis functions in a generalized way described below, which is equivalent to introducing two dummy variables.
The modified algorithm has three steps:
• Step 0: The Screen step
We first define our coding basis functions to be used: let xj
be the jth variable and x be (x functions for each pair (j, k)). We call these "two-factor interaction" basis functions. These basis functions will be used to code the variables into logistic or penalized logis-tic regression models. Let p(x) be the probability that y = 1, given x, and let f(x) = log[p(x)/(1 - p(x))]. The negative log likelihood function is given by:
We will code the dependence on x by f(x) = μ+ ∑cᐍBᐍ(x),
where the Bᐍwill be specified subsets of the basis
func-tions defined above, and μand {cᐍ} are estimated by
min-imizing L(y, f). The goal is to select those basis functions that encode the variables or pairs of variables that best separate cases from controls.
Because there are more than 9000 SNPs on all 22
chromo-somes, incorporating 9000 main effects and
two-factor interactions, there will be more than 108 basis
functions and we cannot deal with them all simultane-ously. We first prescreen for main effects with a logistic
regression model as follows. For each j = 1,..., N, we find
μ, and to minimize the negative log likelihood L(y,
fj), where . We test the
hypoth-esis at the 0.05 level that is different from 0 and if it is,
the jth variable will go to the second part of the prescreen
step and the basis function (x) will go to Step 1. Note
that each SNP may contribute two basis functions and they are not necessarily significant simultaneously. In that case, the significant basis function will go to the LASSO
step and the SNP is still eligible for the screening of inter-actions. For each pair of variables (xj, xk), we construct the model
and minimize L(y, fjk). We test the hypotheses that the
coefficients are different from 0 at the 0.002
level and the basis functions (patterns) that survive go to Step 1. At this point we would like to select the largest number of candidates that can be comfortably handled by the core global LASSO step. The significance level of 0.002
was chosen in an ad hoc manner to select candidates for
the next step and resulted in a large set that, very roughly, met this goal.
• Step 1: The LASSO step
In this step, we use the LASSO penalty (l1) to do variable
selection. We relabel the basis functions that survive Step 0 as Bl, l = 1, 2..., NB, where NB is the total number of the
basis functions. We estimate f by minimizing
Iλ(y, f) = L(y, f) + λJ(f),
where and .
The smoothing parameter λ balances the trade-off
between data fitting and the sparsity of the model. We will choose the smoothing parameter by the prediction accu-racy on a separate tuning set. This is done as follows: for
each trial value of λ, the minimizer of Eq. (2) produces fλ
(x) and hence pλ(x). We make the important observation
that the ratio of cases and controls in the training set is the same as the ratio of cases and controls in the tuning set. Thus, if one had a perfect estimate of p(x) for the population that generated both the test and tuning set, and costs of mis-classification were the same for both types of misclassifi-cation, then the Bayes rule (to minimize expected cost) for classifying members of the tuning set would be to classify a member as case if p(x) > 0.5 and as a control if p(x) < 0.5 [7]. Therefore we are motivated to examine the actual
error rates on the tuning set, for each choice of λ, by using
pλ(x) = 0.5 as the classifier.
• Step 2: The logistic regression step
Step 1 produces a relatively sparse model, but we have seen a general tendency for the LASSO-Patternsearch to err on the conservative side in selecting basis functions, that is, there is a very high probability of including all relevant
basis functions, at the expense of including some noise terms [6,8]. Thus, we took a closer look at the terms that passed Step 1 by putting them into a parametric logistic regression and testing the significance of each term at level
α. Rather than choose αon an ad hoc basis, it is selected
based on prediction accuracy on the tuning set. The signif-icant term goes into the logistic regression model again and that gives the final model.
It is believed that this multi-step process is an effective procedure to meet two goals simultaneously, sparsity and generalizability, and the results below tend to bear this out.
Results
We selected the first replicate as the training set, the sec-ond replicate as the tuning set, and the third replicate as the test set. In our first pass, we examined age, smoking, and sex as environmental factors, and all chromosome 6 SNPs. The screen step identified 145 main effects and 1439 interactions, while the final model included only 6 main effects and no interactions (Table 1). We found SNP6_153–SNP6_154, which we later (after obtaining the answers) found out were close to locus C, and SNP6_162, which was close to locus D. We also found sex and smoking as expected. Applying this model to predict the RA cases in Replicate 3 as any with an estimated prob-ability >0.5 resulted in a 13.8% error rate, with sensitivity of 85.3% and specificity of 87.0%. In fact, a plot of the prediction error rate as a function of the threshold (not shown) is essentially a convex curve with a minimum of
13.8% for any p between 0.41 and 0.56, verifying the
appropriateness of the use of p = 0.5 as the threshold.
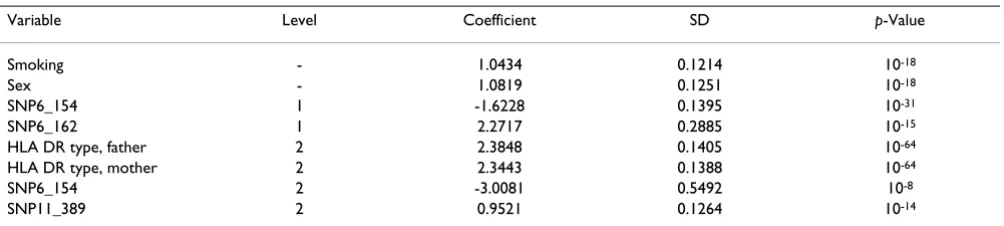
We then expanded our analysis to SNPs on all chromo-somes and included the DR allele from each parent. That gave us 9192 variables, including 9187 SNPs, two DR alle-les from parents, age, smoking, and sex. The main effect screen in Step 0 identified 880 basis functions, corre-sponding to 795 variables. We then screened for the inter-action of these 795 variables and got 1679 interinter-actions. Step 1 included 2559 (880 + 1679) basis functions. The final model identified eight main effects and three interac-tions (listed in Table 2 and 3). The main effects include DR allele from the parents, gender, and smoking, as well as the SNPs from chromosome 6 and an additional SNP on chromosomes 11. All of these were modeled in the simulation: SNP6_154 is close to locus C, SNP6_162 is close to locus D, and SNP11_389 is close to locus F (which modeled severity of IgM). We have also identified three interaction terms, including one within-chromo-some interaction on chromowithin-chromo-some 2 and two between-chromosome interactions. These interactions were not directly modeled in the simulation. The prediction error of this model on Replicate 3 is 12.6%, with sensitivity of 85.5% and specificity of 88.8%. A plot of the prediction error as a function of the threshold is a convex curve with
the minimum error rate of 12.6% for any p between 0.49
and 0.51.
Our method successfully selected many trait loci, but it also missed some. Locus B is on chromosome 8 and it
Table 2: Main effects model on all chromosomes
Variable Level Coefficient SD p-Value
Smoking - 1.0434 0.1214 10-18
Sex - 1.0819 0.1251 10-18
SNP6_154 1 -1.6228 0.1395 10-31
SNP6_162 1 2.2717 0.2885 10-15
HLA DR type, father 2 2.3848 0.1405 10-64
HLA DR type, mother 2 2.3443 0.1388 10-64
SNP6_154 2 -3.0081 0.5492 10-8
SNP11_389 2 0.9521 0.1264 10-14
aFor SNPs, level is the number of variant alleles. For DR type, level = 1 means DR1 and level = 2 means DR4. Table 1: Model on chromosome 6
Variable No. variant alleles at locus Coefficienta SD p-Value
Smoking - 0.8653 0.1088 10-15
Sex - 1.0478 0.1131 10-20
SNP6_153 1 -2.0411 0.1365 10-50
SNP6_154 1 -1.4509 0.1448 10-23
SNP6_162 1 2.2297 0.2767 10-16
SNP6_153 2 -5.5977 0.2707 10-95
increases the RA risk for smokers. We did not find this because locus B is at the end of the chromosome and none of the SNPs are close by. We also missed locus A, which affects the impact of HLA DR types. Another interaction we missed is sex and locus C. We tabulate the raw data in Table 4. According to the solution and the relationship between locus C and SNP6_154, we should see no differ-ence between males and females when SNP6_154 = 2. Females will be at higher risk than males when SNP6_154 = 1 and the difference is even bigger when SNP6_154 = 0. However, there are very few cases when SNP6_154 = 2. We cannot really tell whether there is a difference at this level. Plus, locus C has a strong correlation with the DR allele. Therefore, we ended up with the main effects of sex and SNP6_154 rather than their interaction.
Discussion
The LASSO-Patternsearch algorithm [6] was originally designed for demographic studies in which the data sets are smaller with fewer variables. It is a two-stage method whose core is global, as opposed to sequential methods, like trees and forward-stepwise penalized logistic regres-sion [4]. We added a screen step to the front end here to handle the extremely large number of potential SNP pat-terns. We roughly maximized the number of patterns sur-viving this step within the limits of the core LASSO step, which can handle 4000 basis functions. We believe that this conservative screen step is unlikely to delete impor-tant patterns here. Proof would await our ability to handle larger numbers of basis functions but the results in select-ing relevant SNP patterns here certainly support that belief. The LASSO step took in the resulting large number of basis functions and returned a small fraction of them, retaining the flavor of a completely global algorithm, with the final tuning step removing less significant patterns, chosen as to maximize classification accuracy on the tun-ing set. The LASSO-Patternsearch method is complemen-tary to random forest approaches. The random forest
method is global, but operates quite differently. Thus, LASSO-Patternsearch provides a complimentary tool for the data analyst dealing with very large attribute vectors. LASSO-Patternsearch is also very efficient. Run time for the LASSO step with 2559 basis functions was 30 minutes on our system (3.4 GHz CPU, 3.7 GB memory). Speed and capacity of the algorithm compare well with other methods discussed. Our method was able to identify important SNPs and covariates, and separate cases from controls similar to the best results presented at the meet-ing. We believe that it provides a useful new tool for the analysis of genetic data.
Competing interests
The author(s) declare that they have no competing inter-ests.
Acknowledgements
Research supported in part by grants DMS-0505636, DMS-0604572, N00014-06-1-0095, EY09964, EY06594, and EY13438.
This article has been published as part of BMC Proceedings Volume 1 Sup-plement 1, 2007: Genetic Analysis Workshop 15: Gene Expression Analysis and Approaches to Detecting Multiple Functional Loci. The full contents of the supplement are available online at http://www.biomedcentral.com/ 1753-6561/1?issue=S1.
References
1. Breiman L, Friedman J, Olshen R, Stone C: Classification and Regression TreesNew York: Chapman & Hall; 1984.
2. Ruczinski I, Kooperberg C, Leblanc M: Logic regression. J Comput Graph Stat 2003, 12:475-511.
3. Breiman L: Random forests. Mach Learn 2001, 45:5-32.
4. Park M, Hastie T: Penalized Logistic Regression for Detecting Gene Inter-actions. Tech. Rep. 00-25Palo Alto: Department of Statistics, Stanford Uni-versity; 2006.
5. Tibshirani R: Regression shrinkage and selection via the lasso.
J Roy Stat Soc B 1996, 58:267-288.
6. Shi W, Wahba G, Wright S, Lee K, Klein R, Klein B: LASSO-Pattern-search Algorithm with Application to Ophthalmology Data. Tech. Rep. 1131 Madison: Department of Statistics, University of Wisconsin, Madison; 2006. 7. Wahba G, Lin Y, Lee Y, Zhang H: Optimal properties and adap-tive tuning of standard and nonstandard support vector machines. In Nonlinear Estimation and Classification Edited by: Denison D, Hansen M, Holmes C, Mallick B, Yu B. New York: Springer; 2002:125-143.
8. Leng C, Lin Y, Wahba G: A note on the LASSO and related pro-cedures in model selection. Stat Sinica 2006, 16:1273-1284.
Table 4: The raw data of sex and SNP6 15. The denominator is the total number of people and the numerator is the total number of RA patients.
SNP6154 Male Female
0 341/551 = 0.619 1015/1241 = 0.818 1 43/520 = 0.083 97/628 = 0.154 2 1/270 = 0.004 3/290 = 0.010 Table 3: Interactions on all chromosomes
Variable 1 No. variant alleles of Variable 1 Variable 2 No. variant alleles of Variable 2 Coefficient SD p-Value
SNP2_542 1 SNP2_768 1 -0.5061 0.1389 0.0003
SNP1_673 1 SNP15_77 1 -0.8369 0.1693 10-7