LETTER
Crustal deformation model of the
Beppu
−
Shimabara graben area, central Kyushu,
Japan, based on inversion of three-component
GNSS data in 2000–2010
Kazuma Mochizuki and Yuta Mitsui
*Abstract
The 2016 Kumamoto earthquakes, including an Mw-7 right-lateral earthquake on April 15 (UTC), occurred along faults within the Beppu−Shimabara graben in central Kyushu, Japan. Previous studies showed that the graben area was under heterogeneous stress conditions with north–south T-axes and spreading in a north–south direction. Here, we construct a detailed crustal deformation model using three-component Global Navigation Satellite System data in 2000–2010 and considering the distribution of geological fault traces in this area. Our inversion analysis suggests that the strain accumulation rate for the right-lateral seismic slip segment (corresponding to the Futagawa fault), where the largest of the 2016 Kumamoto earthquakes ruptured, was several times smaller than the other segments in the Beppu−Shimabara graben. Furthermore, we observe distinct subsidence along the Beppu−Shimabara graben. Our base model attributes the subsidence to deflation of magma reservoirs beneath volcanoes, but the observed vertical velocities are poorly fit. In order to improve the fitting results for the vertical deformation, we need more sophisticated volcano-deformation model (such as a sill-like deformation source for Mt. Aso) or graben model.
Keywords: The 2016 Kumamoto earthquakes, Kyushu, GNSS, Crustal deformation, Beppu−Shimabara graben, Volcano, Block-fault model, Nucleation
© The Author(s) 2016. This article is distributed under the terms of the Creative Commons Attribution 4.0 International License (http://creativecommons.org/licenses/by/4.0/), which permits unrestricted use, distribution, and reproduction in any medium, provided you give appropriate credit to the original author(s) and the source, provide a link to the Creative Commons license, and indicate if changes were made.
Introduction
The 2016 Kumamoto earthquakes, including an Mw-7 earthquake on April 15 (UTC), struck a central part of the island of Kyushu, southwest Japan. These earthquakes occurred along faults within the Beppu−Shimabara graben area. The graben area includes some volcanoes, notably Mt. Aso with a large caldera whose area is about 400 km2 (Fig. 1). Around the source region of the 2016
events, several M6 class historical earthquakes occurred in 1895, 1894, 1889, 1848, 1723, 1625, 1619 (Utsu 1979; Usami 2013). This area is under heterogeneous stress conditions associated with both right-lateral faults and normal faults (Matsumoto et al. 2015), whose T-axes trend north–south.
Tada (1984, 1985) investigated crustal deformation of the Kyushu region using repeated triangulation sur-veys for 1892–1982 and found that the Beppu− Shima-bara graben, going across the central Kyushu region in an east–west direction, was spreading in a north–south direction about a rate of 15 mm/year. Tada interpreted the Beppu−Shimabara graben as a terminal part of the Okinawa Trough (a back-arc basin) extending southward.
On the basis of horizontal displacement data observed by Global Navigation Satellite System (GNSS) for 1996– 2002, Nishimura and Hashimoto (2006) constructed a block-fault model for southwest Japan including rotation of rigid blocks and elastic strain accumulation on inland faults and subduction zone interfaces. Their model included a block boundary along the Beppu− Shima-bara graben. Loveless and Meade (2010) also made a
Open Access
*Correspondence: [email protected]
block-fault model for Japan, and their result showed that inland faults across the central Kyushu region in the E–W direction opened around 2–9 mm/year in the N–S direc-tion and slipped right-laterally about 6–9 mm/year as boundaries of crustal blocks. Similar block-fault models have been developed (Nishimura and Takada 2015; Taka-hashi and Hashimoto 2015).
The above previous GNSS studies mainly focused on the current tectonics for the whole of or southwest Japan. However, in order to investigate strain accumulation for each fault, a more detailed model reflecting surface fault traces is preferable.
Here, we focus on the strain accumulation states around the Beppu−Shimabara graben area prior to the 2016 Kumamoto earthquakes. We employ verti-cal deformation as well as the horizontal deformation in the graben area. The vertical deformation may reflect characteristics of the graben area, especially around the volcanoes. We present a detailed model for the crus-tal deformation around the central Kyushu region con-sidering the three-dimensional surface motion within a framework of spherical block rotation, elastic strain accumulation on faults, and volcanic deformation, using
three-component (both horizontal and vertical) GNSS data in 2000–2010.
Methods
We use time-series data of the F3 solution (Nakagawa et al. 2009) observed in a GNSS array by Geospatial Infor-mation Authority of Japan, GEONET. We examine posi-tions at 65 staposi-tions from January 2000 to January 2010, located in a range of 129.8°E–132°E and 31.9°N–34°N. We express displacements relative to a fixed station, Maebaru, numbered 0450, at 130.251°E and 33.536°N.
We estimate velocities at all the stations as follows. First, we remove the offsets related to antenna replace-ment. Next, we calculate median values for each month (121 months during the above period). Then we exclude effects of non-stationary deformation due to nearby large events from the median time series, using fault models in previous studies: the 2001 Geiyo earthquake (Geospa-tial Information Authority of Japan 2001), the 2003–2004 Bungo slow slip events (Geospatial Information Author-ity of Japan 2004), and the 2005 Fukuoka earthquake (Nishimura et al. 2006). Finally, we obtain the observed velocities per year (annual velocities) by linear regression of the processed time-series data with standard errors.
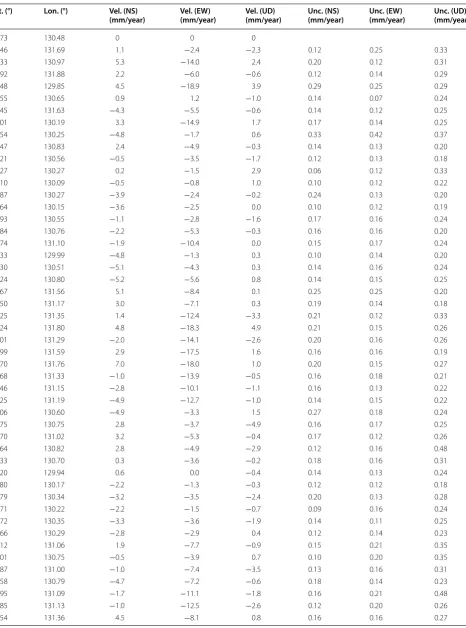
Table 1 compiles the observed annual velocities and their uncertainties (95% confidence intervals), and Fig. 2
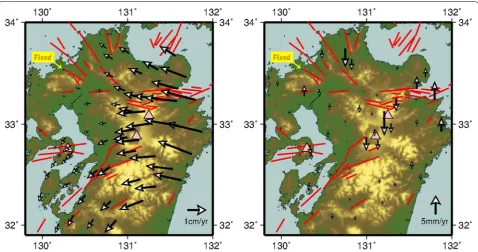
shows the annual velocities during 2000–2010. Since the uncertainties of the linear regression are sufficiently small, at most 0.48 mm/year, we do not illustrate the uncertainties in Fig. 2. The horizontal velocities repre-sent the effects of westward subduction of the oceanic Philippine plate on the east side and the north–south divergence along the Beppu−Shimabara graben. From the vertical velocities, we find subsidence in the graben area of the central Kyushu region, particularly near the volcanoes.
Using the velocity field and the distribution of the geological fault traces (red lines in Figs. 1, 2), we define five blocks ([1]–[5]) and block boundaries (N1–N2, C1– C5, U1, H1) on Kyushu island, as shown in Fig. 3. Each block rotates about its Euler pole, with relative rota-tion between adjacent blocks giving the slip rate on the boundary. Shallow part of several block boundaries (N1, C1–C5) works as sources of elastic strain accumulation (dislocation sources) as “slip deficits” (e.g., Matsu’ura et al. 1986) leading to earthquakes. We set their geom-etries on the basis of recent seismicities and the infor-mation about the fault traces by National Institute of Advanced Industrial Science and Technology (available online at https://gbank.gsj.jp/activefault/index_e_gmap. html). The dip angles of the dislocation sources are also based on the same information. We assume that the upper and lower edges of the dislocation sources
Table 1 Observed annual velocities and their uncertainties by linear regression at 65 GNSS stations
Lat. (°) Lon. (°) Vel. (NS)
(mm/year) Vel. (EW) (mm/year) Vel. (UD) (mm/year) Unc. (NS) (mm/year) Unc. (EW) (mm/year) Unc. (UD) (mm/year)
33.73 130.48 0 0 0
33.46 131.69 1.1 −2.4 −2.3 0.12 0.25 0.33
33.33 130.97 5.3 −14.0 2.4 0.20 0.12 0.31
32.92 131.88 2.2 −6.0 −0.6 0.12 0.14 0.29
33.48 129.85 4.5 −18.9 3.9 0.29 0.25 0.29
32.55 130.65 0.9 1.2 −1.0 0.14 0.07 0.24
32.45 131.63 −4.3 −5.5 −0.6 0.14 0.12 0.25
32.01 130.19 3.3 −14.9 1.7 0.17 0.14 0.25
33.54 130.25 −4.8 −1.7 0.6 0.33 0.42 0.37
33.47 130.83 2.4 −4.9 −0.3 0.14 0.13 0.20
33.21 130.56 −0.5 −3.5 −1.7 0.12 0.13 0.18
33.27 130.27 0.2 −1.5 2.9 0.06 0.12 0.33
33.10 130.09 −0.5 −0.8 1.0 0.10 0.12 0.22
32.87 130.27 −3.9 −2.4 −0.2 0.24 0.13 0.20
32.64 130.15 −3.6 −2.5 0.0 0.10 0.12 0.19
32.93 130.55 −1.1 −2.8 −1.6 0.17 0.16 0.24
32.84 130.76 −2.2 −5.3 −0.3 0.16 0.16 0.20
32.74 131.10 −1.9 −10.4 0.0 0.15 0.17 0.24
32.33 129.99 −4.8 −1.3 0.3 0.10 0.14 0.20
32.30 130.51 −5.1 −4.3 0.3 0.14 0.16 0.24
32.24 130.80 −5.2 −5.6 0.8 0.14 0.15 0.25
33.67 131.56 5.1 −8.4 0.1 0.25 0.25 0.20
33.50 131.17 3.0 −7.1 0.3 0.19 0.14 0.18
33.25 131.35 1.4 −12.4 −3.3 0.21 0.12 0.33
33.24 131.80 4.8 −18.3 4.9 0.21 0.15 0.26
33.01 131.29 −2.0 −14.1 −2.6 0.20 0.16 0.26
32.99 131.59 2.9 −17.5 1.6 0.16 0.16 0.19
32.70 131.76 7.0 −18.0 1.0 0.20 0.15 0.27
32.68 131.33 −1.0 −13.9 −0.5 0.16 0.18 0.21
32.46 131.15 −2.8 −10.1 −1.1 0.16 0.13 0.22
32.25 131.19 −4.9 −12.7 −1.0 0.14 0.15 0.22
32.06 130.60 −4.9 −3.3 1.5 0.27 0.18 0.24
33.75 130.75 2.8 −3.7 −4.9 0.16 0.17 0.25
33.70 131.02 3.2 −5.3 −0.4 0.17 0.12 0.26
33.64 130.82 2.8 −4.9 −2.9 0.12 0.16 0.48
33.33 130.70 0.3 −3.6 −0.2 0.18 0.16 0.31
33.20 129.94 0.6 0.0 −0.4 0.14 0.13 0.24
32.80 130.17 −2.2 −1.3 −0.3 0.12 0.12 0.18
32.79 130.34 −3.2 −3.5 −2.4 0.20 0.13 0.28
32.71 130.22 −2.2 −1.5 −0.7 0.09 0.16 0.24
32.72 130.35 −3.3 −3.6 −1.9 0.14 0.11 0.25
32.66 130.29 −2.8 −2.9 0.4 0.12 0.14 0.23
33.12 131.06 1.9 −7.7 −0.9 0.15 0.21 0.35
33.01 130.75 −0.5 −3.9 0.7 0.10 0.20 0.35
32.87 131.00 −1.0 −7.4 −3.5 0.13 0.16 0.31
32.58 130.79 −4.7 −7.2 −0.6 0.18 0.14 0.23
32.95 131.09 −1.7 −11.1 −1.8 0.16 0.21 0.48
32.85 131.13 −1.0 −12.5 −2.6 0.12 0.20 0.26
are at depths of 1 and 13.5 km, respectively. The loca-tions of the block boundaries without the strain accu-mulation (N2, U1, H1) are not based on seismological or geological evidences, but on the velocity field (Fig. 2). In addition, N2 and U1 are set as extensions of N1 and C1, respectively. We note that the locations of the block
boundaries without the strain accumulation only decide the block to which each GNSS site belongs to, and thus, their precise locations are not important. Figure 4
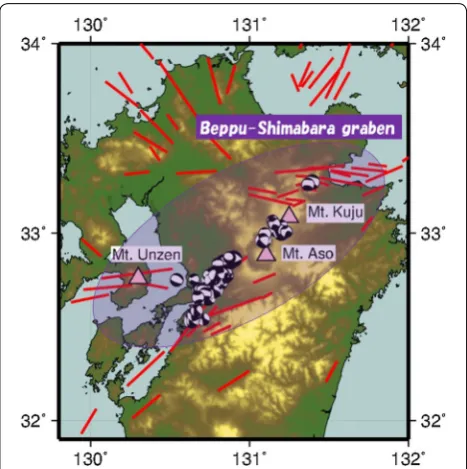
shows a comparison between the block boundaries in this study and the boundaries in Nishimura and Hashi-moto (2006).
Table 1 continued
Lat. (°) Lon. (°) Vel. (NS)
(mm/year) Vel. (EW) (mm/year) Vel. (UD) (mm/year) Unc. (NS) (mm/year) Unc. (EW) (mm/year) Unc. (UD) (mm/year)
33.35 131.59 3.8 −14.1 3.2 0.21 0.16 0.22
33.27 131.12 1.8 −7.7 0.8 0.18 0.13 0.27
33.23 131.58 1.9 −17.2 1.0 0.25 0.16 0.23
33.19 130.92 0.5 −5.2 −2.0 0.16 0.14 0.29
32.56 131.53 1.7 −14.2 2.1 0.16 0.18 0.22
32.38 131.33 −1.2 −11.4 1.1 0.15 0.14 0.30
32.05 130.87 −6.4 −5.9 1.2 0.14 0.12 0.29
33.37 129.95 1.1 0.0 1.4 0.12 0.08 0.22
33.35 130.44 0.9 −2.3 −1.8 0.12 0.19 0.27
32.95 129.99 −0.8 −1.7 0.6 0.10 0.10 0.22
32.58 130.43 −3.5 −4.0 −0.8 0.12 0.17 0.22
32.52 130.09 −3.9 −2.5 0.0 0.10 0.12 0.24
32.43 130.32 −3.0 −3.9 −2.0 0.10 0.14 0.33
33.10 130.46 0.5 −1.1 −0.2 0.08 0.24 0.18
33.13 131.21 −1.3 −15.0 −6.3 0.17 0.13 0.29
32.10 130.36 −6.0 −2.7 0.9 0.12 0.12 0.24
Both velocities and uncertainties include three components (north–south, east–west, and up–down). The first station is the fixed one
Moreover, we assume two types of elastic deformation sources: One is dislocation on the subduction plate inter-face (T1–T2), and the other is a set of volumetric point sources for magma reservoirs beneath the volcanoes (Mt. Kuju, Mt. Aso, Mt. Unzen). Table 2 summarizes the parameters for the above base model.
We construct an observation equation to estimate the block rotation rates, the dislocation rates at the bounda-ries, and the volumetric changes beneath the volcanos as independent parameters:
where the forward operator G is a matrix composed of Green’s functions for a rectangular dislocation in a homogeneous elastic half-space (Okada 1992), rigid rotation to a fixed point (Ward 1990), and volumet-ric point source in a homogeneous elastic half-space (Mogi 1958). The model m is a matrix for the dislo-cation, the rigid rotation (three-component rotation: It allows us to calculate the Euler pole and spherical rotation), and the volumetric source, and the data d
are a matrix for the observed annual velocities from GNSS.
Gm=d
Fig. 3 Configuration of the base model. We define five blocks ([1]–[5]) on Kyushu island. The boundaries of the blocks (N1–N2, C1–C5, U1, H1) are shown by the broken lines. We select a subset of the block boundaries (N1, C1–C5) for dislocation sources. They are represented by the blue broken lines, and the others are by the green broken lines. Since the oceanic Philippine sea plate subducts on the east side of Kyushu island, we set disloca-tion sources for the subducdisloca-tion plate interface as shown by the blue thin lines. Moreover, we assume volumetric point sources for magma reservoirs beneath the volcanoes (Mt. Kuju, Mt. Aso, Mt. Unzen)
Then we estimate a proper solution by an inversion analysis of m = G+d (e.g., Aster et al. 2012) without a
priori information, where G+ is a pseudo-inverse matrix.
We first perform the singular value decomposition of G
as G = UDVt, where D is a diagonal matrix with the
sin-gular values. Figure 5 shows the singular values for the base model in descending order. Then we obtain G+ as G+=VD+Ut, where D+ is a diagonal matrix with inverses
of the truncated singular values. The truncation is done for the singular values smaller than 0.001 (Fig. 5). The number of the nonzero values in D+ is 31, equal to the
number of the independent parameters.
Results and discussion
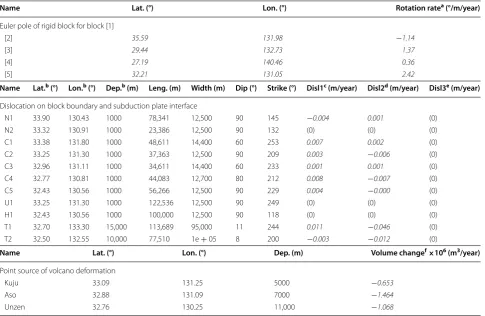
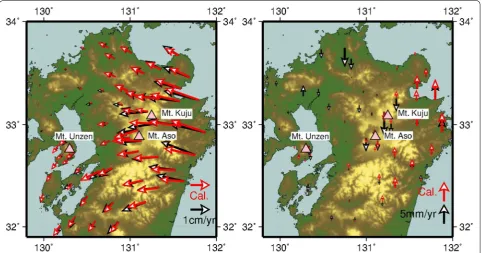
Table 2 compiles the inversion results of the deformation sources for the base model, and Fig. 6 shows comparison of calculated and observed annual velocities.
The observed horizontal velocities (the left figure of Fig. 6) are well modeled by the base model, although the observed vertical velocities (the right figure of Fig. 6) are poorly fit. The mean residual velocity magnitude for the horizontal components is 1.59 mm/year, and that for three components is 2.24 mm/year.
Interpretation of the inversion results
In order to clarify the relation between the rigid block rotation and the elastic strain accumulation on the block boundaries, we first check horizontal directions of sta-ble relative velocities on the boundaries due to the rigid block rotation. We confirm that the boundaries of C1–C5 were subject to stable right-lateral slip and the bounda-ries of N1 were subject to stable left-lateral slip. In con-trast, as shown in Table 2, the elastic strain accumulation (dislocation source) on the boundaries of C1–C5 are
Table 2 Assumed and estimated (italic type) parameters for the base model
a Positive value means counterclockwise rotation
b Location at a northern corner of an upper edge of a rectangular fault c Positive value means left-lateral strike slip
d Positive value means reverse dip slip e Tensile component is fixed to be zero
f Positive value means inflation of magma reservoir
Name Lat. (°) Lon. (°) Rotation ratea (°/m/year)
Euler pole of rigid block for block [1]
[2] 35.59 131.98 −1.14
[3] 29.44 132.73 1.37
[4] 27.19 140.46 0.36
[5] 32.21 131.05 2.42
Name Lat.b (°) Lon.b (°) Dep.b (m) Leng. (m) Width (m) Dip (°) Strike (°) Disl1c (m/year) Disl2d (m/year) Disl3e (m/year)
Dislocation on block boundary and subduction plate interface
N1 33.90 130.43 1000 78,341 12,500 90 145 −0.004 0.001 (0)
N2 33.32 130.91 1000 23,386 12,500 90 132 (0) (0) (0)
C1 33.38 131.80 1000 48,611 14,400 60 253 0.007 0.002 (0)
C2 33.25 131.30 1000 37,363 12,500 90 209 0.003 −0.006 (0)
C3 32.96 131.11 1000 34,611 14,400 60 233 0.001 0.001 (0)
C4 32.77 130.81 1000 44,083 12,700 80 212 0.008 −0.007 (0)
C5 32.43 130.56 1000 56,266 12,500 90 229 0.004 −0.000 (0)
U1 33.25 131.30 1000 122,536 12,500 90 249 (0) (0) (0)
H1 32.43 130.56 1000 100,000 12,500 90 118 (0) (0) (0)
T1 32.70 133.30 15,000 113,689 95,000 11 244 0.011 −0.046 (0)
T2 32.50 132.55 10,000 77,510 1e + 05 8 200 −0.003 −0.012 (0)
Name Lat. (°) Lon. (°) Dep. (m) Volume changef
×106 (m3/year)
Point source of volcano deformation
Kuju 33.09 131.25 5000 −0.653
Aso 32.88 131.09 7000 −1.464
represented by left-lateral slip and that of N1 is by right-lateral slip. This reversal of the sign of the slip direction at each boundary corresponds to the concept of “slip defi-cit” for seismic crustal deformation (e.g., Matsu’ura et al.
1986).
From the inversion results, we interpret: (1) strain accu-mulation along the Beppu−Shimabara graben, especially across block boundaries C1–C2, and C4–C5 at subcen-timeters per year as left-lateral slip deficits, consistent with right-lateral seismic slips, but the strain accumulation rate at C3 was several times smaller. (2) The block boundary N1 shows right-lateral slip deficit, consistent with left-lateral seismic slip. (3) Strain did not accumulate on the subduc-tion plate boundary of T2 at a high rate during the obser-vation period compared with T1. (4) All of the magma reservoirs beneath the volcanoes were under deflation.
The first result is consistent with the right-lateral com-ponent of the 2016 Kumamoto earthquakes. Moreover, the most interesting point is that the strain accumula-tion rate (slip-deficit rate) across the block boundary of C3 corresponding to the Futagawa fault, where the larg-est M7 class earthquake ruptured (Yagi et al. 2016), was smaller than the other segments. One interpretation for this small slip-deficit rate is that the Futagawa fault had very slowly slipped (in the opposite strike direction to the slip deficit; the same strike direction to the seismic slip) during the observation period 2000–2010. Although we are not able to examine temporal slip evolution from the last earthquake on the fault, probably over several thou-sand years, the slow slipping on the fault might play a role in an early phase of nucleation prior to earthquake, which has been shown by numerical experiment studies (e.g., Mitsui and Hirahara 2011).
Fig. 5 Singular values of the forward operator for the base model in descending order. The horizontal broken line represents the value of 0.001 as a criterion of the truncation to construct the pseudo-inverse matrix
The second result suggests that the block boundary N1 (corresponding to the Nishiyama fault) would slip left-laterally as occurred during the 2005 Fukuoka earthquake (Nishimura et al. 2006).
The third result corresponds to the occurrence of a slow slip event in Hyuga-nada region during the obser-vation period and the afterslip of the 1996 Hyuga-nada earthquakes (Yarai and Ozawa 2013) on or to the south of T2.
The fourth result implies that the volcanoes are not actively inflating.
Overall, the above inversion results are obviously affected by the model settings. For example, when we change the depths or widths of the dislocation sources on the block boundaries (Table 2), the values of the esti-mated dislocation rates should vary. We assumed that all of the upper and lower edges of the dislocation sources on the block boundaries are at depths of 1 and 13.5 km, respectively, but the assumption was not based on strong evidences. The results shown in Table 2 are the estimates from the inversion, but uncertainty in block boundary locations and geometric properties of the dislocation sources would alter these estimated model parameters. Therefore, we stated that the estimated values of our inversion results in Table 2 were not exactly correct, but they represent a likely distribution of the parameters.
Alternative model of vertical deformation
A shortcoming of our base model is the poor reproduc-tion for the vertical velocities. In particular, the observed distinct subsidence in the central Kyushu region along the Beppu−Shimabara graben (Fig. 2) is not predicted by our model.
One possible solution for better fitting is improvement of the volcano-related deformation. As an example, we try adding a sill-like deformation source beneath Mt. Aso, proposed by a receiver function study (Abe et al.
2010), to the base model. In this “Aso” model, we set a horizontal rectangular dislocation at a depth of 16 km with 4.8 km length and 4.4 km width (the northeastern corner is located at 131.07°E and 32.923°N) referring to the result of Abe et al. (2010).
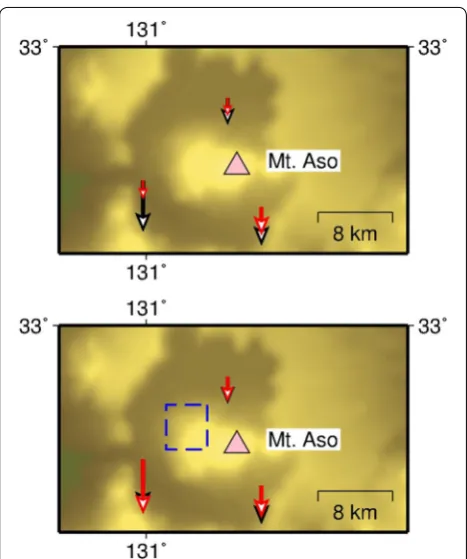
Figure 7 illustrates the inversion results around Mt. Aso to compare between the base model and the “Aso” model. We confirm that the “Aso” model better fits the observed subsidence around Mt. Aso. The estimated parameters in the “Aso” model for the block boundaries et al. were almost similar to those in the base model (Table 2). In terms of Akaike information criterion (Akaike 1974), the “Aso” model with the value of −1907.080 is better than the base model with the value of −1903.485. This improvement is due to the better fitting for the subsid-ence around Mt. Aso as shown in Fig. 7.
The “Aso” model is an example of improved models for the volcano-related deformation. The subsidence around Mt. Kuju might be better modeled by a similar way, although we have not tried it since the information about the magma system beneath Mt. Kuju is presently not sufficient. We infer that the distinct subsidence along the Beppu−Shimabara graben can be interpreted as vol-cano-related deformation not limited to the deflation of the magma reservoirs.
Another possible solution for better fitting the graben subsidence is implementation of tensile components for the dislocations on the block boundaries. One may consider that divergent movement as found in the gra-ben area is opposite to tectonic collisional movement which can be modeled as a vertical tensile dislocation (Shimazaki and Zhao 2000). Thus, we tested permit-ting the tensile components for the block boundaries of C1–C5. However, the inversion results turned out to be worse than the base model in terms of Akaike informa-tion criterion. Tentatively, we have not constructed a proper model implementing the tensile components of dislocations.
Conclusion
We performed the three-dimensional inversion to esti-mate the elastic sources beneath the central Kyushu region, on the basis of three-component (both horizontal and vertical) GNSS data in 2000–2010. The most remark-able result was that the strain accumulation rate for the right-lateral seismic slip for C3 (corresponding to the Futagawa fault), where the largest earthquake in the 2016 Kumamoto earthquakes ruptured, was smaller than the other segments along the Beppu−Shimabara graben. In
order to improve the fitting for the vertical deformation, we need more sophisticated volcano-deformation model or graben model.
Authors’ contributions
KM constructed the models and performed the inversion. YM verified and discussed the results and wrote the paper. Both authors read and approved the final manuscript.
Acknowledgements
We thank two anonymous reviewers and an editor (Takuya Nishimura), for their constructive comments. We use generic mapping tools (Wessel et al. 2013) to draw the maps. Authors acknowledge support from the Japan Society for the Promotion of Science (JSPS) KAKENHI Grant 16K17791 and 16H06477.
Competing interests
The authors declare that they have no competing interests.
Received: 26 July 2016 Accepted: 18 October 2016
References
Abe Y, Ohkura T, Shibutani T, Hirahara K, Kato M (2010) Crustal structure beneath Aso Caldera, Southwest Japan, as derived from receiver function analysis. J Volcanol Geotherm Res 195:1–12
Akaike H (1974) A new look at the statistical model identification. IEEE Trans Autom Control 19:716–723
Aster RC, Borchers B, Thurber CH (2012) Parameter estimation and inverse problems, 2nd edn. Academic Press, Cambridge
Geospatial Information Authority of Japan (2001) Crustal movements in the Chugoku, Shikoku and Kyushu Districts. Coord Commun Earthq Predict 66:486–512 (in Japanese)
Geospatial Information Authority of Japan (2004) Crustal movements in the Chugoku, Shikoku and Kyushu Districts. Coord Commun Earthq Predict 72:552–574 (in Japanese)
Loveless JP, Meade BJ (2010) Geodetic imaging of plate motions, slip rates, and partitioning of deformation in Japan. J Geophys Res 115:B02410 Matsu’ura M, Jackson DD, Cheng A (1986) Dislocation model for aseismic
crus-tal deformation at Hollister, California. J Geophys Res 91:12661–12674
Matsumoto S, Nakao S, Ohkura T, Miyazaki M, Shimizu H, Abe Y, Inoue H, Nakamoto M, Yoshikawa S, Yamashita Y (2015) Spatial heterogeneities in tectonic stress in Kyushu, Japan and their relation to a major shear zone. Earth Planets Space 67:172
Mitsui Y, Hirahara K (2011) Fault instability on a finite and planar fault related to early phase of nucleation. J Geophys Res 116:B06301
Mogi K (1958) Relations between eruptions of various volcanoes and the deformations of the ground surfaces around them. Bull Earthq Res Inst 36:99–134
Nakagawa H, Toyofuku T, Kotani K, Miyahara B, Iwashita C, Kawamoto S, Hatanaka Y, Munekane H, Ishimoto M, Yutsudo T, Ishikura N, Sugawara Y (2009) Development and validation of GEONET new analysis strategy (Version 4). J Geogr Surv Inst 118:1–8 (in Japanese)
Nishimura S, Hashimoto M (2006) A model with rigid rotations and slip deficits for the GPS-derived velocity field in Southwest Japan. Tectonophysics 421:187–207
Nishimura T, Takada Y (2015) The San-in shear zone in southwest Japan revealed by the GEONET data. Paper presented at AGU Fall Meet., Abstract G13A-1006, The Moscone Center, San Francisco, 14–18 Dec 2015 Nishimura T, Fujiwara S, Murakami M, Suito H, Tobita M, Yarai H (2006) Fault
model of the 2005 Fukuoka-ken Seiho-oki earthquake estimated from coseismic deformation observed by GPS and InSAR. Earth Planets Space 58:51–56
Okada Y (1992) Internal deformation due to shear and tensile faults in a half-space. Bull Seismol Soc Am 82(2):1018–1040
Shimazaki K, Zhao Y (2000) Dislocation model for strain accumulation in a plate collision zone. Earth Planets Space 52:1091–1094
Tada T (1984) Spreading of the Okinawa trough and its relation to the crustal deformation in Kyushu. J Seismol Soc Jpn 37:407–415 (in Japanese with English abstract)
Tada T (1985) Spreading of the Okinawa trough and its relation to the crustal deformation in the Kyushu (2). J Seismol Soc Jpn 38:1–12 (in Japanese with English abstract)
Takahashi A, Hashimoto M (2015) Cluster analysis of velocity field derived from dense GNSS network of Japan. Paper presented at AGU Fall Meet., Abstract G13A-0995, The Moscone Center, San Francisco, 14–18 Dec 2015 Usami T (2013) Materials for comprehensive list of destructive earthquakes in
Japan, 599–2012. University of Tokyo Press, Tokyo (in Japanese)
Utsu T (1979) Seismicity of Japan from 1885 through 1925: a new catalog of earthquakes of M = 6 felt in Japan and smaller earthquakes which caused damage in Japan. Bull Earthq Res Inst 54:253–308 (in Japanese with English abstract)
Ward SN (1990) Pacific-North America plate motions: new results from very long baseline interferometry. J Geophys Res 95:21965–21981 Wessel P, Smith WHF, Scharroo R, Luis J, Wobbe F (2013) Generic mapping
tools: improved version released. EOS Trans AGU 94:409–410
Yagi Y, Okuwaki R, Enescu B, Kasahara A, Miyakawa A, Otsubo M (2016) Rupture process of the 2016 Kumamoto earthquake in relation to the thermal structure around Aso volcano. Earth Planets Space 68:118
![Fig. 3 Configuration of the base model. We define five blocks ([1]–[5]) on Kyushu island](https://thumb-us.123doks.com/thumbv2/123dok_us/892401.1107393/5.595.57.291.450.682/fig-configuration-base-model-define-blocks-kyushu-island.webp)