Strain and Dispersion Dependence of High Frequency
Electromagnetic Properties of Carbon
Nanotube/Epoxy Nanocomposites
Gaurav Pandey*
Abstract—An experimental setup and data reduction method has been developed for noninvasive high frequency electromagnetic impedance measurements of carbon nanotube (CNT)/epoxy nanocomposites. Using time domain reflectometry and parallel plate transmission lines, dielectric properties can be measured with the specimen under tensile loading. Good dispersion and addition of CNTs lead to an increase in high frequency dielectric constant of the nanocomposites. A strong strain dependence of the impedance is observed for the well dispersed nanocomposite while the baseline epoxy showed no strain dependence. A mechanism, based on an increase in CNT-CNT tunneling capacitance with applied tensile strain has been suggested. This research is expected to introduce a noninvasive characterization technique for studying electromagnetic properties of conductive nanocomposites.
1. INTRODUCTION
The aim of this research is to experimentally study the effect of carbon nanotube (CNT) dispersion on high frequency electromagnetic properties of CNT based nanocomposites. The effect of CNT networks on the coupling between strain and high frequency electromagnetic properties are also evaluated. A non-invasive experimental method for monitoring electromagnetic properties of materials with or without tensile loading has been developed. The non-invasive electromagnetic monitoring technique is based on time domain reflectometry (TDR) and includes a waveform based inverse modeling algorithm to decouple sensor characteristics from specimen properties. The research is expected to establish TDR as a material characterization technique for studying conductive nanomaterial properties under mechanical loading. For the first time, in-situ measurements of strain dependent high frequency electromagnetic properties using TDR has been achieved.
Recent studies have revealed that CNT based polymer nanocomposites have excellent electromagnetic shielding properties [1–3]. It is well established that the electrical conductivity of CNT based nanocomposites depends not only on the weight fraction of the CNTs in the polymer but also on the dispersion [1, 2, 4–7]. Even though the classical electromagnetic theories predict the electromagnetic shielding properties of materials to be merely a function of electrical conductivity and dielectric constant, previous research by Arjmand and co-workers [3] has shown that for polymer nanocomposites, mechanisms such as electromagnetic wave scattering by individual nanotubes offer a much wider range of electromagnetic shielding at the same electrical conductivity. Hence, even though the DC electrical conductivity of CNT based nanocomposites has been well understood by the scientific community through either percolation [8] or tunneling models [9], the electromagnetic properties still need to be studied. A similar lack of understanding of nanoscale electromagnetics has been discussed in a review by Ruthergren and Burke [10]. The present research has used electric time domain reflectrometry
Received 20 January 2016, Accepted 20 April 2016, Scheduled 3 May 2016
* Corresponding author: Gaurav Pandey (gpandey@udel.edu).
(TDR) to characterize electromagnetic properties of CNT based polymer nanocomposites with different states of CNT dispersion so as to provide further experimental information towards better understanding of electromagnetic behavior at the nanoscale.
TDR technique has been widely used since to detect faults in printed circuit boards and cables [11], geo measurements [12], soil moisture content [12], concrete faults [13, 14], liquid flow [15] and delamination crack monitoring [16]. The present research is motivated by the lack of in-situ
electromagnetic characterization data of nanocomposites, especially those based on CNTs. TDR is a low cost and robust method to evaluate broad band dielectric response can be used as the method to study dielectric properties. A parallel plate transmission line TDR test setup has been developed which enables non-invasive (contactless) measurement of electromagnetic properties during unstrained and strained loading conditions. In our earlier research [17], similar parallel plate TDR sensors have been used for non-invasive strain monitoring and damage sensing in CNT introduced fiber composites. Carbon nanotubes have been known to have coupled mechanical and electrical/electromagnetic properties [18–21]. Polymer nanocomposites exhibit a significant piezoresistive behavior, i.e., the variation of DC electrical resistance with strain [22–27]. The coupling between mechanical and electromagnetic properties can be studied non-invasively with the parallel plate setup fabricated in the present work,
2. ELECTROMAGNETIC PROPERTIES: REFLECTOMETRY VERSUS TRANSMISSION MEASUREMENTS
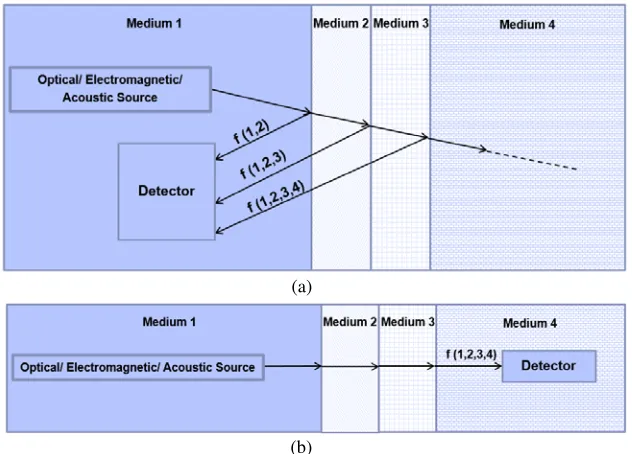
As far as guided wave measurements are concerned, there are two methods to measure system/specimen properties: reflectometry or transmission measurements. Both these techniques consist of a waveform generator, which can be electromagnetic, acoustic or optical and a waveform recorder. The difference is that in reflectometry type measurements, both the waveform generator and the sampler are using the same contact points while in case of transmission measurements, the waveform generator and the sampler are on the opposite sides. Both the measurement techniques are illustrated in Figure 1.
The transmitted waveform response is a function of the properties of all the mediums through which the waveform propagates. In through-transmission mode uniform bulk properties can be calculated in reflectometry measurements properties of individual section can be measured. In this research, electrical TDR has been chosen as the method to probe the nanocomposite specimen during tensile loading as several discontinuities are inherently involved in the design of a probe/test-cell to perform in-situ
(a)
(b)
measurements. Section 4 explains a forward solver TDR inversion algorithm which can back calculate the electromagnetic properties of many successive mediums if the characteristics of the first medium are known. In TDR measurements, the first medium is usually a coaxial or SMA Cable of 50 Ohms impedance and hence based on this value, all other impedances can be back calculated.
3. TDR EXPERIMENTAL SETUP
Figure 2 shows the equivalent electric circuit diagram of a typical TDR setup. The setup consists of a waveform generator which generates a step voltage pulse and an oscilloscope which records the reflection. A TDR ‘module’ has both the waveform generator and oscilloscope as a single unit. The step voltage pulse travels along the transmission line (a pair of conductors connected to the TDR module) and based on the oscilloscope/detector output, the dielectric properties of the transmission line can be calculated. The dielectric properties of the transmission line depend on the material surrounding the transmission line. The localized electromagnetic properties of the specimen and transmission line are defined by the characteristic impedance, Z. Electrical properties of the specimen and Transmission Line system are defined by “Characteristic impedance” (Z) given by Equation (1):
Z =
R+jωL
G+jωC (1)
R,G,Land C are the distributed resistance, conductance, impedance and capacitance, respectively. A typical output of TDR is shown in Figure 3. Themth observation point has an impedance discontinuity and so the TDR output voltage at the TDR time corresponding to that observation point is given by Equation (2). The relationship between TDR time scale and spatial scales is given by Equation (3).
Figure 2. Basics of TDR measurement.
EL,m = Ei
2ZL,m
Zmodule+ZL,m
(2)
Δx = Δt 2√LC =
Δt
2√μ (3)
It is possible to measure the impedance of a specimen by observing the TDR voltage-time data. The transmission lines can be either coaxial, parallel plate, microstrip etc. Coaxial transmission lines have been used to measure dielectric properties of liquids [28, 29] . Parallel plate transmission lines have been used to measure the soil moisture content [30]. In our earlier research, parallel plate transmission lines have been used for damage sensing of CNT modified polymer composites [17]. We have used the parallel plate transmission lines for our present experiments due to 1) simplicity of interpreting the results and 2) the ability to perform in-situ impedance measurements while the specimen is strained. The experimental setup is shown in Figure 5.
Figure 3. Ideal TDR waveform for a uniform transmission line with an impedance discontinuity at
mth location and an open circuit at the end of the transmission line.
Figure 4. Test cell for measuring impedance of nanocomposites.
lines and the specimen provides good insulation withG= 0 S. Equation (1) simplifies to:
Z =
L
C (4)
Further, for a parallel plate transmission line filled with uniform dielectric, the impedance can be related to material dielectric properties and specimen geometry as [31]:
Z = δ
w
μ
ε (5)
For a transmission line consisting of both an air-gap and a dielectric specimen and assuming that the specimen is non-magnetic, the impedance is given Equation (6).
Z = δ
w μ
0
εeffective
(6)
εeffective = ε0 C
C0
where εeffective is the effective dielectric constant given by Equation (7), C is the capacitance of the parallel plate transmission line with the dielectric inserted in andC0is the capacitance with air/vacuum in between the parallel plates.
εeffective =ε0 δ
δ−δSpecimen
1− ε1 r
(8)
Thus, dielectric properties of the specimen can be measured using a TDR based parallel plate test cells. Further, Fellner-Feldag [28] has shown that the initial TDR trace (before the open circuit reflection) corresponds to high frequency dielectric properties of the specimen.
4. TDR INVERSION ALGORITHM
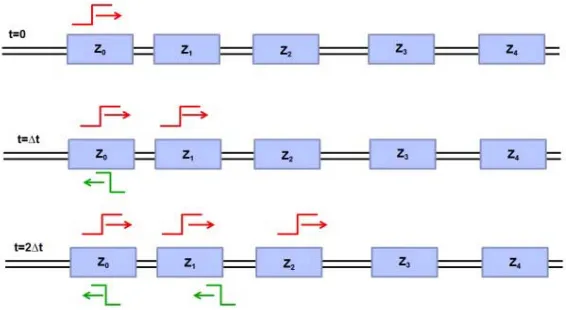
Equation (1) can be applied to calculate the impedance of that discontinuity if the transmission line has only one discontinuity. In case of multiple discontinuities, multiple reflections and transmissions of the input pulse take place. Hence the voltage output of the TDR module must be processed to compute the impedance profile of the transmission line. Figure 5 illustrates the phenomenon of multiple reflections due to multiple impedance discontinuities. The transmission line is assumed to be made of a number of impedance discontinuities (Z0, Z1, Z2, Z3 and so on). At any impedance discontinuity between two impedances Zi and Zi+1, a forward travelling wave results in transmitted and reflected pulses. The transmitted voltage pulse is given by Equation (9) and the reflected voltage pulse is given by Equation (10). Forward travelling voltage pulses are shown at the top of the impedances and the backward travelling pulses are shown at the bottom of the impedances. Both forward and backward travelling pulses result in transmissions and reflections.
Figure 5. Reflections and transmissions on a non-uniform transmission line after two time steps.
Vtransmitted = V0
2Zi+1
Zi+1+Zi
(9)
Vref lected = V0
Zi+1−Zi
Zi+1+Zi
(10)
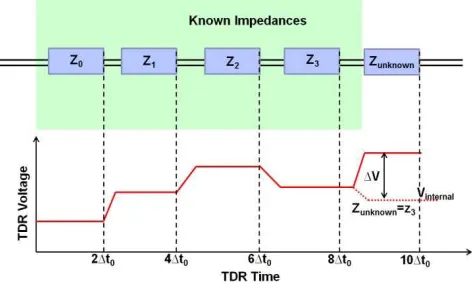
assuming some impedance distribution to be known a-priori. Hsue and Pan [34] have reported a forward solver. A layered peeling algorithm has been used in [35]. In the present work, a forward solver similar to the work of [34] has been developed. Figure 6 shows the basic concept of the present TDR inversion technique which is waveform based. Let’s assume that all but one impedance in the TDR network are known. It is further assumed that all the impedances have equal travel times. ΔV is the difference between the real TDR output at t= 10Δt0 and the output assuming that the unknown impedance is equal to the known impedance immediately preceding it. Vinternal is the internal TDR response of the known impedances and can be calculated using one dimensional transmission line modeling method [34].
Vf orward(Zk,2(k+ 1)Δt0) is the forward travelling voltage pulse at the end of the known TDR network at timet= 2(k+ 1)Δt0. Based on the voltage difference ΔV, the unknown impedance can be calculated using Equation (11). It’s assumed that the impedances till thekth impedance are known. In an actual TDR experiment, since a coaxial cable of known impedance (usually 50 Ohms) is used, the impedance response of the entire TDR network can be reconstructed.
ΔV
Vf orward(Zk,2 (k+ 1) Δt0)
= Zunknown−Zk
Zunknown+Zk
k i=1
2Zi−1
Zi−1+Zi
(11)
Z(x) = Z0e x
LlnZLZ0 (12)
A transmission line modeling (TLM) based algorithm [36] has been used to calculate the response of the transmission line with known impedances. The TLM based algorithm tracks all the individual waveform reflections and transmissions at each time step (Δt0) using Equations (9) and (10) for both forward and backward travelling waves. The one dimensional TLM based algorithm has been compared to the algorithm used by Hsue and Pan [34] (Figure 7) for an exponential transmission line. An exponential [36] transmission line is a transmission line with impedances varying exponentially according to Equation (12). Figure 8 shows the results of reconstruction for the exponential transmission lines for two particular cases. Hence it is possible to invert the TDR signal using a forward solver based on combination of TLM method and Equation (11). The inversion is exact and real time implementation is possible. The TDR inversion algorithm can be used to decouple the connector and soldering variations at the TDR connector.
Figure 6. Determination of unknown impedance immediately after a known impedance network.
5. MATERIAL, SPECIMEN PREPARATION AND INSTRUMENTATION
Figure 7. Comparison of waveform based TLM algorithm and Hsue and Pan’s algorithm [34] to simulate the TDR output of known impedance network for an exponential transmission line.
Figure 8. Reconstruction of non-uniform transmission line given by Equation (12) using waveform based TDR inversion technique.
HL-8200 TDR module (Hyperlabs Inc.) recorded the TDR response of the specimen. An incident voltage step of 250 mV with a rise time of 200 ps (maximum frequency of 5 GHz) has been applied. Tensile loading was applied using INSTRON 5565 load frame. Strain was measured using standard strain gages mounted on the specimen. A LabViewTM based data acquisition system combined the TDR, strain and load measurements.
6. RESULTS AND DISCUSSIONS
The TDR voltage data (Figure 9(a)) is converted to impedance data using the inverse modeling technique described in Section 4 and Figure 9(b) shows the TDR waveforms in terms of impedance for the unstressed specimen for the neat, poor and well dispersed resins. A 50 Ω coaxial cable was used and hence the initial impedance measured by the TDR is 50 Ω. Epoxy nanocomposites with well dispersed CNTs are observed to have the highest travel time (ΔtWD). The travel time of poorly dispersed specimen (ΔtWD) is intermediate and the travel time of neat epoxy specimen (ΔtN) is the lowest. Hence, from
Equation (3), this indicates that the high frequency dielectric constant (k∞) is the highest for the well dispersed MWCNT/epoxy nanocomposite and the least for neat epoxy specimen. This increase in high frequency dielectric constant is further confirmed by the decrease in impedance level (Equation (6)).
Combining Equation (3) and Equation (4) and assuming that nanotubes do not change the magnetic permeability of the resin, the following relationship can be derived between the impedance and time of flight for any given sensor system:
Z∝ 1
ΔT (13)
(a) (b)
Figure 9. Raw (a) and converted (b) TDR waveforms of unstrained specimen.
Figure 10. Impedance vs inverse of time period.
nanocomposites. The study however, was performed only for two cases: stretched and un-stretched. However, the present study reports in-situ measurements of the dielectric properties for a wide range of strains using a simple experimental setup.
Figure 12 compares the strain-TDR response for the poorly dispersed and well dispersed MWCNT/epoxy nanocomposite system. The impedance of well dispersed MWCNT/epoxy nanocomposite has a higher sensitivity to strain as compared to poorly dispersed MWCNT/epoxy composite. It has been proved in previous research by Lee et al. that the dielectric constant of any solid material depends on the applied strain [39, 40]. This phenomenon is known as dielectrostriction. The present research presents the dielectrostriction properties of CNT based nanocomposites for the first time. This could have future application in designing reconfigurable antennae and radomes which operate over a range of frequencies. The impedance response is mainly due to the change in dielectric constant of the nanocomposite with strain and not merely due to the dimensional changes. The fact that the neat epoxy specimen does not show any variation with strain indicates that the contribution of geometrical changes with strain is negligible.
(a) (b)
(c)
Figure 11. Strain response of specimen: (a) neat epoxy, (b) poorly dispersed MWCNT/epoxy, (c) well dispersed MWCNT/epoxy.
Figure 12. Comparison of strain dependent TDR response for both well dispersed and poorly dispersed specimen.
research was meant specifically for investigating the qualitative effect of dispersion and strain on high frequency impedance of the specimen. But with an appropriate modification of the transmission line, low frequency properties can be measured as well.
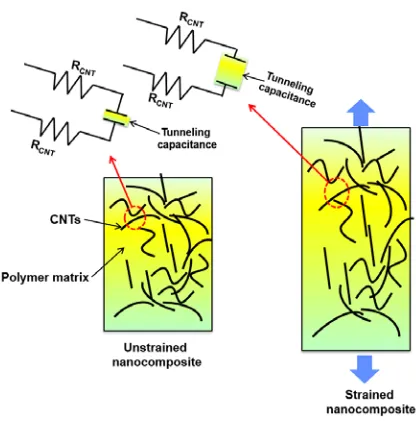
Figure 13. A possible mechanism for strain dependence of impedance.
However the cause for enhancement of dielectric properties of CNT based nanocomposites is not yet well proposed. If the dielectric measurements are contact measurements, there must be leakage current between the electrodes (since CNT based nanocomposites are conductive). However non-contact measurements eliminate the leakage current and the observed impedance is strictly due to reorienting of dipoles in the polymer. It is of fundamental scientific interest as to how CNTs impart bulk polarity to the host polymer.
A probable mechanism for the observed strain-TDR response is depicted in Figure 13. The applied tensile strain results in an average increase of the tunneling distance between the CNT networks in the nanocomposite. Hence the effective CNT capacitance decreases with applied strain. CNT-CNT capacitance contributes towards the dielectric constant of the nanocomposite. Hence a decreased capacitance would result in decrease of effective dielectric constant of the nanocomposite. This decrease in effective dielectric constant results in an increase in impedance of the nanocomposite with strain, as observed experimentally. Further, since a well dispersed nanocomposite has more CNT-CNT capacitance contributions as compared to a poorly dispersed nanocomposite, the strain dependence of the impedance is more pronounced in the well dispersed nanocomposite as compared to poorly dispersed nanocomposite.
7. CONCLUSIONS
ACKNOWLEDGMENT
Contribution of Dr. Erik Thostenson and Dr. Dirk Heider, University of Delaware is acknowledged in funding and supervising the research work during the author’s stay as graduate student.
REFERENCES
1. Mathur, R. B., S. Pande, B. P. Singh, and T. L. Dhami, “Electrical and mechanical properties of multiwalled carbon nanotubes reinforced PMMA and PS composites,” Polymer Composites, Vol. 29, No. 7, 717–727, 2008.
2. Kim, H. M., K. Kim, C. Y. Lee, J. Joo, S. J. Cho, H. S. Yoon, D. A. Pejakovic, J. W. Yoo, and A. J. Epstein, “Electrical conductivity and electromagnetic interference shielding of multiwalled carbon nanotube composites containing fe catalyst,” Appl. Phys. Lett., Vol. 84, No. 4, 589–591, 2004.
3. Arjmand, M., M. Mahmoodi, G. A. Gelves, S. Park, and U. Sundararaj, “Electrical and electromagnetic interference shielding properties of flow-induced oriented carbon nanotubes in polycarbonate,”Carbon, Vol. 49, No. 11, 3430–3440, September 2011.
4. Thostenson, E. T. and T. Chou, “Processing-structure-multi-functional property relationship in carbon nanotube/epoxy composites RID B-8587-2008,” Carbon, Vol. 44, No. 13, 3022–3029, November 2006.
5. Mierczynska, A., M. Mayne-L’Hermite, G. Boiteux, and J. K. Jeszka, “Electrical and mechanical properties of carbon nanotube/ultrahigh-molecular-weight polyethylene composites prepared by a filler prelocalization method,”J. Appl. Polym. Sci., Vol. 105, No. 1, 158–168, July 5, 2007.
6. Ayatollahi, M. R., S. Shadlou, M. M. Shokrieh, and M. Chitsazzadeh, “Effect of multi-walled carbon nanotube aspect ratio on mechanical and electrical properties of epoxy-based nanocomposites,”
Polym. Test., Vol. 30, No. 5, 548–556, August 2011.
7. Lee, S. H., M. W. Kim, S. H. Kim, and J. R. Youn, “Rheological and electrical properties of polypropylene/MWCNT composites prepared with MWCNT masterbatch chips,” European Polymer Journal, Vol. 44, No. 6, 1620–1630, June 2008.
8. Bauhofer, W. and J. Z. Kovacs, “A review and analysis of electrical percolation in carbon nanotube polymer composites,” Composites Sci. Technol., Vol. 69, No. 10, 1486–1498, 2009.
9. Li, C., E. T. Thostenson, and T. Chou, “Dominant role of tunneling resistance in the electrical conductivity of carbon nanotube-based composites RID C-8998-2011 RID B-8587-2008,” Appl. Phys. Lett., Vol. 91, No. 22, 223114, November 26, 2007.
10. Rutherglen, C. and P. Burke, “Nanoelectromagnetics: Circuit and electromagnetic properties of carbon nanotubes,” Small, Vol. 5, No. 8, 884–906, 2009.
11. Smolyansky, D. and S. Corey, “PCB interconnect characterization from TDR measurements,”
Electronic Engineering, Vol. 71, No. 870, 63, July 1999.
12. O’Connor, K. M. and C. M. Dowding, Geomeasurements by Pulsing TDR Cables and Probes, 402, CRC Press, Boca Raton, 1999.
13. Lin, M. and J. Thaduri,Structural Damage Detection Using an Embedded ETDR Distributed Strain Sensor, 315, Springer, New York, 2005.
14. Chen, G., H. Mu, D. Pommerenke, and J. L. Drewniak, “Damage detection of reinforced concrete beams with novel distributed Crack/Strain sensors,” Structural Health Monitoring, Vol. 3, No. 3, 225–243, September 1, 2004.
15. Dominauskas, A., D. Heider, and J. W., Gillespie, Jr., “Electric time-domain reflectometry distributed flow sensor,”Composites Part A: Applied Science and Manufacturing, Vol. 38, No. 1, 138, 2007.
17. Pandey, G., M. Wolters, E T. Thostenson, and D. Heider, “Localized functionally modified glass fibers with carbon nanotube networks for crack sensing in composites using time domain reflectometry,” Carbon, Vol. 50, No. 10, 3816–3825, 2012.
18. Ahir, S. and E. Terentjev, “Photomechanical actuation in polymer-nanotube composites,” Nature Materials, Vol. 4, No. 6, 491–495, June 2005.
19. Ahir, S., A. Squires, A. Tajbakhsh, and E. Terentjev, “Infrared actuation in aligned polymer-nanotube composites RID B-7623-2011,” Physical Review B, Vol. 73, No. 8, 085420, February 2006.
20. Koerner, H., G. Price, N. Pearce, M. Alexander, and R. Vaia, “Remotely actuated polymer nanocomposites-stress-recovery of carbon-nanotube-filled thermoplastic elastomers,”
Nature Materials, Vol. 3, No. 2, 115–120, February 2004.
21. Rochefort, A., P. Avouris, F. Lesage, and D. Salahub, “Electrical and mechanical properties of distorted carbon nanotubes RID A-5124-2010,” Physical Review B, Vol. 60, No. 19, 13824–19330, November 15, 1999.
22. Kenneth, J. L., J. Kim, J. P. Lynch, N. Wong, S. Kam, and A. K. Nicholas, “Multifunctional layer-by-layer carbon nanotube-polyelectrolyte thin films for strain and corrosion sensing,”Smart Mater. Struct., Vol. 16, No. 2, 429, 2007.
23. Park, M., H. Kim, and J. P. Youngblood, “Strain-dependent electrical resistance of multi-walled carbon nanotube/polymer composite films,” Nanotechnology, Vol. 19, No. 5, 055705, 2008.
24. Pham, G. T., Y. Park, Z. Liang, C. Zhang, and B. Wang, “Processing and modeling of conductive thermoplastic/carbon nanotube films for strain sensing,”Composites Part B: Engineering, Vol. 39, No. 1, 209–216, 2008.
25. Anandand, S. V. and D. R. Mahapatra, “Quasi-static and dynamic strain sensing using carbon nanotube/epoxy nanocomposite thin films,” Smart Mater. Struct., Vol. 18, No. 4, 045013, 2009. 26. Hu, N., Y. Karube, M. Arai, T. Watanabe, C. Yan, Y. Li, Y. Liu, and H. Fukunaga, “Investigation
on sensitivity of a polymer/carbon nanotube composite strain sensor,” Carbon, Vol. 48, No. 3, 680–687, 2010.
27. Srivastava, R. K., V. S. M. Vemuru, Y. Zeng, R. Vajtai, S. Nagarajaiah, P. M. Ajayan, and A. Srivastava, “The strain sensing and thermal-mechanical behavior of flexible multi-walled carbon nanotube/polystyrene composite films,”Carbon, Vol. 49, No. 12, 3928–3936, October 2011. 28. Fellner-Feldegg, H., “Measurement of dielectrics in the time domain,” J. Phys. Chem., Vol. 73,
No. 3, 616–623, 1969.
29. Castiglione, P. and P. J. Shouse, “The effect of ohmic cable losses on time-domain reflectometry measurements of electrical conductivity,” Soil Science Society of America Journal, Vol. 67, No. 2, March 2003.
30. Robinson, D. A. and S. P. Friedman, Parallel Plates Compared with Conventional Rods as TDR Waveguides for Sensing Soil Moisture, 497, Springer, Netherlands, 2000.
31. Faria, J. A. B., Electromagnetic Foundations of Electrical Engineering, 399, Wiley, Chichester, U.K., 2008.
32. Schlaeger, S., “A fast TDR-inversion technique for the reconstruction of spatial soil moisture content,” Hydrol. Earth Syst. Sci., Vol. 9, No. 5, 481–492, 2005.
33. Platt, I. G. and I. M. Woodhead, “A 1D inversion for non-invasive time domain reflectometry,”
Meas. Sci. Technol., Vol. 19, No. 5, 055708, May 2008.
34. Hsue, C.-W. and T.-W. Pan, “Reconstruction of nonuniform transmission lines from timedomain reflectometry,” IEEE Transactions on Microwave Theory and Techniques, Vol. 45, No. 1, 32–38, 1997.
35. B¨anninger, D., H. Wunderli, M. Nussberger, and H. Fl¨uhler, “Inversion of TDR signals revisited,”
Journal of Plant Nutrition and Soil Science, Vol. 171, No. 2, 137–145, 2008.
37. Thostenson, E. T., S. Ziaee, and T. Chou, “Processing and electrical properties of carbon nanotube/vinyl ester nanocomposites,” Composites Sci. Technol., Vol. 69, No. 6, 801–804, May 2009.
38. Dang, Z., S. Yao, and H. Xu, “Effect of tensile strain on morphology and dielectric property in nanotube/polymer nanocomposites,” Applied Physics Letters, Vol. 90, No. 1, 012907, 012907-3, 2007.
39. Lee, H. Y. and Y. M. Shkel, “Dielectric response of solids for contactless detection of stresses and strains,” Sensors and Actuators A: Physical, Vol. 137, No. 2, 287, 2007.
40. Lee, H. Y., Y. Peng, and Y. M. Shkel, “Strain-dielectric response of dielectrics as foundation for electrostriction stresses,” American Institute of Physics, 2005.
41. Lan, C., P. Srisungsitthisunti, P. B. Amama, T. S. Fisher, X. Xu, and R. G. Reifenberger, “Measurement of metal/carbon nanotube contact resistance by adjusting contact length using laser ablation,”Nanotechnology, Vol. 19, No. 12, 125703, 2008.


![Figure 7. Comparison of waveform based TLMalgorithm and Hsue and Pan’s algorithm [34] tosimulate the TDR output of known impedancenetwork for an exponential transmission line.](https://thumb-us.123doks.com/thumbv2/123dok_us/1884029.1245678/7.612.350.520.79.251/comparison-waveform-tlmalgorithm-algorithm-tosimulate-impedancenetwork-exponential-transmission.webp)