EFFECTS OF CLIMATE VARIABILITY ON MAIZE YIELD IN NAKURU COUNTY, KENYA
KOIMBORI JACKSON KINYANJUI (B.ed. Sc)
REG NO: I56/NKU/CE/25594/2014
A Thesis Submitted in Partial Fulfilment of the Requirements for the Award of the Degree of Master of Science (Climatology) in the School of Pure
and Applied Sciences of Kenyatta University
DECLARATION
This thesis is my original work and has not been presented for a degree or any other award in any other university.
Koimbori Jackson Kinyanjui (B.ed. Sc)
Signature………Date………
We confirm that the work reported in this thesis was carried out by the candidate under our supervision.
Prof. Chris A. Shisanya, Phd Signature……… Date………
Department of Geography Kenyatta University
Dr. Shadrack. K. Murimi, Phd Signature………. Date………
DEDICATION
I dedicate this thesis to my parents Alice Nyambura and David Koimbori, my
siblings Washington Kanyari, John Njogu and Redempter Wanjiru, my loving wife
Perpetual Njoki and my two daughters Bianca Nyambura and Valencia Nyaruwai.
ACKNOWLEDGEMENTS
I would like to thank God for He has been able to guide me through my thesis
journey. I wish to acknowledge Kenyatta University for according me the chance to
pursue my studies and for the department of Geography supporting my studies. My
heart felt gratitude goes to my two supervisors at Kenyatta University-Kenya,
Professor Chris A. Shisanya and Dr. Shadrack K. Murimi for their endless push and
strive for perfection that has made me to follow suit. I personally would not have
wished for a better team of supervisors than the duo, who have guided me through
constructive criticism. I would also like to thank my Lecturers at Uppsala
Universitet-Sweden in the department of Earth sciences especially Professor Richard
Petterson who helped me understand the aspect of Geographic Information System
(GIS) and Dr. Christian Zdanowicz who helped me understand data analysis
methods. I would also like to acknowledge the assistance and support accorded to me
by the MOA, Tegemeo Institute, Nakuru County Agricultural Officers, Kenya
Meteorological Department and the respondents who helped me to fill the
questionnaires. I wish to also acknowledge my mother Alice Nyambura, my father
David Koimbori, my sister Redempter Wanjiru, my brothers Washington Koimbori
and John Njogu. Finally, I wish to thank my lovely wife Perpetual Njoki and my two
daughters Bianca Nyambura and Valencia Nyaruwai for they have been the source of
my strength and motivation. My final word to all is that everything is possible as
TABLE OF CONTENTS
DECLARATION ... ii
DEDICATION ... iii
ACKNOWLEDGEMENTS ... iv
LIST OF FIGURES ... ix
LIST OF TABLES ... x
LIST OF ABBREVIATIONS AND ACRONYMS ... xi
ABSTRACT ... xii
CHAPTER ONE ... 1
INTRODUCTION ... 1
1.1 Background to the Study ... 1
1.2 Statement of the Problem ... 3
1.3 Justification of the Study ... 4
1.4 Research Questions ... 4
1.5 Research Objectives ... 4
1.5.1. General Objective ... 4
1.5.2. Specific Objectives ... 4
1.6 Research Hypotheses ... 5
1.7 Significance of the Study ... 5
1.8 Scope and Limitations of the Study ... 6
1.9 Operational Definitions of Key Terms and Concepts ... 7
CHAPTER TWO ... 8
LITERATURE REVIEW ... 8
2.1 Introduction ... 8
2.2 Climate Variability ... 8
2.3 Climate Variability Effects on Agricultural Production ... 9
2.5 Conceptual Framework ... 13
CHAPTER THREE ... 14
RESEARCH METHODOLOGY ... 14
3.1 Introduction ... 14
3.2 Study Area ... 14
3.3 Research Design ... 17
3.4 Target Population ... 17
3.5 Sampling Frame and Sampling Procedures ... 19
3.5.1 Household Survey Sampling ... 19
3.5.2 Institutional Sampling ... 19
3.6 Data Collection ... 20
3.6.1 Primary Data ... 20
3.6.2 Secondary Data ... 21
3.7 Data Analysis Procedures ... 22
3.8 Validity and Reliability ... 23
3.9 Data Management and Ethical Considerations ... 23
CHAPTER FOUR ... 25
RESULTS AND DISCUSSION ... 25
4.1 Introduction ... 25
4.2 Rainfall Trends in Bahati Sub-County (1985 to 2015) ... 25
4.2.1 Annual Rainfall Trends ... 25
4.2.2 Seasonal Rainfall Trends ... 26
4.3 Rainfall Variability ... 27
4.3.1 Annual Rainfall Variations from the Mean ... 27
4.4 Seasonal Rainfall Onset and Cessation ... 30
4.4.1 Analysis of Seasonal Rainfall Onset and Cessation ... 30
4.5.1 Annual Average Temperature Trend ... 31
4.5.2 Annual Average Maximum Temperature Trend ... 32
4.5.3 Annual Average Minimum Temperature Trend ... 33
4.6 Temperature Variability ... 34
4.6.1 Annual Average Temperature Variations from the Mean ... 34
4.7 Trend of Maize Yields ... 36
4.7.1 Annual Maize Yield Trend in Tonnes ... 36
4.8 Maize Yield Variability ... 37
4.8.1 Annual Maize Yield Variability in Tonnes ... 37
4.9 Correlation Analysis ... 38
4.9.1 Correlations of Climatic Variables and Maize Yield Data ... 38
4.9.2 Correlation Between Annual Rainfall and Maize Yield Data ... 39
4.9.3 Correlation Between Maximum Annual Temperature and Maize Yield Data . 40 4.9.4 Correlation Between Minimum Annual Temperature and Maize Yield Data .. 41
4.10 Influence of Climate Variability on Annual Maize yields ... 43
4.11 Rainfall Variability According to Maize Farmers ... 44
4.11.1 Temperature Variability According to Maize Farmers ... 45
4.11.2 Analysis of Maize Farmers Adaptation Measures ... 45
4.12 SWOT Analysis ... 47
4.12.1 Analysis of Strength and Weaknesses ... 48
4.12.2 Analysis of Opportunities and Threats ... 51
CHAPTER FIVE ... 53
SUMMARY OF FINDINGS, CONCLUSIONS AND RECOMMENDATIONS ... 53
5.1 Summary of the Findings ... 53
5.2 Conclusions ... 56
5.4 Recommendations for Further Research ... 58
REFERENCES ... 59
APPENDICES ... 63
APPENDIX I: RAINFALL DATA COLLECTION CHECK SHEET ... 63
APPENDIX II: TEMPERATURE DATA COLLECTION CHECK SHEET ... 64
APPENDIX III: ANNUAL MAIZE YIELD ... 66
APPENDIX IV: QUESTIONNAIRE ... 67
APPENDIX V: KEY RESPONDENTS INTERVIEW QUESTIONS ... 70
LIST OF FIGURES
Figure 2.1: Conceptual Framework……….……….….….13
Figure 3.1: Map of Bahati Sub-County ……….16
Figure 4.1: Annual Rainfall Trend ………26
Figure 4.2: Seasonal Rainfall Trend ……….….27
Figure 4.3: Annual Rainfall Variations ……….……….…………...28
Figure 4.4: Seasonal Rainfall Variations ………...29
Figure 4.5: Annual Average Temperature Trend …….……….32
Figure 4.6: Annual Average Maximum Temperature ………...33
Figure 4.7: Annual Average Minimum Temperature ……….……….….….34
Figure 4.8: Annual Average Temperature Variations ………...…...….35
Figure 4.9: Annual Average (Maximum and Minimum) Temperature Variations....36
Figure 4.10: Annual Maize Yield Trend ……….….….37
Figure 4.11: Annual Maize Variations ……….….…38
Figure 4.12: Combined Line and Bar Graph Showing Annual Rainfall Trend and Annual Maize Yield Trend……….….39
Figure 4.13: Combined Line and Bar Graph Showing Maximum Annual Temperature Trend and Annual Maize Yield Trend ……….40
Figure 4.14: Combined Line and Bar Graph Showing Minimum Annual Temperature Trend and Annual Maize Yield Trend……...………...41
Figure 4.15: Farmers Opinion Poll ………44
Figure 4.16: Adaptation Measures Adopted by Farmers ……….…….…….46
Figure 4.17: Land Holding Distribution ……….………….….….50
LIST OF TABLES
Table 1.1: Nakuru County Maize Production (90 kg bag) from 2012 to 2014………4
Table 2.1: Adaptation Strategies………...………...12
Table 3.1: Bahati Sub-County Population Description ………...…...18
Table 3.2: Weather Stations in Bahati Sub-County………….………...…...……….20
Table 3.3: Data Collection Instruments ……….21
Table 3.4: Summary of Data Analysis ………...23
Table 4.1: Summary of Seasonal Rainfall ……….………31
Table 4.2: Summary of Recorded Rainfall and Temperature Data …………...36
Table 4.3: Annual Rainfall, Temperature and Maize Yield Data ………...…...42
Table 4.4: Correlations between the Climatic Variables and Maize Yield ………...43
Table 4.5: Farmers Adaptation Measures ……….……….46
Table 4.6: SWOT Matrix………47
Table 4.7: Farmers Background Information ……….49
LIST OF ABBREVIATIONS AND ACRONYMS ASALs: Arid and Semi-Arid Lands
FAO: Food and Agriculture Organization
FD: Forest Department
GDP: Gross Domestic Product
GHGs: Greenhouse Gases
GOK: Government of Kenya
IFRCRCS: InternationalFederation of Red Cross and Red Crescent Societies
IPCC: Intergovernmental Panel on Climate Change
KALRO: Kenya Agricultural and Livestock Research Organization KES: Kenya Shillings
KFS: Kenya Forest Service
KMD: Kenya Meteorological Department
KNBS: Kenya National Bureau of Statistics
MAM: March - April - May
MOA: Ministry of Agriculture
MOE: Ministry of Environment
NCCAP: National Climate Change Action Plan
NCCRS: National Climate Change Response Strategy
NEMA: National Environmental Management Authority
OND: October- November- December
SPSS: Statistical Package for Social Sciences
SWOT: Strengths, Weaknesses, Opportunities and Threats Analysis
UNFCCC: United Nations Framework Convention on Climate Change
ABSTRACT
CHAPTER ONE
INTRODUCTION
1.1 Background to the Study Scientists have been tasked with coming up with global response to this global
challenge termed as climate change by various climate change bodies. The global
surface temperatures in the last three decades and past century have warmed up by
0.6°C and0.8°Crespectively (Hansen et al., 2006). In 1992 the international political response to climate change (IPRCC) began with the ratification of the united nation
framework convention on climate change (UNFCCC). Stabilizing the greenhouse
gases concentration in the atmosphere at a threshold that would avert severe
anthropogenic interference with the present climatic systems in our world was the
main purpose of the convention (IPCC, 2001). This led to the signing of the Kyoto
protocol of 1997 committing countries towards taking up climate action. According
to the National Climate Change Action Plan (NCCAP) 2013 report, climate change
can be monitored through measurement of the climatic elements such as wind,
pressure, temperature and rainfall among others.
Climate change research studies have predicted an increase of precipitation and
temperature throughout the year with an annual average of 4.2mm and +2.8°C per
month respectively over tropical Africa. Africa is predicted to have greater impacts
in relation to climate variability and change because of weak adaptive capacities to
climate variability and change, as evidenced by the impacts of current weather
extremes e.g. floods and droughts (FAO, 2007). Africa is particularly more
the total active population in Africa rely on agriculture as their primary source of
livelihood (ILO, 2007). According to the World Bank (2003) report, 39% of people
in ASALs live in Africa. As a consequence of unresolved climate variability issues at
local levels, Africa risks tilting towards becoming a global food crisis focal point
(Bunce et al., 2010).
In Kenya data from National Climate Change Response Strategy (NCCRS) in 2010
indicated that the country’s day and night temperatures have increased by as much as
2.1°C and 2.9°C respectively in western parts of Kenya in the last twenty years.
Meanwhile in central Kenya, which includes Nairobi the night and day temperatures
have risen by 2.0°C and 0.7°C respectively. In the Southern-Eastern Region, which
includes Kenya’s food basket, the Rift Valley Region temperatures have risen by
1°C. In Nairobi both maximum and minimum temperatures have shown an
increasing trend for the period 1966 to 1999 (Makokha and Shisanya, 2010).
Increased rainfall and temperature variability are likely to introduce additional
vulnerabilities in ASALs and this would eventually lead to a pronounced impact on
drought as a result of water availability (NCCAP, 2013). This is because only 20% of
the territorial surface area in Kenya is classified as highly potential area receiving
high amounts of rainfall to support agricultural productivity. The largest part of the
country comprising of approximately 83% of the total territorial area is ASALs with
minimal annual rainfall ranging from 200mm to 850mm (Shisanya et al., 2011). However, over 80% of the total population occurs within the potential areas while
only 20% of the population occurs in the vast ASALs (MAFAP, 2013). Agriculture
in Kenya dominates the economy in terms of contribution to income generation,
employment creation, food security and raw material for industries (GOK, 2005a).
KES 37 billion, while development partners have committed KES 194 billion
between 2005 and 2015 to programs they have earmarked as having a major impact
on climate change components (NCCAP, 2013).
In recent times La Nina drought periods in Kenya have occurred in the years
1991/1992, 1995/1996, 1998/2000, 2004/2005, and 2008/2011, that led to severe
crop losses, famine and population displacement in the country (IPCC, 2007). While
the El Niño related high rainfall periods in Kenya have occurred in the years
1997/1998, 2002/2003, 2006/2007 and 2009/2010 (NCCAP, 2013). Increased
temperatures and rainfall variability are likely to introduce additional vulnerabilities
in ASALs and may in the future have a significant impact on drought as result of
water availability (NCCAP, 2013). La Nina droughts of 1999/2000 is an example of
a drought event that left 4.7 million Kenyans approximately facing starvation.
Bahati sub-county has over the last few year’s experienced drastic climatic
variability and change in terms of distribution in rainfall and temperature (GOK,
2015). The farmers have also been recording low maize production levels and as
such this research study sought to analyze the effects of climate variability on maize
yield in Bahati Sub-County, Nakuru County with the aim of helping the farmers to
improve on their maize yield levels and existing climate variability adaptation
strategies.
1.2 Statement of the Problem
It was predicted by IPCC (2007) that Maize yields will decline by 5% by 2050 in
Sub-Saharan Africa. The farmers of Bahati Sub-County, Nakuru County have been
counting loses as maize yield levels have been declining according to the Kenya
Economic Review of Agriculture Report of 2015 and many attribute this failure
partly due to climate variability among other factors (GOK, 2015). The proposed
yield in Bahati Sub-County, Nakuru County with the aim of helping the farmers to
improve on existing climate variability adaptation strategies.
1.3 Justification of the Study
Maize yield levels in Bahati Sub-County have been declining in the past few years
(Table 1.1) according to the Kenya economic review of agriculture report of 2015
and yet farmers have been employing adaptation strategies. This prompted the
researcher to examine the effects of climate variability on maize yield levels.
Table 1.1: Nakuru County Maize Production (90 kg bag) from 2012 to 2014 Nakuru County yearly maize production 2012 2013 2014 Total Maize production (90kg bag) 3,358,879 2,599,838 1,785,353
Source; (GOK, 2015)
1.4 Research Questions
i) What evidence exists to suggest that there is climate variability in Bahati
Sub-County, Kenya for the period 1985 to 2015?
ii) How has climate variability influenced farmer’s maize yield levels in Bahati
Sub-County, Kenya for the period 1985 to 2015?
iii) Which climate variability adaptation strategies are being practised at farm level in
Bahati Sub-County?
1.5 Research Objectives 1.5.1. General Objective
To analyse the effects of climate variability on maize yield among farm holders in
Bahati Sub-County, Nakuru County, Kenya for the period 1985 to 2015.
1.5.2. Specific Objectives
i) To establish climate variability trends in Bahati Sub-County, Kenya for the period
ii) To analyze the effects of climate variability on maize yield among farm holders in
Bahati Sub-County, Kenya for the period 1985 to 2015.
iii) To identify and evaluate the existing climate variability adaptation strategies
practised by farmers in Bahati Sub-County, Kenya.
1.6 Research Hypotheses
The study was guided by the following hypotheses:
H1: Unusual and unsystematic climatic occurrences have led to significant
variability in rainfall and temperature trends in Bahati Sub-County, Kenya.
H2: Variability in rainfall and temperature does not significantly affect maize yield
in Bahati Sub-County, Kenya.
H3: Adaptation measures implemented by farmers in Bahati Sub-County, Kenya
have significantly reduced maize farmers vulnerability to climate variability.
1.7 Significance of the Study
Bahati Sub-County, Nakuru County is among the bread baskets of Kenya forming an
important pillar towards ensuring maize yield levels are maintained at optimum. The
effect of climate variability is being felt by the small farm holders of Bahati
Sub-County in Nakuru Sub-County and according to the Kenya Economic Review of
Agriculture Report of 2015 the level of maize yields has decreased over the last few
years in Bahati Sub-County, Nakuru County (Table 1.1). The research study through
its findings and recommendations will avail useful information to the farmers,
researchers, policy makers, and stakeholders. To the farmers, the study will provide
useful information regarding climate variability impacts on maize yields and by
extension this will help them to evaluate their adaptation strategies towards climate
variability if any. To the policy makers and stake holders like Ministry of Agriculture
(MOA), Kenya Agricultural and Livestock Research Organization (KALRO),
(MOE), the research findings will help them towards policy formulations that focus
on climate variability.
1.8 Scope and Limitations of the Study
The research was purposively carried out in Bahati Sub-County as it is part of a
known food basket that feeds the larger Nakuru County and the focus was on
smallholder farmers in Bahati Sub-County and the effects of climate variability on
maize yield. It also focused on two climatic elements namely; rainfall and
temperature. The findings however were generalized to other areas of the country
that have similar climatic characteristics.
Preliminary surveys indicated the following limitations were accosted with;
i) The study focused on maize crop excluding other food crops grown in the
area since Bahati Sub-County is predominantly a maize producing area.
ii) The study focused on only two climatic elements namely; rainfall and
temperature while excluding the others, since these elements fall under the
four main requirements for plant growth to occur which include; water,
warmth, light and air. Secondly due to data limitations, the study focused on
1.9 Operational Definitions of Key Terms and Concepts
Adaptation strategies: This is adjustment to ecological, social or economic system in response to observed or expected changes in climatic stimuli and their effects and
impact.
Climate Variability: Variations in the statistical distribution of weather patterns on a temporal and spatial scale. In this study climate variability has been operationalized
to mean rainfall and temperature variability.
Climate Change: Is any change in climate over time that is attributed directly or indirectly to human activity that alters the composition of the global atmosphere in addition to natural climate variability observed over comparable time periods.
Food Security: when all people, at all times, have physical and economic access to sufficient, safe and nutritious food to meet their dietary needs and food preferences
for an active and healthy life.
Maize Yield: It refers to the measure of maize grains produced from a unit of land expressed as kilograms per hectare.
CHAPTER TWO
LITERATURE REVIEW
2.1 Introduction
This chapter entails an over view of the previous studies related to climate variability
and highlighting the knowledge gaps the proposed research study intends to fill. The
sub-sections highlight on climate variability, its effects and adaptation strategies
adopted by farmers in regions similar to the study area. A conceptual frame work is
also used in showing the interrelationships between independent, dependent and
intervening variables of the study.
2.2 Climate Variability
In recent years, various climate change and adaptation related research studies have
stressed out on the frequency and magnitude of climate extremes due to climate
variability (FAO, 2009). This research will contribute towards filling the knowledge
gap that exists on the effects of climate variability on maize yield with the aim of
ensuring Bahati Sub-County is food secure.
The IPCC report of 2007 projected an increase in the global surface temperatures
towards the end of the 21st Century of between 1.1°C and 6.4°C. The increase in the
global surface temperatures is expected to cause a change in the climate-related
parameters such as sea level, soil moisture and precipitation. It is projected that there
will be variations in the intensity, predictability and frequency of precipitation
(IPCC, 2007). A change in precipitation ultimately affects soil moisture and
consequently vegetation. As a result of Africa’s warming of 0.7°C within the 20th
century period, various general circulation models have projected warming across
experience a rainfall increase of 5% to 20% from December to February and a
decrease in rainfall of 10% to 5% from June to August by 2050 (Hulme et al., 2001).
According to the IPCC (2007) report, it suggested that with today’s changing climate
the result would be an increase in climate variability. Although extreme climatic
events have been changing continuously over the years, an increased concern has
been put forth about the increase in the degree of climate variability and extreme
weather events because of anthropogenic factors (Malla, 2008). Rural households in
Africa have been adapting to climate variability stress factors like droughts, which
have been in existence for decades (Mertz et al., 2011). The most volatile climatic regions and communities are those highly exposed to the effects of climate
variability and least able to adapt to these impacts (Luers and Moser, 2006). IPCC
has made numerous documentations on global temperature and rainfall trends,
however the know-how on climatic changes and extreme events in climate is sparse
when it comes to Africa (Herrero et al., 2010). Hence, this study assessed and gave a regional data on variability of rainfall and temperature for the period 1985 to 2015,
with a focus on Bahati Sub-County, Kenya. The 30 years span of climatic data was a
representative of the most recent average climate in the study region and sufficient
duration to encompass a range of significant weather anomalies that have occurred in
Bahati Sub-County, Nakuru County.
2.3 Climate Variability Effects on Agricultural Production
East African region is highly vulnerable to climate variability effects such a shift in
the growing season due to a high dependency by farmers on rain-fed agriculture and
this has led to a decline in agricultural production (IPCC, 2007). Any variation in
climatic variables negatively affects stability and supply in agricultural production
by climate variability such as; low level of technology, limited funds to combat
effects of climate variability and a high dependence on rain-fed agriculture (Nath and
Behera, 2011).
Various studies carried out in different altitude areas in the world revealed that
temperature rise as an outcome of global warming may lead to increased crop yields
in mountainous regions (Weart, 2010). Studies carried out in high-altitude regions
such as northeast China and the UK revealed that rise in temperature has benefited
agricultural production (Gregory et al., 2008). This means that climate variability could eventually be of benefit for mountainous agriculture as long as the limiting
factor is not moisture.
It was predicted by IPCC (2007) that crop yields will decline by 14%, 22%, and 5%
respectively for rice, wheat and maize by 2050 in Sub-Saharan Africa. This has been
greatly attributed to the dependence of the already poor farmers on rainfed
agriculture and their numbers is set to increase by 2050. Vulnerability is further
elevated by unavailability and un-affordability of agricultural inputs, landlessness,
unemployment and water shortage.
In January 2014 the government of Kenya estimated 1.6 million people were affected
as a result of an impending drought that resulted in low amounts of rainfall between
March and May 2014 in ASALs. In areas across most of eastern Africa from 1996 to
2003 there was a decline in the amount of rainfall ranging from 50mm to 150mm per
season that resulted in the low production of long cycle crops like maize and
sorghum (Funk et al., 2005). The El Niño events in Kenya of 1997/1998 produced high amounts of rainfall that resulted in flooding and decreased agricultural yields.
The increase in food prices continued to worsen the already hard situation
A Programme was launched by IFRCRCS to assist the 650,000 people affected
between 29th August 2014 and by 24th September 2014 out of which the Programme
was only 1% funded (IFRCRCS, 2014). The short rains of December 2014 were way
below average and this led to most parts of the country to experience food insecurity.
As a result, over the next several months the food insecure population was expected
to increase to limits above 1.5 million people (Africa, Security and Update, 2014).
Since growth of maize crops is highly dependent on favorable climate and most of
the farmers in Bahati Sub-County depend on rain fed agriculture, the present study
sought to analyse the effects of climate variability on maize yield in Bahati
Sub-County, Nakuru County.
2.4 Climate Variability Adaptation Strategies
The driving factor towards climate variability adaptation strategies in Kenya has
been the concern over food security; this is according to National Environment
Management Authority (NEMA). Since Kenya has suffered badly due to climate
variability impacts in previous years, proactive measures have to be taken to make
Kenya more prepared for future drought phenomenon. The Kenyan National Climate
Change Response Strategy (NCCRS) recognizes that Kenyan farmers are more
vulnerable to climate variability impacts due to lack of high adaptive capacities to
climate variability and their high dependence on rain fed agriculture (GOK, 2010).
Various adaptation strategies to food crop agriculture have been identified by
Table 2.1: Adaptation Strategies
Adaptation Strategies Description
1. Water conservation
technologies. Water conservation technologies such as drip irrigation, construct water harvesting technologies such as water pans to trap storm water, recycling of waste water while reducing water wastage through leakages of burst pipes and unsustainable uses such as current car washing techniques which uses clean water from taps as opposed to recycled water.
2. Altering planting dates. By early or late planting, sowing and harvesting helps to reduce pest crop attacks.
3. Organic farming. Avoid using chemical pesticides and opt to using organic
nutrient sources.
4. Water harvesting. This helps reduce surface runoff that would lead to soil
erosion and have water for use in drought situations.
5. Management of pests. This entails the using of all methods to control and kill pests
that would otherwise reduce crop productivity.
6. Insurance of crops. Risks due to climate change to crops should be met with
compensation and incentives from the government to farmers.
7. Intercropping. This is the growing of various crops or mixed cropping to
increase food productivity levels.
8. Conservation agriculture. This ensures the soil does not lose moisture or nutrients through use of crop rotation, mulching etc.
9. Growing climate tolerant crop
species. This entails the growing of crop species that are resistant to climate variability and extremes. 10. Agro- based weather advisory. This helps farmers to forecast weather and to plan for
planting, sowing and harvesting. 11. Afforestation and
re-afforestation. Planting of tress where deforestation has taken place and planting in areas where trees were not planted.
Source: (Aggarwal and Singh, 2012)
Adaptation strategies to improve the crop yields aim at ensuring that agriculture
contributes to countering the effects of climate variability and this research
ultimately evaluated the adaptation strategies practised by farmers of Bahati
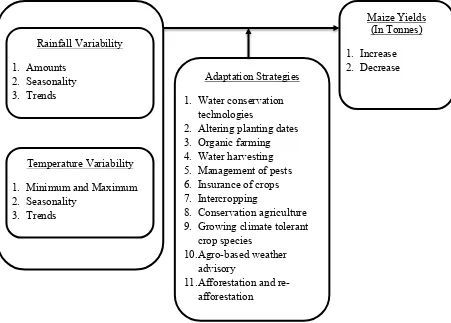
2.5 Conceptual Framework
Independent Variables Intervening Variables Dependent Variables
Figure 2.1: A Conceptual Framework of the Effects of Climate Variability on Maize Yield Levels
Source: Adapted and modified from (Kipronoh, 2013)
The intervening variables were adaptation strategies towards climate variability. This
came into play into reducing the effects of the climate variability on maize yields.
Adaptation strategies ranged from the following intervention measures; water
conservation technologies, conservation agriculture, planting trees, altering planting
dates, water harvesting, growing resistant and climate tolerant crop varieties. The
dependent variable is maize yields in Tonnes, analysed from records obtained from
MOA, Tegemeo Institute and Nakuru County Agricultural Offices.
Rainfall Variability
1. Amounts 2. Seasonality 3. Trends
Temperature Variability
1. Minimum and Maximum 2. Seasonality
3. Trends
Adaptation Strategies
1. Water conservation technologies
2. Altering planting dates 3. Organic farming 4. Water harvesting 5. Management of pests 6. Insurance of crops 7. Intercropping
8. Conservation agriculture 9. Growing climate tolerant
crop species
10.Agro-based weather advisory
11.Afforestation and re-afforestation
Maize Yields (In Tonnes)
CHAPTER THREE
RESEARCH METHODOLOGY
3.1 Introduction
This chapter begins with an overview description of Bahati Sub-County, including
the geographic, climatic data, social and economic characteristics of the study area.
This chapter has further discussed the research designs that were employed, target
population, procedure of selecting sampling units, data collection methods that were
used during the study and statistical data analysis tools.
3.2 Study Area
The study area was Bahati Sub-County which is located within Nakuru County
(Figure 3.1). It is made up of 5 wards of which 4 wards were studied; Dundori,
Kabatini, Kiamaina and Bahati, since Lanet/Umoja is not an agricultural area. The
greater Nakuru County is in Rift Valley Region and occupies an area of 7,242.3km2.
It is located between longitudes 35°28' and 35° east and Latitude 0°13' and 10°10'
South at an altitude of about 1912 meters above sea level. Bahati Sub-County has a
population of 141,352 covering an area of 375.40km# (KNBS, 2009).
Nakuru County has predictable weather patterns with temperatures ranging between
10°C during the cold months (July and August) and 20°C during the hot months
(January to March). Bahati Sub-County receives between 700mm and 1200mm of
rainfall annually, with average annual rainfall being an approximated 960mm.
Nakuru County which covers Bahati Sub-County has two rainy seasons; March,
April, May (MAM) representing the long rain season and October, November,
December (OND) representing the short rain season. The soils are complex due to
influence by variations in relief, climate and underlying rock types. The major soils
Agriculture, urban self-employment, wage employment, rural self-employment and
other sectors contribute 48%, 23%, 19%, 8% and 2% respectively of the total Nakuru
county’s income. Average farm size ranges from 2.5 acre (small scale) to 1,100 acres
(large scale). The majority of large commercial farms are found around Bahati
Sub-County. Maize, beans, Irish potatoes and wheat are some of the main food crops
produced in Bahati Sub-County. Tomatoes, peas, carrots, onions, French beans,
citrus, peaches, cabbages and asparagus are some of the fruits and vegetables
produced in Bahati Sub-County. The total amount of harvested bags under food
crops is 130,000 bags and 23,000 bags under cash crops (GOK, 2015). Bahati
Sub-County has been a subject of concern as it is part of a known food basket that feeds
the larger Nakuru County with fresh farm products particularly milk, cabbages,
3.3 Research Design
A mixed research design which involved the use of triangulation method was
adopted as the research study was quantitatively and qualitatively done. The
advantage of using a mixed research design was that it was useful in understanding
contradictions between quantitative results and qualitative findings. Triangulation
method was used since it involved obtaining data from different sources and this
assisted in cross checking the results which consequently helped to increase validity,
and reliability of the findings. This study obtained data from primary sources which
included; field observation, household questionnaires and government officials'
interviews. Secondary data was obtained from published and unpublished
documents, meteorological data and maize yield data. This method helped to ensure
sufficient data and information was collected to explain the effects of climate
variability on maize yield in Bahati Sub-County, Nakuru County.
3.4 Target Population
The study sample targeted the small-scale farmers of Bahati Sub-County which is
comprised of five wards out of which the research purposively focused on four
agricultural wards which are Dundori, Kabatini, Kiamaina and Bahati, since Lanet is
not an agricultural area (Table 3.1). Stratified random sampling technique was used
to divide the number of households living within the study area into sub-groups
called strata based on location and an independent random sample size was selected
from each stratum proportionate to the size of each stratum. The total house hold
sample size for Bahati Sub-County was calculated based on Yamane’s formula
(Yamane, 1967). A 5% level of precision (e) was used since according to Yamane
(1967) a standard error (e) in the range of 2% to 5% is usually acceptable as this
n =1 + N(e)N #
Where:
n= the household sample size
N= the household population size
e= the level of precision, which is usually 5%
On using Yamane’s (1967) formula of sample size from a household population size
of 28,106, with an error of 5% and with a confidence coefficient of 95%, the sample
size arrived at was 394 households as shown below.
n = 28,106
1 + 28,106 (0.05)#
n =28,10671.265
n = 394.38 approximately, 394
Table 3.1: Dundori, Kabatini, Kiamaina and Bahati Wards Population Description Summary
Assembly
Wards Total Population Male Female Households Sample Formula Household Sample size Dundori 24,023 11,681 12,342 5,743
85,743 28,1069 ∗ 𝐧
81
Kabatini 29,213 14,324 14,889 6,863
86,863 28,1069 ∗ 𝐧
96
Kiamaina 31,309 15,250 16,059 8,343
828,1068,3439 ∗ 𝐧 117
Bahati 29,692 14,617 15,075 7,157
87,157 28,1069 ∗ 𝐧
100
TOTAL 114,237 55,872 58,365 28,106
𝐧 = 28,106
1 + 28,106 (0.05)#
394
3.5 Sampling Frame and Sampling Procedures
3.5.1 Household Survey Sampling
The study area focused on four wards; Dundori, Kabatini, Kiamaina and Bahati. The
total households in the four wards was 28,106 and out of this, stratified random
sampling technique was employed to group the samples into strata. The total
household sample size was calculated using Yamane (1967) formula and
consequently 394 households were included in the sample. The sample size for each
stratum was determined using independent random sampling technique where a
sample was selected from each stratum based on the proportionate size of each
stratum (Table 3.1). The proportionate distribution of these respondents per sampling
site were as follows: Dundori 81, Kabatini 96, Kiamaina 117 and Bahati 100.
3.5.2 Institutional Sampling
Information gathered from the KMD revealed that there were 13 weather stations
found in Bahati Sub-County and out of which Nakuru Meteorological Station was
purposively sampled as the only one found still operating and having all the data
required (Table 3.2). Through purposive sampling senior officers one from MOA,
Tegemeo Institute and KMD were approached to provide relevant data related to the
Table 3.2: Weather Stations in Bahati Sub-County
Source: Kenya Meteorological Department
3.6 Data Collection 3.6.1 Primary Data
Primary data was collected through household surveys. Questionnaires with open and
close-ended questions were administered purposively to a selected number of
respondents per sampling site as follows: Dundori 81, Kabatini 96, Kiamaina 117
and Bahati 100. A list containing names of all the farmers in the four wards was
generated and systematic random sampling technique was used to identify the
specific respondents per ward. This method is unbiased, providing a random chance
to any of the respondents to answer the questionnaires. The questionnaires helped
provide information on the effects of climate variability on maize yield and the
adaptation strategies practised by the farmers in Bahati Sub-County.
No Station
ID Station Name Longitude Latitude Year Opened Operations
1. 9036001 Late Forest Burn 36.13 -0.16 1921 Closed
2. 9036032 Bahati Forest 36.18 -0.16 1930 Closed
3. 9036084 Rhodora Estate 36.10 -0.16 1937 Closed
4. 9036100 Rogongo Farm 36.05 -0.15 1938 Closed
5. 9036108 Ingatestone Nakuru 36.18 -0.15 1939 Closed
6. 9036119 Farm 468/8 Nakuru 36.13 -0.15 1940 Closed
7. 9036140 Buvuni Farm 36.18 -0.25 1946 Closed
8. 9036198 New Gakoe Farm 36.16 -0.26 1945 Closed
9. 9036206 G.K Rennie Nakuru 36.03 -0.23 1951 Closed
10. 9036240 Chesalungu Nakuru 36.20 -0.20 1957 Closed
11. 9036243 Dundori Forest 36.23 -0.25 1958 Active
12. 9036261 Nakuru
Meteorological 36.10 -0.26 1964 Active
13. 9036327 Bahati Catholic
3.6.2 Secondary Data
A span of the most recent thirty-year records from 1985 to 2015 was collected from
Nakuru Meteorological Station (Appendix 1). The climate data was a representative
of the most recent average climate in the study region and the 30 years’ span was
sufficient duration to encompass a range of significant weather anomalies that have
occurred in Bahati Sub-County, Nakuru County. The rainfall and temperature
characteristics for Bahati Sub-County were recorded in a summary check sheet and
this included rainfall onset, rainfall cessations, seasonal rain, annual rainfall, seasonal
maximum and minimum temperature. Data on maize yields was collected from the
MOA, Tegemeo Institution and Nakuru County Agricultural Offices. This data was
also collected from various literature sources, including books, journals, articles,
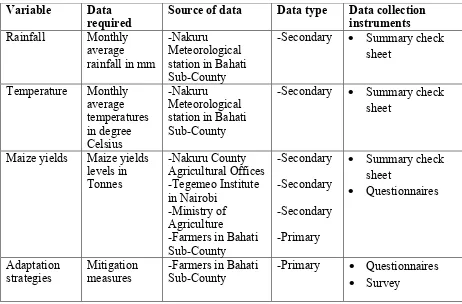
reports and periodicals. Table: 3.3 below indicates the instruments employed and the
target data collected.
Table 3.3: Data Collection Instruments, Variable and Sources Variable Data
required Source of data Data type Data collection instruments
Rainfall Monthly
average rainfall in mm
-Nakuru Meteorological station in Bahati Sub-County
-Secondary • Summary check
sheet
Temperature Monthly
average temperatures in degree Celsius -Nakuru Meteorological station in Bahati Sub-County
-Secondary • Summary check
sheet
Maize yields Maize yields
levels in Tonnes -Nakuru County Agricultural Offices -Tegemeo Institute in Nairobi -Ministry of Agriculture
-Farmers in Bahati Sub-County
-Secondary
-Secondary
-Secondary
-Primary
• Summary check
sheet
• Questionnaires
Adaptation
3.7 Data Analysis Procedures
According to Kothari (2004) data analysis implies examining the collected data and
making discussions, inferences and conclusions. The collected data was analysed
using descriptive and inferential statistics. Descriptive statistics included measures of
central tendency and measures of dispersion. The mean rainfall and temperature for
the period 1985 to 2015 was determined from Nakuru Meteorological Station (Table
3.2). Consequently, statistics on the inter-annual standard deviation and variance of
rainfall and temperature for the same period were calculated. Inferential statistics was
used to illustrate the relationship between variability in climate and maize yield
levels. This included Pearson’s correlation test, which was used to analyse the effect
of climate variability on maize yields.
Descriptive analysis was used to compute moving averages of two weather elements
(rainfall and temperature) and maize yield levels for over the 30-year period. SPSS
software version 23 and Microsoft excel 2010 were used to code and analyze the
farmers’ responses in the questionnaires. Arc view GIS software version 10.1 was
used to digitize the map of Bahati Sub-County. Presentation of the analyzed
descriptive data was either in the form of; tables, pie charts, frequencies, graphs,
percentages and means. Inferential analysis was used to test the hypotheses of the
study so as to derive relevant conclusions. Descriptive statistics was used to identify
and evaluate the existing climate variability adaptation strategies practised by the
farmers of Bahati Sub-County in response to climate variability. Finally, a SWOT
analysis on maize farming environment in Bahati Sub-County, was done to establish
Table 3.4: Summary of Data Analysis
OBJECTIVE VARIABLE STATISTICAL
TECHNIQUES 1. To establish climate variability
trends in rainfall and temperature experienced by farm holders in
Bahati Sub-County, Nakuru
County, Kenya in the period 1985 to 2015.
• Rainfall trends
• Temperature trends
Descriptive statistics:
-Moving averages
-Measures of central tendency and dispersion e.g. mean
2. To analyse the effects of climate variability on maize yield among farm holders in Bahati Sub-County, Nakuru County, Kenya in the period 1985 to 2015.
• Maize yields in Tonnes
• Rainfall variability
• Temperature variability Descriptive statistics: -Moving averages Inferential statistic: -Pearson’s correlation
3. To identify and evaluate the
existing climate variability
adaptation strategies practised by farmers in Bahati Sub-County, Nakuru County, Kenya.
• Adaptation strategies Descriptive
statistics:
-Measures of central tendency and dispersion
3.8 Validity and Reliability
According to Recha et al. (2017) validity and reliability of a test is confirmed through pre-testing of the data collection tools. The procedure of testing the validity
and reliability of the research involved pre-testing of the questionnaires to ascertain
the suitability of the tool before the actual administration. Pre-testing was done by
administering the questionnaire to 10% of the total respondents in Bahati
Sub-County, besides the ones targeted by this research in order to familiarize with
respondents, test sequence of questions, eliminate biased questions, eliminate
repetitive and ambiguous questions as well as to estimate the response rate and
duration of an interview.
3.9 Data Management and Ethical Considerations
Logistic considerations involved getting various authorizations that ensured
successful access into the field. The researcher first seeked permission from the
Institute, MOA and the Nakuru County Agricultural Offices. The researcher
administered questionnaires and used check sheets from the various sources to
compile primary and secondary data. High accuracy was emphasized to ensure
minimal or no errors in computation of the data. Ethical considerations involved the
researcher observing ethical issues while administering questionnaires and relating to
human subjects such as; confidentiality, anonymity and ensuring no harm falls on the
CHAPTER FOUR
RESULTS AND DISCUSSION
4.1 Introduction
This chapter presents results through discussion and interpretation of qualitative and
quantitative data gathered in the study. The discussion is structured into three main
sections with each section discussing findings based on the specific objectives. The
first section discusses the trends, seasonality and variability of rainfall, temperature
and maize yields. The second section discusses the correlation analysis between the
climatic variables (temperature and rainfall) and maize yields. The third section
discusses the climate variability adaptation strategies practised by farmers in Bahati
Sub-County and the strengths, weaknesses, opportunities and threats (SWOT) facing
maize production in Bahati Sub-County, Kenya.
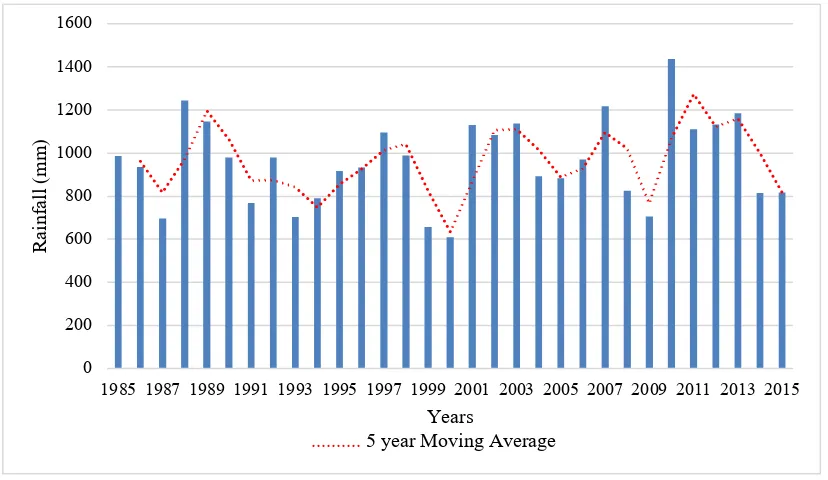
4.2 Rainfall Trends in Bahati Sub-County (1985 to 2015) 4.2.1 Annual Rainfall Trends
Rainfall is one of the key indicators of climate variability and this study sought to
establish the rainfall distribution pattern of the area for the last 30 years (1985 to
2015). The Annual rainfall data for the last three decades is shown in Table 4.3. The
results in Figure 4.1, shows that the annual rainfall amount has reduced between
1985 and 2015 in Bahati Sub-County. High amounts of rainfall are noticed in the
years 1988(1244mm), 1992(980mm), 1997(1094mm), 2001(1130mm),
2002(1084mm), 2003(1138mm), 2007(1217mm), 2010(1436mm) and
2013(1185mm), these coincided with the El Niño related high rainfall periods that
have occurred in Kenya since 1985 of 1997/1998, 2002/2003, 2006/2007 and
2009/2010. Low amounts of rainfall were noticed in the years 1987(697mm),
related drought periods that have occurred in Kenya since 1985 of 1991/1992,
1995/1996, 1999/2001, 2004/2005, 2008/2009 and 2014/2015. The rainfall
variability shown in the results above supports the argument by Shisanya et al. (2011) and Omoyo et al. (2015) that the ASALs in Kenya have been impacted negatively by high rainfall variability.
Figure 4.1: Annual Rainfall Trend for Bahati Sub-County (1985 to 2015)
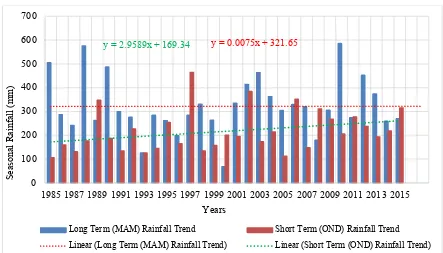
4.2.2 Seasonal Rainfall Trends
The extreme events were observed both during the long and short rainfall season.
During the long rainfall season high amounts of rainfall were recorded during the
years 1985(505mm), 1988(575mm), 1990(487mm), 2003(464mm), 2010(585mm)
and 2012(453mm), while low amounts of rainfall were recorded in 1993(125mm),
1996(199mm), 2000(69mm) and 2008(179mm) (Figure 4.2).
Further, during the short rainfall season high amounts of rainfall were recorded
during the years 1989(347mm), 1997(464mm), 2002(384mm), 2006(352mm),
2008(311mm) and 2015(315mm), while low amounts of rainfall were recorded in
1985(106mm), 1993(126mm) and 2005(112mm) (Figure 4.2). The high seasonal
0 200 400 600 800 1000 1200 1400 1600
1985 1987 1989 1991 1993 1995 1997 1999 2001 2003 2005 2007 2009 2011 2013 2015
Ra
in
fa
ll
(m
m
)
Years
rainfall amounts recorded coincided with the El Niño related high rainfall periods
that have occurred in Kenya since 1985 of 1997/1998, 2002/2003, 2006/2007 and
2009/2010. The low seasonal rainfall amounts recorded have coincided with the La
Nina related drought periods that have occurred in Kenya since 1985 of 1991/1992,
1995/1996, 1999/2001, 2004/2005, 2008/2009 and 2014/2015. According to a report
by IPCC (2007), changes in rainfall pattern in East Africa is as a result of the El Niño
phenomena and this supports our findings on the seasonal rainfall pattern fluctuations
in Bahati Sub-County.
Figure 4.2: Seasonal Rainfall Trend for Bahati Sub-County (1985 to 2015) 4.3 Rainfall Variability
4.3.1 Annual Rainfall Variations from the Mean
The annual rainfall variability characteristics for Bahati Sub-County (1985 to 2015)
were computed when annual rainfall anomalies were presented in the graph as shown
in Figure 4.3. Annual rainfall variability ranges from -350.40mm in 2000 to
+475.80mm in 2010 as shown in Figure 4.3. The highest rainfall anomalies below
average were recorded in years 1987(-263.2mm), 1993(-256.5mm),
1999(-y = 0.0075x + 321.65 y = 2.9589x + 169.34
0 100 200 300 400 500 600 700
1985 1987 1989 1991 1993 1995 1997 1999 2001 2003 2005 2007 2009 2011 2013 2015
Se
as
ona
l R
ai
nf
al
l (
m
m
)
Years
Long Term (MAM) Rainfall Trend Short Term (OND) Rainfall Trend
303.6mm), 2000(-350.4mm) and 2009(-255.1mm), these coincided with the La Nina
related drought periods that have occurred in Kenya since 1985 of 1991/1992,
1995/1996, 1999/2001, 2004/2005, 2008/2009 and 2014/2015. The highest rainfall
anomalies above average were recorded in years 1988(+283.2mm),
2007(+256.9mm), 2010(+475.8mm) and 2013(+224.4mm), these coincided with the
El Niño related high rainfall periods that have occurred in Kenya since 1985 of
1997/1998, 2002/2003, 2006/2007 and 2009/2010.
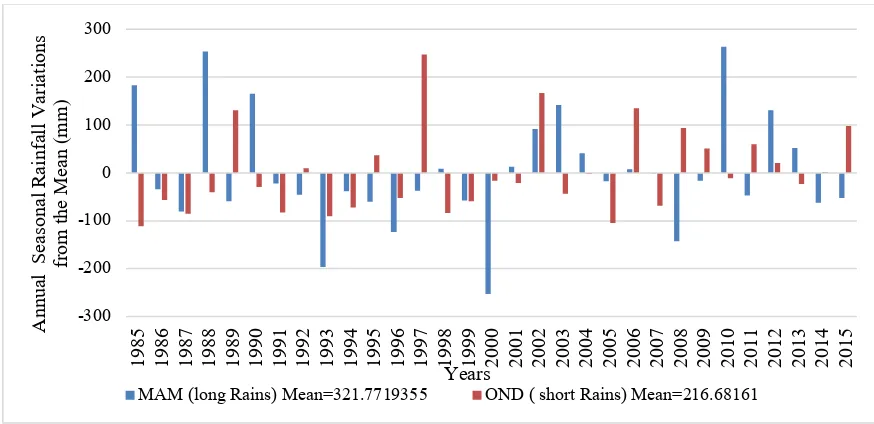
Figure 4.3: Annual Rainfall Variations for Bahati Sub-County (1985 to 2015) 4.3.2. Seasonal Rainfall Variations from the Mean
The variability in seasonal rainfall (long and short), and occurrence of extreme
events have effects on maize yields in the area exposing small scale farmers to
climate change vulnerability. This collaborates with various studies that have shown
that changes in seasonal rainfall patterns have a negative effect on rain fed
agriculture (Bals, c. et al., 2008; IITA, 2004). Rainfall variability is significant in the long rain season trend and ranges from (-253.17mm) in 2000 to (+263.53mm) in
2010 as shown in Figure 4.4. Rainfall variability is also significant in the short rain
season trend and ranges from (– 111.08mm) in 1985 to (+247.31mm) in 1997 as
shown in Figure 4.4. During the long rains (MAM) the highest rainfall variations
-400 -300 -200 -100 0 100 200 300 400 500 600
1985 1986 1987 1988 1989 1990 1991 1992 1993 1994 1995 1996 1997 1998 1999 2000 2001 2002 2003 2004 2005 2006 2007 2008 2009 2010 2011 2012 2013 2014 2015
above average were recorded in 1985(+182.8mm), 1988(+253.0mm) and
2010(+263.5mm). During the short rains (OND) the highest rainfall variations above
average were recorded in 1989 (+130.7mm), 1997(+247.3mm), 2002(+167.0mm)
and 2006(+134.8mm). The highest variations of rainfall above average for both long
and short rain season coincided with the El Niño related high rainfall periods that
have occurred in Kenya since 1985 of 1997/1998, 2002/2003, 2006/2007 and
2009/2010.
During the Long rains the highest rainfall variations below average were recorded in
1993(-196.6mm) and 2000(-253.2mm). While the highest rainfall variations below
average during the short rains were recorded in 1985(-111.08mm) and
2005(-104.6mm). The highest variations of rainfall below average for both long and short
rain season coincided with the La Nina related drought periods that have occurred in
Kenya since 1985 of 1991/1992, 1995/1996, 1999/2001, 2004/2005, 2008/2009 and
2014/2015.
Figure 4.4: Seasonal Rainfall Variations for Bahati Sub-County (1985 to 2015) -300 -200 -100 0 100 200 300
1985 1986 1987 1988 1989 1990 1991 1992 1993 1994 1995 1996 1997 1998 1999 2000 2001 2002 2003 2004 2005 2006 2007 2008 2009 2010 2011 2012 2013 2014 2015
An nu al S ea so na l Ra in fa ll Va ri at io ns fro m th e M ea n (m m ) Years
4.4 Seasonal Rainfall Onset and Cessation
4.4.1 Analysis of Seasonal Rainfall Onset and Cessation
The results in Table 4.1 shows that onset month for Long rain season has varied
alternating between March and April, 18 times representing 58.1% the onset was in
March and 13 times representing 41.9% the onset was in April. Cessation month has
also varied alternating between June, July and August. When farmers are informed
on the onset date they plan on when to prepare their land and acquire the necessary
inputs. This finding supports the earlier findings by Adeniyi et al. (2009) that the onset time for long term rainfall is normally used by farmers to determine the time
they clear and prepare the land for planting. The peak months’ range from March,
April and May.
The results in Table 4.1 shows that the onset month for the short rain season has
varied, alternating between October, November and December. 23 times representing
74.2% the onset was in October, 7 times representing 22.6% the onset was in
November and 1 time representing 3.2% the onset was in December. Cessation
month has also varied alternating between November, December and January. The
peak months’ range from October, November and December. The results found that
seasonal rainfall change is a challenge to Bahati Sub-County farmers and they need
Table 4.1: Summary of Seasonal Rainfall Characteristics for Bahati Sub-County (1985 to 2015)
Year Peak Month of Rainfall During the Long Rain Season Onset Month of Rainfall During the Long Rain Season Cessation Month of Rainfall During the Long Rain Season Peak Month of Rainfall During the Short Rain Season Onset Month of Rainfall During the Short Rain Season Cessation Month of Rainfall During the Short Rain Season 1985 April April July November November December 1986 April April July December December January 1987 May April July November October December 1988 May March June October October January 1989 April April June October October January 1990 April March June October October December 1991 March March June November November December 1992 April April June October October November 1993 May April July November October December 1994 May March July November November December 1995 March March July October October December 1996 May March September November November December 1997 April April June November October December 1998 May April July November November December 1999 March March June December November January 2000 April April September November October December 2001 April March September October October December 2002 April March June December October January 2003 May March June October October December 2004 April March June December October January 2005 May March July October October December 2006 May March June November October January 2007 May April June October October December 2008 March March June October October December 2009 May April June December October January 2010 March March June October October December 2011 May March June November October December 2012 April April June October October January 2013 April March August December November January 2014 May March June October October January 2015 April April June November October January
4.5 Temperature Trends in Bahati Sub-County (1985 to 2015)
4.5.1 Annual Average Temperature Trend
Temperature being the other key indicator of climate variability, this study also
sought to determine the temperature variations of the area for the last 30 years (1985
Appendix II. The mean annual temperature in the area has generally been increasing
since 1985 to 2015. The lowest average temperature recorded in Bahati Sub-County
was 17.7°C in 1989, while the highest temperature recorded was 19.7°C in 2009,
(Figure 4.5) and these coincides with the years 1987, 2000 and 2009 when Kenya
experienced the worst droughts. According to Mark et a1. (2008), seasonal temperature changes observed could alter the growing, planting and harvesting time
for agricultural production.
Figure 4.5: Annual Average Temperature Trend for Bahati Sub-County (1985 to 2015)
4.5.2 Annual Average Maximum Temperature Trend
The maximum average temperature for the Bahati Sub-County (1985 to 2015) was
25.8°C, while the highest maximum annual temperature was recorded in 1987 and
2009 at 26.8°C and 27.0°C respectively and the lowest in 1989 at 24.8°C as shown in
Figure 4.6. The Trend line equation shows that Bahati-Sub-County has been
experiencing a slightly gradual increase of 0.008°C in the annual maximum
temperature for the period 1985 to 2015.
R² = 0.6688
17.5 18.0 18.5 19.0 19.5 20.0
1985 1987 1989 1991 1993 1995 1997 1999 2001 2003 2005 2007 2009 2011 2013 2015
An
nu
al
Av
er
ag
e
T
em
pe
ra
tu
re
(
°C)
Figure 4.6: Annual Average Maximum Temperature for Bahati Sub-County (1985 to 2015)
4.5.3 Annual Average Minimum Temperature Trend
The minimum average temperature for Bahati Sub-County for the period 1985 to
2015 was recorded at 11.6°C. The lowest temperature recorded was in 1986 at 9.6°C
and the highest minimum temperature recorded was in 2010 at 12.7°C as shown in
Figure 4.7. The trend line equation shows that there has been a gradual increase of
0.075°C in the annual minimum temperature for Bahati Sub-County for the period
1985 to 2015.
y = 0.0083x + 9.2214
24.5 25.0 25.5 26.0 26.5 27.0 27.5
1985 1987 1989 1991 1993 1995 1997 1999 2001 2003 2005 2007 2009 2011 2013 2015
Me
an
Ma
xi
m
um
A
nn
ua
l
T
em
pe
ra
tu
re
(
°C
)
Figure 4.7: Annual Average Minimum Temperature for Bahati Sub-County (1985 to 2015)
4.6 Temperature Variability
4.6.1 Annual Average Temperature Variations from the Mean
Annual average temperature variability characteristics for Bahati Sub-County
showing the anomalies for the period 1985 to 2015 was presented in a graph as
shown in Figure 4.8. Annual average temperature variability ranged from 17.7°C in
1989 to 19.7°C in 2009 as shown in Figure 4.5. The highest average temperature
anomalies were recorded in the years 1986(-0.88°C), 1989(-1.0°C), 2009(+0.98°C)
and 2015(+0.91°C) as shown in Figure 4.8.
y = 0.0754x - 139.25
0.0 2.0 4.0 6.0 8.0 10.0 12.0 14.0
1985 1987 1989 1991 1993 1995 1997 1999 2001 2003 2005 2007 2009 2011 2013 2015
Me
an
Ma
xi
m
um
A
nn
ua
l T
em
pe
ra
tu
re
(
°C)
Figure 4.8: Annual Average Temperature Variations for Bahati Sub-County (1985 to 2015)
4.6.2 Annual Average (Maximum and Minimum) Temperature variations from the Mean
Maximum and minimum temperature variability for Bahati Sub-County for the
period 1985 to 2015 was recorded as significant with maximum temperature
variations peaks noted during the years 1987(+1.2°C), 1988(-0.7°C), 1989(-1.1°C)
and 2009(+1.2°C) as shown in Figure 4.9. During the minimum temperature
variations, high temperature variations were recorded during the years 1985(-1.7°C),
1986(-2.1°C) and 2010(+1.1°C).
Figure 4.9: Annual Average (Maximum and Minimum) Temperature Variations for Bahati Sub-County (1985 to 2015)
Table 4.2: Summary of Recorded Rainfall and Temperature Data for Bahati Sub-County (1985 to 2015)
Annual Rainfall (mm) Temperature (°C)
Maximum 1436.2mm 27.0°C
Minimum 610mm 9.6°C
Mean 960.4mm 18.7°C
Source: Kenya Meteorological Department
4.7 Trend of Maize Yields
4.7.1 Annual Maize Yield Trend in Tonnes
According to a 5-year moving average annual maize yield trend for Bahati
Sub-County, it showed a gradual decline in maize yield levels from 1985 to 2015 as
shown in Figure 4.10. This was partly attributed to rainfall and temperature
variations and according to Pearson’s correlation they had a significant correlation
coefficient of 0.741 and -0.51 respectively with maize yields, as shown in Table 4.4.
The mean annual maize yield was recorded at 39,363 Tonnes. The peaks in maize -2.5 -2.0 -1.5 -1.0 -0.5 0.0 0.5 1.0 1.5
1985 1987 1989 1991 1993 1995 1997 1999 2001 2003 2005 2007 2009 2011 2013 2015
A nom al ie s of A nnua l A ve ra ge (M ax a nd M in) T em pe ra tur e f rom the M ea n( °C ) Years
yields were observed in 1986(55,800 Tonnes), 1988(62,615 Tonnes), 1989(53,151
Tonnes), 2007(59,019 Tonnes), 2010(61,623 Tonnes) and 2011(50,045 Tonnes). The
dips were observed in the years 1993(17,802 Tonnes), 1999(13,832 Tonnes) and
2000(11,913 Tonnes) as shown in Figure 4.10.
Figure 4.10: Annual Maize Yield Trend for Bahati Sub-County (1985 to 2015) 4.8 Maize Yield Variability
4.8.1 Annual Maize Yield Variability in Tonnes
A significant amount of variability in maize yields has been recorded in Bahati
Sub-County for the period 1985 to 2015 both spatially and in temporal terms as shown in
Figure 4.11. The decline in maize yield trend in Bahati Sub-County is mainly
attributed to the increase in surface temperatures and variation in seasonal rainfall.
These findings appear to support Adamgbe and Ujoh (2013) research findings that
high rainfall variability has an effect on maize yield variability in Benue
State-Nigeria and Adejuwon (2005) research findings that climate variability has wide 0
10000 20000 30000 40000 50000 60000 70000
1985 1987 1989 1991 1993 1995 1997 1999 2001 2003 2005 2007 2009 2011 2013 2015
M
ai
ze
Y
ie
ld I
n (
Tonne
s)
Years