Available online: https://pen2print.org/index.php/ijr/ P a g e | 1064
Population Growth, Environmental Quality and Poverty Propagation in
Nigerian Economy: A Case for Sustainable Environmental Policy
Uwoikor,Ekenebrono Mordecai
Ajuru University of Education
+2347064810375
Cookey,Boma Clement
Department of Economics, Faculty of Social Science
University of Port Harcourt
+2348037779171,
mcmorriscookey@gmail.com
ABSTRACT
This study examined the effect of population growth and environmental quality on poverty in Nigerian economy between 1980 and 2017.The study was anchored on the Neo-Malthusian Theory which asserts that population growth has negative consequences on the environment and income growth. The study used secondary data collected mainly from the World Bank’s World Development Indicators(2017 edition) and multiple regression model which has poverty level(based on $5.50 per day) as the dependent variable and female fertility rate, population growth rate, and environmental quality, proxy by CO2 emission in thousand of kilo tons as the independent variables. Engle-Granger Error Correction Model (ECM) techniques of analysis were employed for the analysis of the data. The unit root test results showed that are the variables are integrated of order 1, while the co-integration test results revealed that population growth rate, female fertility rate, environmental quality, and poverty level have a stable long run relationship. Estimates from the Error Correction Model showed that population dynamic and the environmental quality have positive and significant impact on poverty level. The Granger causality test results revealed that female fertility rate causes population growth and population growth Granger cause environmental degradation and poverty. It was therefore recommended that Nigerian government should initiate sound population control policies and programs as a strategy for sustainable environmental management and poverty alleviation
Key words: Neo-Mathusan Theory, Population Growth, Poverty Trap, Sustainable Environment, Vicious Circle
1 Introduction
Available online: https://pen2print.org/index.php/ijr/ P a g e | 1065
adequate in the poorest countries” (Ravallion . 1991). Poverty is usually measured by a per capita real income below a fixed poverty line.
Data from the World Bank’s Poverty Update (2018) showed that about 11% of the World’s population live on less than $ 3.20 per day , and nearly half of the world’s population of about 7.6 billion people live on less than $2.50 per day (World Bank, World Population Prospect, 2018) . This implies that about 4 billion people live under the poverty line. In the same report, about 1.3 billion people live below extreme poverty level-less than $1.25 per day. According to the World Bank, 1 billion children worldwide are living in poverty and 22,000 of them day every day due to poverty. Worldwide, 805 million people do not have enough to eat. One –fourth of this figure is found in the Sub-Sahara – Africa. The number of poor people increased by 2.5 million between 2016 and 2017.
Reducing the world’s population living under the poverty line by half before 2015 was one of the of the objectives of Millennium Development Goals(MDG); and this was achieved in 2010, just midway to the target year of 2015.Between 1990 and 2017, about 1.1 billion people moved out of extreme poverty (less than $1.90 per day). Most these people are in Asia, namely, China and Indonesia. Only about 4 million people escaped poverty in the Sub-Sahara Africa during the same period. Between 2017 and 2018, poverty has increased in the Sub-Sahara Africa, with Nigeria having the highest percentage of people living below the extreme poverty line in 2017.
The world’s population is currently estimated at 7.643 billion people with an annual growth rate of 1.02%, down from 1.81 % in 1990. The world’s population is projected at 8 billion in 2023. Most of the increase in world’s population is expected from the Sub Sahara Africa. The population of this region is estimated at 1.2 billion, about 15% of the world’s population, with annual growth rate of 2.69%. The region’s population is growing faster than the world’s overall population . Likewise, poverty level is falling slower than the world’s level or any other parts of the world.
Nigeria is the 7th most populous country in the world today with and estimated population of 196 million people
(United Nations, August, 2018) equivalent to 2.56% of the world’s and growing at 2.61% per annum The population is projected at 206 million by 2020. With Nigeria achieving the status of country with the highest percentage of people living below extreme poverty, it seems there is correlation between population growth and incidence of poverty. Understanding the nature of the relationship between populations dynamic, environmental quality, and poverty is important for uplifting standard of living and social welfare in general, particularly, in Nigeria and in the Sub Sahara Africa. Traditional economic arguments suggest that rapid population growth will worsens poverty. Interestingly, this relationship is neither obvious nor well established from knowledge of theoretical or empirical studies in economics and related areas. The objective of this study, therefore is to empirically examine nature of the relationship between population dynamics, environmental quality, and poverty incidence in Nigeria economy from 19850 to 2017.
The study is significant to Nigerian economy. The finding of the study will give the concerned authorities insight into population explosion, environmental quality and poverty dynamics in Nigeria.
The rest of the paper is organized as follows: Section two is literature review; section three explained the method employed for collection and analysis of data. Section four is devoted to empirical analysis and discussion of findings; while section five is the conclusion and recommendation from the study
2 Literature Review
This section review theoretical and empirical literature relevant to the study. The review
proceeds as follows
Available online: https://pen2print.org/index.php/ijr/ P a g e | 1066
The Malthusian population theory was presented by Thomas Malthus in An Essay on the Principle of
Population”, published in 1798. The theory stated that population grows at an exponential rate whereas food
supply grows in a linear progression. The Malthusians are of the view that natural means of sustenance are limited in supply. Population grows geometrically, while the means of sustenance grows arithmetically and sooneror later the human population will surpass the means of sustenance.
The main focus of the Malthusian is to reduce population growth rates in rapidly increasing population regions of the world. According to the Malthusian theory, high population growth rates have negatively significant effects on the growth and development of an economy . They argue that it is impossible to attain a high living standard in rapidly increasing population areas: the reason being that the adjustment time is too short for new technology to be adopted. The result is the degradation of the natural environment, falling output of food , and standard of living.
The Malthusians, furthermore, assumed that the natural resources are fixed in supply and that the natural environment has definite carrying capacity. Increase in population beyond the carrying capacity of the natural environment portends danger and this may lead to the Malthusian Crisis: food shortages, famines, war and epidemics. The Neo-Malthusians went a step further by considering the impact of population growth on the natural resources and environment. They argued that even if the growing population could be fed with food, environmental challenges which can destroy the reproductive capacity of the environment may developed and therefore lead to a situation that is worst off. There is also the believe in this school of thought that rising income level lowers population growth, but this might be feasible in high population growth economies due to poverty. The Malthusians argued that the third world countries are stocked in poverty trap due to high population growth rate. The summary of Malthusianism is that rapid population growth rate is the a precursor of poverty
The Neo-Classical economics did not see anything wrong in high population growth rate. The see growing population as expanding market and source of cheaper labour resources, the assumption of the Neoclassical is that perfect competition will yield optimum outcome to all actors. High population growth is a sign of expanding market and , with perfect competition, it will eventually create wealth in the form of improve standard of living and technological improvement.
The Neoclassical assert that high population growth rate cannot lead to poverty, provided there is no market distortion. High population will not lead to environmental degradation and poverty, rather, it will lead to high economic activity, technological progress and higher standard of living. The Neoclassical economists allay the fear inherent in Malthusianism. Growing population brings effluence. This is the core of the favourable Population Effect Theory.
According Goerge Stigler(1976) large economy can practice specialization in a way that is not possible for small closed economy. Ester Boserup (1965) argued that population pressure on scarce natural resources induces resource efficient technology. This argument is based on the believe that carrying capacity is not fixed, but may be increased by converting to efficient technologies that can conserve natural resources and the environment. However, considering the time lag between population growth and technological development, environmental degradation and natural resources depletion are possibilities in the short run.
The Dependency school asserts that poverty and unequal distribution of resources are the causes of both environmental degradation and persistent increase in population. Dependency Theorists assert that poverty, inequality in wealth and resource allocations are all causing population pressures. If people were economically secure, they would have no need for large families. Dependency Theorists link the skewness of income distribution with distortion in income and substitution effects on population increase. They perceive that the population transition would take its natural course if the distributional issues were resolved properly. According to them, the key to both sustained economic growth and a slowing of the population growth rates lies in the removal of distortion from income distribution.
Available online: https://pen2print.org/index.php/ijr/ P a g e | 1067
2.2 Empirical literature
Many studies have been conducted to examine the relationship between poverty, environmental quality, and population growth to verify the theoretical postulation relating to poverty to environmental quality, and population in both developed and under developing countries. Some of the studies include:
Cropper and Griffiths (1994) examined the relationship between population growth and environmental degradation in 64 developing countries from 1961 to 1988. Their results indicate that population pressure as well as population growth are generally and positively correlated with deforestation.
Deininger and Minten (1996) observed that Mexico lost some 19.2 million ha of forest between 1980 and 1990. Empirical evidence from their study indicates that poverty is associated with higher levels of deforestation, and that the poorer municipalities lost a greater proportion of local forest resources during this period. Gaiha and Deolalikar (1992) studied 211 agricultural households in India between 1975 to 198 and observed that larger families were more likely to be poor at any given point in time, and also more likely to experience persistent poverty.
However, Ahlburg (1996) found no relationship between population growth and poverty in 15 Asian countries. Vincent and Ali (1998) found that deforestation rates increased as per capita incomes rose until districts reached an average income of 1,100 Malaysian Ringgit, after which they fell sharply using cross-country regressions analysis. Chelliah and Sudarshan,( 1999) Studied the impact of population growth on poverty in India between 1970 and 1998. The result show small negative impact of population on poverty. In contrast, Eastwood and Lipton (2001) found a significant effect of population on poverty: ‘The average (developing) country in 1980 had a poverty incidence of 18.9 per cent; had it reduced its fertility by 5 per1000 throughout the 1980s, this figure would have been reduced to 12.6 per cent.
Kelly and Schmidt (2001) examined the relationship between population and poverty. The result yielded large negative impact of population change on growth of per capital income. Orbetan (2002) studied effect of population growth on poverty in Philippines. The result shows that population pressure has a positive and significant effect on poverty in the phillipians. He, therefore, emphasizes that better fertility management is a critical component in any poverty alleviation package.
Oramah (2006) examined the effects of population growth on economic growth in Nigeria. Using annual time series data from 1980 to 2005, the study revealed that high population growth has adverse effect on economic growth. The study recommended that cue should be taken from countries like China, Russia, and Hungary in control population growth in Nigeria. Klasen and Lawson (2007) studied the impact of population growth on economic growth and poverty reduction in Uganda, Using panel data and income per capita as proxy for poverty. The result evidence that high growth rate has negative and significant effect on poverty. Turning to the question of whether rapid population growth reduces growth in income per capita.
Acemoglu and Johnson (2007) examine whether rapid population growth reduces growth in income per capita using data from 47 developed and developing countries over the period 1940 to 2000. They conclude that overall, the increases in life expectancy, and the associated increases in population, appear to have reduced income per capita. Adewole (2012) investigated the impact of population growth on economic development in Nigeria from 1981 to 2007. The study used Ordinary Least Square regression analysis techniques and annual time series data. The result revealed that population growth has positive and significant impact on economic growth proxy by Real Gross Domestic Product (RGDP) and Per Capita Income (PCI) ( respectively). The study therefore concluded that population growth has brought about an improvement in food requirement in Nigeria.
Available online: https://pen2print.org/index.php/ijr/ P a g e | 1068
Bangladesh from 1984 to 2014. They observed that there is significant and negative relationship between population growth and measures of economic advancement. The results demonstrate that rapid population growth is a real problem in Bangladesh because it contributes to lower investment growth and diminishes the savings rate.
Adekola et al.2016) examined the impact of population dynamics on unemployment in Nigeria between 2003 and 2015. Results show that population growth is not the sole factor responsible for increase in unemployment in Nigeria as unemployment statistics is stable for U.S. and China while their populations are growing, but the reverse is the case for Nigeria as both population and unemployment are growing. Recommendations were thereafter made to address other likely factors identified.
There is no consensus in both theoretical and empirical literature on the impact and direction of causality among the trio poverty, population and environmental quality. The results, from both developed and developing economies, are mixed. The impact of population growth on the environment has received very little attention in Nigeria and the Sub-Sahara Africa,. The present study will bridge this gap
3 METHOD OF STUDY
This section explains the method employed in the collection and analysis of the study data.
3.1 Research Design
The study adopted quasi- experimental research design. Newman (1994) defines quasi -experimental research design as the type of research method adopted where a group of variables is treated in order to observe its effect on another variable. Quasi-experiment research design is the most appropriate research design for this study because the researcher does not have control over the variables and the independent variables were treated to estimate their effects on the dependent variable
3.2
Model Specification
Based on the theoretical and empirical literature reviewed, the functional relationship between population dynamics and incidence of poverty in Nigerian economy could be expressed implicitly as:
POV = f(FFR, PGR EN , ) 3. 1 The implicit function is transformed into explicit econometrics function as follows:
The explicit econometrics function in 3.1 above is now transformed into double log linear model as
POV= 𝐼𝑛𝛽0+ 𝛽1𝐼𝑛𝐹𝐹𝑅 + 𝛽2𝐼𝑛𝑃𝐺𝑅 + 𝛽3𝐼𝑛𝐸𝑁 + +Ɛ 3.2
Where POV is poverty rate , FFR is the female fertility rate ,PGR is the population growth rate Nigeria ,and EN total Green House Gas emission per annum as proxy for environmental quality.β0 is the intercept term; while β1 ,β2, β3, are partial regression coefficient of the various variables. Ɛ is the error term and In is the natural logarithm
Choice of Variables and Definition
There are two kinds of variables in the model. They are the dependent and the independent variables.
Available online: https://pen2print.org/index.php/ijr/ P a g e | 1069
The dependent variable in the model is the incidence of poverty proxy by poverty head count ratio at $ 5.50 per day (2011 PPP) (% of population). The poverty rate is defined as the percentage of the population living on less than $5.50 a day at 2011 international price (World Bank World Development Indicator, 2017). From the model, poverty rate is a function female fertility rate, population growth rate, and environmental quality
Independent Variables
Female Fertility Rate (FFR): This is the total female fertility rate. It is measured as number of children a woman would give birth to if she lives to the end of her child bearing age and bear children in accordance with age specific fertility spacing. According to the Malthusian Theory increase in female fertility rate will increase population, and by extension increase in poverty rate. Hence, the a priori expectation for this variable is 𝛽1<0
Population Growth Rate (PGR) Trade openness is the degree to which a country allows the free flow of goods and services across international boundaries. The de jury measure is used here and is calculated as export plus import divided by GDP. The a priori expectation for the variable is 𝛽2 <0.
Environmental Quality. Environmental Quality is proxy by annual Green House Gas emission in Kilo tonnes. Increase in GHG emission will increase lead to environmental deterioration and increase in poverty rate. Increase in poverty rate will also lead to increase in environmental degradation. Hence the a priori expectation for this variable is 𝛽3<0 or𝛽3> 0
3.4 Techniques of Data Analysis
3.4.1 Unit Root Tests
Testing for unit root is the standard in any empirical work. There are important reasons for testing for unit root. First, testing for unit for unit root is important for determining the order of integration, setting up the model, and testing of hypothesis . The second is that time series data are always stationary and i non-stationary variables always lead to nonstandard distribution and spurious results (Granger & Newbold, 1978). Testing for unit root enable the researcher to classify the data into stationary and non-stationary data. Running regression on non-stationary variables will lead to spurious results and make testing of hypothesis misleading. Hence, unit root test is essential in analysis of time series data.
The Augmented Dickey-Fuller (ADF) (Dickey-Fuller, 1988) approach was employed for examining the unit root properties of the variables The general specification of the ADF expressed thus:
Yt = 𝜕0+ 𝜕1𝑡 +Ф𝑌𝑡−1+ 𝜕2 ∑𝑛 ∆
𝐶−1 YT-1 + 𝜖 3.3 Where:
ϵ is a white noise error term and 𝜕 is the coefficient of the lagged 𝑌𝑡−1 The coefficient of the lagged Y is expected to be negative. Equation 3 .3 was tested under the null hypothesis:
H0: Ф= 0 (there is unit root) against the alternative,H1: Ф < 0 (There is no unit root).
Available online: https://pen2print.org/index.php/ijr/ P a g e | 1070
included, the ADF is bias. Thus, a researcher who wants to make good case about unit root should perform more than one tests before drawing inference about unit root and the order of integration. The ADF unit root test was complemented with Phillip- Perron test (Phillip & Perron ,1989) to make the test robust. The most important factor in the use of ADF is the determination of optimum lag length.. Akaike , criterion was applied in selecting the optimum lag length .
3.5.2 Co-integration Test
integration is the necessary condition for establishing stationarity among non-stationary variables. Co-integration test is a necessary procedure to check if it is empirically meaningful to model any relationship among the integrated variables. If the variables are not co-integrated, it then implies that they cannot stay together in long run relationship and therefore no long run relationship can modelled among the variables. There are any co-integration tests approaches .This study adopted the Johansen (1988) co-integration analysis techniques. The Johansen test of co-integration approach is simple to implement and is a superior test. The test has optimal statistical properties .However, one of the drawback of the Johansen test is its reliance on the asymptotic properties of the data. The simple Johansen co-integration equation is expressed as
ΔY=:∑𝑛 𝛤∆𝑌𝑡 − 1 +
𝑡=1 ∑𝑛𝑡=1П𝑌𝑡 − 1 + λo + ФD+Ɛ 3.5
Where П and are matrixes of variables Γ . the rank of the matrix П is the number of the co-integrating equation in the model and rhe rank of the matrix is given by the number of the significant eigenvalues in the П .Johansen derived two test statistics. Two test statistics are the Maximum Eigenvalue and the Trace Statistic..
According to Granger Representation Theory, if two or more non-stationary variables are co-integrated, then they have a valid error correction representation, and their relationship can be expressed as error correction model (ECM).Therefore, the Unrestricted Vector Error Correction Model of equation 3.2 , which estimates the short run adjustment dynamics was expressed as:
∆𝑃𝑂𝑉 = ∑ 𝛿1∆𝑃𝑂𝑉𝑡−1+ ∑ 𝛿2∆𝐹𝐹𝑅𝑡−1+ ∑ 𝛿3∆𝑃𝐺𝑅𝑡−1+ ∑ 𝛿4∆𝐸𝑁𝐿𝑡−1+ 𝑛
𝑡=1 𝑛
𝑡=1 𝑛
𝑡=1
𝛿5 𝑛
𝑡=1
𝐸𝐶𝑀𝑡 − 1
+ 𝑉 3.6
The UVECM model was estimated using the Engle-Granger One Step method. Insignificant lags were
eliminated using backward elimination method to arrive at the parsimonious error correction model.
3.5.3 Model Diagnostic Test
It is very important, in every empirical study, to evaluate the empirical model and the parameter estimates whether they actually have the desirable statistical properties and to justify that they meet the basic assumption of the OLS. The import of this is to build confidence in the parameter estimates, and the empirical method. The following diagnostic tests were performed on the model and the parameters estimate.
Model Specification Test: The Ramsey RESET test was employed for examining if the empirical model employed for the analysis was adequately specified.
Available online: https://pen2print.org/index.php/ijr/ P a g e | 1071
Autocorrelation: To test for model for autocorrelation the Breusch -Godfrey (BG) test was applied on the residuals.
Homoskcedstcity: The assumption of homoskedasticity was tested using Autoregressive conditional heteroskedasticity(ARCH) -test approach to homoskedasticity testing.
Multicollinearity Test: Test of multicollinearity is important in a regression model . Correlation matrix test approach was employed for the test of multicollinearity.
4
Empirical Results and Discussion
Data collected for the study were analyzed computer aided statistical software E-view 9.0 The results of the data analysis is presented as follows:
4.1 Descriptive Statistics
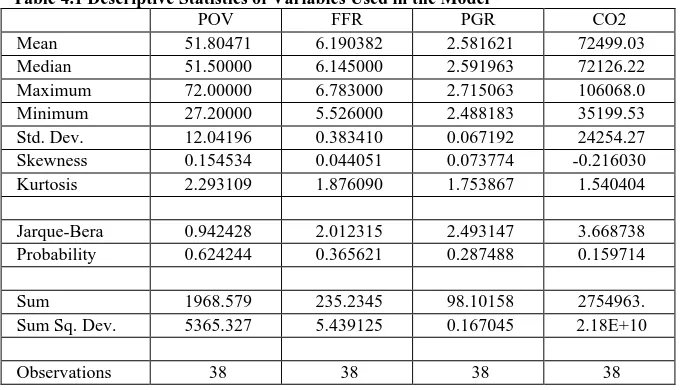
In empirical studies, it always important to examine the statistical properties of the data before applying them in regression analysis. Descriptive statistic provides the researcher the opportunity of understanding the nature of the data he is dealing with. The results of the data descriptive statistics is presented b
elow in Table 4.1
Table 4.1 Descriptive Statistics of Variables Used in the Model
POV FFR PGR CO2
Mean 51.80471 6.190382 2.581621 72499.03
Median 51.50000 6.145000 2.591963 72126.22
Maximum 72.00000 6.783000 2.715063 106068.0
Minimum 27.20000 5.526000 2.488183 35199.53
Std. Dev. 12.04196 0.383410 0.067192 24254.27
Skewness 0.154534 0.044051 0.073774 -0.216030
Kurtosis 2.293109 1.876090 1.753867 1.540404
Jarque-Bera 0.942428 2.012315 2.493147 3.668738
Probability 0.624244 0.365621 0.287488 0.159714
Sum 1968.579 235.2345 98.10158 2754963.
Sum Sq. Dev. 5365.327 5.439125 0.167045 2.18E+10
Observations 38 38 38 38
Source: E-View computer printout.
Available online: https://pen2print.org/index.php/ijr/ P a g e | 1072
4.2 Multicollinearity Test: Correlation Matrix Analysis
Multicollinearity problem is a serious challenge in multivariate model estimation and analysis. if the problem is not detected and no adequate model adjustment procedure is applied, the parameter estimates will lose efficiency and applying standard hypothesis test would be misleading. The results of the multicollinerity test, using correlation matrix test approach, is shown in Table 4.2
Table 4.2 :Correlation Matrix Results of Variables in the Model
POV FFR PGR
Co2
POV 1
FFR 0.63163 1
PGR 0.13309 0.28672 1
CO2 0.28597 0.60732 0.67354 1
Source: E-View computer printout.
The correlation coefficient matrix results above show a high correlation between female fertility rate and poverty level at 0.6316. There is, also, high correlation between female fertility rate and environmental quality of 0.6073. There is high correlation between population growth rate and environmental quality. However, the correlation between population and poverty, and that between female fertility and population growth are surprisingly very low. In all, none of the pair wise correlation coefficient high enough to give reason to suspect the incidence of multicollinearity between any of the variables(Gujarati,2005), hence, the variables can be combined in a multiregression model without or suspicion of multicollinearity problem.
4.3 Unit Root Test Results
The results of the test of unit root carried out on the data of variables in the model are shown n Table 4.3 below. The results from the unit root test shows that all the variables were not stationary at level. However, they variables became stationary after first differencing. Thus, the variables are 1st difference stationary or 1(1) series. The analysis proceeded to the next stage of examining the integrated variables for co-integration.
Table 4.3: Results of Unit Root Test
Variable
Augumented dickey-Fuller (ADR) Phillips-Perron (PP)
Level 1st Difference Order Level 1st Difference Order of
integration
POV -2.6185 -6.8732 1(1) -2.8551 -7.6511 1(1)
FFR -2.4805 -3.7391 1(1) -2.1888 -4.8581 1(1)
PGR -2.1863 -6.8710 1(1) -3.0499 -4.2350 1(1)
CO2 -1.8105 -3.5500 1(1) -1.9517 -6.0407 1(1)
1% = -4.4349 5% = -3.5403 +0% = -3.2024
4.4 Co-integration Test Results
Available online: https://pen2print.org/index.php/ijr/ P a g e | 1073
both skewness and excess kurtosis in innovations than the maximum eigenvalue (Cheung & Lai, 1993) .Trace statistic can be adjusted for degree of freedom which is very important in finite sample. Therefore, the decision was based on the Trace statistic (Sj̤oo, 2008)
Co-Integration Test Results – Maximum Eigen Value Statistics
Hypothesise No. of CE(s) r = 0 r ≥ 1 r ≥ 2 r ≥ 3
Trace Statistic 72.6977 31.0193 12.4288 0.6083
5% critical value 47.8561 29.7970 15.4947 3.8414
Prob 0.0000* 0.0360* 0.1375 0.4354
Source:E-iew printout
Cointegration Test Results – maximum Eigen Value Statistics
Hypothesise No. of CE(s) r = 0 r ≥ 1 r ≥ 2 r ≥ 3
Trace Statistic 72.6977 31.0193 12.4288 0.6083
5% critical value 47.8561 29.7970 15.4947 3.8414
Prob 0.0000* 0.0360* 0.1375 0.4354
Source:E-iew printout
4.5 Error Correction Model Results
The estimates of the error correction model is presented below in Table 4.5
Dependent Variable: D(POV) Method: Least Squares
Included observations: 34 after adjustments
Variable Coefficient Std. Error t-Statistic Prob.
DLOG(POV(-1)) 0.379039 0.246408 1.538256 0.1389
DLOG(POV(-3)) 0.287843 0.186748 1.541348 0.1382
DLOG(FFR) 1.629041 0.219288 1.113221 0.2782
D LOG(FFR(-1)) 9.407539 1..445343 6.508851 0.0125
DLOG(FFR(-2)) 1.312153 11.05197 0.533134 0.5995
D(LOGFFR(-3)) 5.411558 1.093124 0.428870 0.6724
DLOG(PGR(-1)) 0.935307 7.124076 0.481299 0.6353
DLOG(PGR(-3)) 7.811242 0.671258 11.63679 0.0375
DLOG(CO2) 0.000208 0.000163 1.275243 0.2162
DLOG(CO2(-1)) 0.000151 0.000154 0.976370 0.3400
DLOG(CO2(-2)) 4.41E-05 0.000148 0.297988 0.7686
DLOG(CO2(-3)) 2.105105 0.751537 2.801003 0.0247
ECM(-1) -0.924774 0.286323 -3.229830 0.0040
R-squared 0.480160 Mean dependent var 0.569718
Adjusted R-squared 0.183108 S.D. dependent var 8.620949
Available online: https://pen2print.org/index.php/ijr/ P a g e | 1074
The parsimonious error correction model result presented above shows the short run adjustment mechanism of the model. It shows how the variables adjust to short run disequilibrium. The result shows that female fertility rate has positive relationship with poverty rate. This implies that increase in fertility rate contributed to the incidence of poverty in Nigerian economy. The relationship is statistically significant. Specifically, change in female fertility rate by 1% brought about change in poverty rate by about 9.40% after 2 period lag .Orbeta(2001) found positive and significant impact of female fertility rate on poverty in the Phillipians.
Population growth rate has positive and significant impact on poverty rate .from 1980 to 2017, increase in population growth by 1% contributed about 7.8 % increase in poverty rate. The result confirms the findings of Adewole (2012) and Ali et al.(2015) which found positive and significant relationship between population growth rate and poverty rate in Nigeria and Bangladesh respectively. However, the result contradicts the findings of Chelliah and Sundarshan (1999) which found negative relationship between population growth rate and poverty rate in India. The differences could be attributed to the difference between economic growth rate and population growth rate during the period of the study in the respective economies , and the measures of poverty used in the studies.
Environmental quality, proxy by CO2 emission in kilo tones, has positive impact on poverty rate. This means that increase in CO2 emission contributes positively to poverty rate. Increase in CO2 emission means environment degradation and fall in environmental quality. The impact of environmental quality is statistically significant. The result is in line with the claims of the Neo- Malthusian school of thought and the findings of Copper and Griffiths (1996) , and Deininger and Minten(1994) which found positive and significant relationship between poverty and environmental degradation in Mexico and 64 developing countries respectively.
The model R value of 0.480 implies that population growth rate, female fertility rate and environmental degradation contributed about 48% variation in poverty level during the period under study. Other variables outside the model accounted for the remaining 52% variation.
The ECM coefficient of the model is 0.9247 and is statistically significant at 0.05 levels. It implies that there is a valid error correction mechanism in the model and the speed of adjustment is 0.927. That is, about 92% of any difference between the current value and the long run equilibrium value is adjusted to within one year.
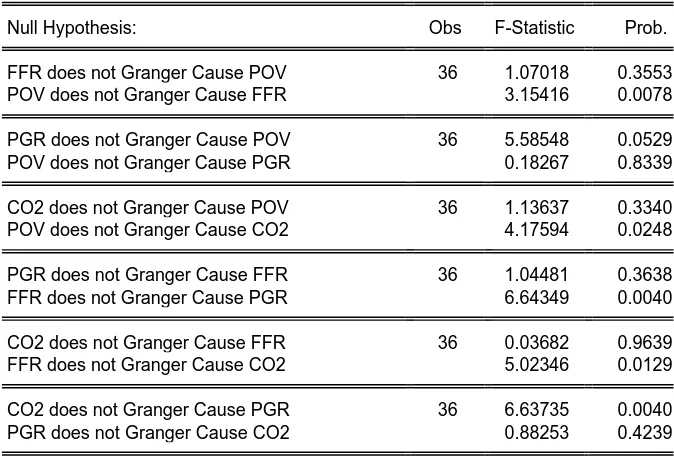
Table 4.6: GRANGER CAUSALITY TEST RESULTS
Null Hypothesis: Obs F-Statistic Prob.
FFR does not Granger Cause POV 36 1.07018 0.3553
POV does not Granger Cause FFR 3.15416 0.0078
PGR does not Granger Cause POV 36 5.58548 0.0529
POV does not Granger Cause PGR 0.18267 0.8339
CO2 does not Granger Cause POV 36 1.13637 0.3340
POV does not Granger Cause CO2 4.17594 0.0248
PGR does not Granger Cause FFR 36 1.04481 0.3638
FFR does not Granger Cause PGR 6.64349 0.0040
CO2 does not Granger Cause FFR 36 0.03682 0.9639
FFR does not Granger Cause CO2 5.02346 0.0129
CO2 does not Granger Cause PGR 36 6.63735 0.0040
Available online: https://pen2print.org/index.php/ijr/ P a g e | 1075
Source: E-View computer printout.
The Granger causality test results presented above show that there is a unidirectional causality from poverty to high population growth. That is poverty is the cause of high female fertility. This is line with the findings of some scholars on the direction of casualty between poverty and fertility rate. Population growth Granger causes poverty. Increase in population growth is the driver of poverty incidence. Poverty Granger cause environmental degradation. There is unidirectional causality from poverty to environmental degradation. The null hypothesis that poverty does not Granger cause CO2 is rejected at 0.05 level (row 3).The direction of causality is from female fertility to high population growth (row 4). The null hypothesis that female fertility rate does not Granger is rejected at 0;05 level of significance .In the 5th row, female fertility rate Granger cause environmental degradation, that is the direction of causality is from female fertility rate to environmental degradation. There is, also, unidirectional causality from environmental degradation to population growth
In all, the direction of causality shows that population dynamic, environmental quality and poverty form vicious circle of poverty trap. The direction causality is from poverty to high fertility rate, high fertility to high population growth rate , population to environmental degradation and back to poverty , environmental degradation , high population growth and to poverty. Earlier studies have also established the existence of the poverty trap in other economies.
4.7 Model Diagnostic Analysis
Diagnostic analysis of the empirical model and the parameter estimates are important to give sound footing to the empirical method and the parameter estimates . The results of the various diagnostic test carried out are presented below.
Model Specification Error Test
Ramsey RESET Test Equation: EQ01
Specification: D(POV) D(POV(-1)) D(POV(-3)) D(FFR) D(FFR(-1)) D(FFR( -2)) D(FFR(-3)) D(PGR(-1)) D(PGR(-3)) D(CO2) D(CO2(-1)) D(CO2( -2)) D(CO2(-3)) ECM(-1)
Omitted Variables: Squares of fitted values
Value df Probability
t-statistic 0.213958 20 0.8327
F-statistic 0.045778 (1, 20) 0.8327
Likelihood ratio 0.077734 1 0.7804
F-test summary:
Sum of Sq. df
Mean Squares
Test SSR 2.911577 1 2.911577
Restricted SSR 1274.952 21 60.71201
Unrestricted SSR 1272.041 20 63.60203
LR test summary:
Value df
Restricted LogL -109.8571 21
Unrestricted LogL -109.8182 20
Available online: https://pen2print.org/index.php/ijr/ P a g e | 1076
The f-statistics of the Ramsey RESET test is 0.04577 .the empirical probability of the f-statistic at 1, 20 degree of freedom is 0.8327.Hence, the null hypothesis is maintained at 0.05 levels of significance. This implies that there is no misspecification or specification bias in the empirical model employed for the analysis. Thus the empirical model employed actually captured the true relationship between poverty, population and environmental properties.
Residual Normality Test
0 1 2 3 4 5 6 7 8
-15 -10 -5 0 5 10 15
Series: Residuals Sample 1984 2017 Observations 34
Mean 0.245669 Median -0.029796 Maximum 16.27070 Minimum -14.92138 Std. Dev. 6.210695 Skewness -0.033413 Kurtosis 3.352735
Jarque-Bera 0.182591 Probability 0.912748
The Jacque- Bera statistic for the test of normality is 0.18259 with probability value of 0.91274. At 0.05 levels of significance, the null hypothesis is maintained .It implies that the residuals from the model estimate have normal distribution.
Autocorrelation Test
Table 4.7: Breusch-Godfrey Serial Correlation LM Test:
F-statistic 2.904810 Prob. F(2,19) 0.0793
Obs*R-squared 1.919737 Prob. Chi-Square(2) 0.1191
Available online: https://pen2print.org/index.php/ijr/ P a g e | 1077
The result of the Breusch –Godfrey LM test of autocorrelation is presented in Table 4.7 above. The BG statistic is 1.9197. The critical value at 0.05 level of significance is 4.600(Chi-square value at 2 degree of freedom and 5%). Hence, the null hypothesis is maintained at0.05 level of significance. This implies that there is no sufficient evidence to prove that there is incidence of autocorrelation among the error terms. The error terms are not serially correlated.
Heteroskedasticity Test
Table 4.8 : Heteroskedasticity Test: ARCH
F-statistic 0.146347 Prob. F(1,31) 0.7047
Obs*R-squared 0.155057 Prob. Chi-Square(1) 0.6937
The result of the Autoregressive Conditional Heteroskadasticity (ARCH) test is shown in Table4.8. The ARCH statistic is 0.1550 with empirical probability value of 0.6937.The critical statistic at 5% probability level is 3.840. The null hypothesis is therefore maintained at 0.05 levels of significance. Hence, there is no evidence of heteroskdasticity in the model
.
5 Summary and Conclusion
The aim of the study was to exam the relationship of population dynamics and environmental quality on poverty level in Nigeria during a period of thirty seven year from 190 to 2017.the study used secondary data and econometric method to examine the effect of population growth rate, female fertility rate, and environmental quality proxy by CO2 emission in kilo tons on poverty level. Granger causality was employed to determine the direction of causality among the trio of poverty, population and environmental degradation.
The results from the data analysis revealed that population growth rate, female fertility rate, environmental degradation have positive and significant on poverty level in Nigeria during the period under review. Environmental degradation, female fertility rate, and population contribute to the tune of 48% to the generation and propagation of poverty in Nigeria between the periods 1980 to 2017.
The Granger causality test revealed that poverty causes increased in female fertility. Female fertility is the main cause high population growth which in turn is the precursor of environmental degradation. There is also causality from environmental degradation to poverty and increase population growth rate. The model employed for the empirical analysis was adequately specified and the estimates have optimal statistical properties.
The high incidence of poverty in Nigerian economy is a direct consequence of population explosion and deteriorating environmental quality. Poverty will continue to plaque Nigerian economy unless appropriate policies are fashioned to address the remote causes of poverty .The present study has revealed the reason why previous policies directed at reducing poverty in the country failed. Those policies failed because they did not understand the link between environment and poverty. Poverty affects population growth rate which exert pressure on the environment..Poverty alleviation programs that do not address environmental issues and matters arising from the impact of population on environment and poverty will not be successful
Available online: https://pen2print.org/index.php/ijr/ P a g e | 1078
security. The poverty trap is a reality in Nigerian economy already. The surest means to break away from this vicious circle is sustainable development through environmental sustainable policies and programs. Instituting sound and effective population control policies will be an effective strategy for sustainable environment and poverty reduction in Nigeria.
References
Boserup, Ester, 1965; The Conditions of Agricultural Growth, Allen and Unwin, London.
Boserup, Ester, 1986; Shifts in the Determinants of Fertility in the Developing World: Environmental, Technical, Economic and Cultural Factors in The State of Population Theory (pp. 239–255) by Coleman and Schofield [Eds.], Blackwell, Oxford.
Cropper M. and C. Griffiths, 1994; The Interaction of Population Growth and Environmental Quality,
American Economic Review, Papers and Proceedings Edition, vol. 84, no. 2, pp. 250–254.
Kelley, A. and R. Schmidt (2001). “Economic and Demographic Change: A Synthesis of Models, Findings and Perspectives,” in Birdsall and Sinding (eds.).
Kremer, Michael “Population Growth and Technological Change: One Million B.C. to 1990”. Quarterly of Journal of Economics.108. 3 (1993), 681-
Malthus, T.R. (1798) First Essay on Population. Reprinted. London: MacMillan
World Bank (2017) World Development Indicators. Washington, D. C.: World Bank.
Adewole, A. O. (2012) “Effect of Population on Economic Development in Nigeria: A Quantitative Assessment.” International Journal of Physical and Social Sciences. Vol. 2
Oramah, I. T. (2006) “The Effect of Population Growth in Nigeria.” Journal of Applied Sciences.
Shahjahan Ali, Khandaker Jahangir Alam, Shafiul Islam, Morshed Hossain.(2015) An Empirical Analysis of Population Growth on Economic Development: The Case Study of Bangladesh. International Journal of
Economics, Finance and Management Sciences.Vol. 3, No. 3, 2015, pp.
252-259.
Ahlburg, D.A. (2002), ‘Does Population Matter; A Review Essay’, Population and Development Review, 28 (2): 329–50.
Chelliah, R.J. and R. Sudarshan (eds) (1999), Income Poverty and Beyond: Human Development in India, New Delhi: Social Science Pres
Gaiha, R. and A.B. Deolalikar (1992), ‘Persistent, Expected, and Innate Poverty: Estimate for Semi-arid Rural South India’, Cambridge Journal of Economics, 17 (4): 409–21.
Orbeta, A . O,(2002) Population and Poverty: A Review of the Links, Evidence and Implications for the Philippines, Philippine Institute for Development Studies November 2002, DISCUSSION PAPER SERIES NO. 2002-21
Available online: https://pen2print.org/index.php/ijr/ P a g e | 1079
Chung, Y. and K.S. Lai (1993) Finite Sample sizes of Johansen’s and Likelihood Ratio Tests for Co-integration, Oxford Bulletin of Economics and Statistics, 55(3).