Effects of Stocking Rate on a Rough Fescue Grassland
Vegetation
W.D. WILLMS, S. SMOLIAK, AND J.F. DORMAAR
Abstract
their construction, to a stable range condition, took from 14 years in the lightly grazed field to more than the length of the study in the A study was conducted to examine the effects of 4 stocking rates on the vegetation in a Rough Fescue Grassland vegetation in southwestern Alberta. Stocking at a light rate (1.2 AUM/ha) for 32
very heavily grazed field. The duration required for recovery was years did not affect range condition. However, a modest increase in stocking rate (1.6 AUM/ha) led to a marked decline in range
related to the original range condition of the exclosures.
condition. This was associated with a change in the composition of rough fescue from 38 to 21% of basal area. Rough fescue (FestzCQ ScQbreflQ) was nearly eliminated with a stocking rate of 2.4 AUM/ha. Rough fescue was repiaced by Parry oat grass (DQnthoni~ parryi) which increased from 24% at 1.2 AUM/ha to 48% at 2.4
AUM/ha. However, stocking at 4.8 AUM/ha resulted in severe deterioration of the grassland. This required annual adjustment of the stocking rate to avoid animal losses. The recommended stock- ing rate for good condition range in the area is 1.6 AUM/ha. Recovery of the vegetation within the exclosures, from the time of
setting stocking rates.
The stocking rate, expressed in this paper as animal unit months per hectare (AUM/ ha), defines the relative quantity of forage that will be harvested during the grazing period in a given year. The effect of increasing the stocking rate is to increase the proportion of forage utilized, which may lead to changes in species composition of grasslands (Ellison 1960). The species that increase because of an increased stocking rate are often sub-dominants in the plant com- munity and are potentially less productive than the dominant species (Looman 1969).
The purpose of this study was to examine the changes that occur in species composition of a Rough Fescue Grassland as a result of stocking with cattle at different rates. The work described is part of a final assessment of the study which was reported earlier (John- ston 1961, Peake and Johnston 1965).
The Rough Fescue Grasslands (Festuca scabrella)t in western Canada are managed primarily for grazing by cattle. They are found on highly productive soils, but cultural practices are limited by steep terrain. Consequently, management of grassland vegetation is through management of grazing by cattle. This is normally accomplished using a continuous grazing system where the cattle are turned onto the range in spring and removed in autumn. The most critical management decision made, with this system, is in
ing in elevation from 1,280 to 1,420 met&above sea level (Fig. i). Average precipitation at the substation, over a 30-year period from April to August, was 35 I mm. Average precipitation from April to
Site Description
August at 2 similar areas within 65 km (Pincher Creek and Pekisko) was 353 mm while the annual precipitation averaged 614
The study area was at the Agriculture Canada Research Substa-
mm over the same 30-year period. Annual precipitation data at the tion at Stavely, 80 km northwest of Lethbridge in the Porcupine
substation was not available during the study.
Hills of southwestern Alberta. The topography is undulating, vary-
Authors are rangeland ecologists and soil scientist, respectively, Research Station, Agriculture Canada, Lethbridge, Alberta TIJ 4BI.
The authors wish to acknowledge A. Johnston, who conducted this study until his retirement in 1980. Technicians S.R. Pisko, T.D. Allen, R.G. Gscbaid. and B.W. Kesler assisted with the sampling of the vegetation.
Manuscript accepted July 16, 1984.
INomenclature follows Hitchcock et al. (1971).
The vegetation is representative of the Rough Fescue Association described by Moss and Campbell (1947). Rough fescue is the dominant species in this community and Parry oat grass (Danthonia parryi) is the co-dominant. The soils are classified as Orthic Black Chernozemic (Udic Haploboroll) developed on till overlying sandstone.
Historical grazing of the study area was described by Johnston (1961). The area was moderately stocked for summer grazing with
Legend
Ftibotndary ---
Exckmre m
Sampling
sites
_-
Trees 0~00
0
100 200 IllFig. 1. Topographic mop offields showing 3-m contours, permonent exclosures ond sompling sites.
cattle from 1884 to 1908 and with horses from 1908 to 1920. From 1920 to 1943 the area was again stocked with cattle for summer grazing. Use was heavy during the 1930’s drought. The area was used lightly for winter pasture from 1944 to 1949.
Methods
In 1949,4 fields were fenced to enclose areas of 65,48,32, and 16 ha (Fig. 1). Exclosures were constructed within or contiguous to each field. The areas of exclosures, from the largest to the smallest field, were 0.66,0.41,0.76, and 0.23 ha respectively. Each field was stocked with 13 cows and their calves from mid-May to mid- November. This resulted in 4 stocking rates: light (L), 1.2 AUM/ha; moderate(M), 1.6 AUM/ha; heavy(H), 2.4 AUM/ha; and very heavy (VH), 4.8 AUM/ha. The recommended stocking rate for range in good condition in the area was 1.6 AUM/ha (Wroe et al. 1981).
The annual stocking rate on field VH was adjusted yearly after 1959 to avoid animal losses. Cattle were removed in summer when insufficient forage was available to maintain weight. This resulted in a stocking rate that varied from 2.5 to 4.8 AUM/ha and aver- aged 3.2 AUM/ha for the period from 1960 to 1981.
Vegetation was sampled in the exclosures and at 3 or 4 sites within each field (Fig. 1) using a point-transect method (Clarke et al. 1942). The point-frame had 35 pins spaced 2.5 cm apart. The method was applied by placing the frame at regular intervals along
a transect. Pins were dropped and “hits” were recorded by species only when the point touched the plant within 2.5 cm of the ground surface. Only current year’s growth was counted. Approximately 2,000 points were sampled at each site, in each year, for the period from 1949 to 1981.
The proportion of basal area occupied by each species was determined by dividing the “hits” on that species by the total points sampled and converting to percent. The percent composition of each species was determined similarly, but using the total “hits”on vegetation, rather than the total points sampled, as the divisor.
We identified 142 species during the study. For purposes of summarizing the data, this list was reduced to 22 with 3 additional groups of miscellaneous forbs, grasses, and shrubs. The revised list was used for all subsequent analyses.
Percent composition of individual species was plotted over time for each of the grazed sampling sites within fields. This analysis suggested that no additional information could be obtained by evaluating sites separately. Consequently, data from sampling sites were combined to produce 2 data sets for each field within any year. These were data from grazed sites and from ungrazed sites in the exclosures.
the exclosure and grazed sites of each field using an unpaired t-test decreased, the minimum value of each species, in either the grazed (Steel and Torrie 1980). The groups of species tested were: grasses, or the ungrazed area, was totalled. The values of species that forbs, shrubs, and short and unpalatable forbs. The latter category decreased with grazing were added to that total. The range condi- was represented primarily by yarrow (Achilles lanulosa) and tion coefficients were then smoothed using the 3-year running northern bedstraw (Galium boreale). median (Mosteller and Tukey 1977) and plotted.
The relative change in composition of rough fescue, Idaho fescue (Festuca idahoensis), Parry oat grass, and shrubby cinquefoil (Potentillafiuiticosa), with increased stocking rate, was determined by calculating the percent of their composition on grazed sites to their composition on ungrazed sites (exclosures). The average ratio was calculated for the last 6 years and plotted by stocking rate for the above species. The relative changes over time (years) were also shown for rough fescue by smoothing the data with the 3-year running median (Mosteller and Tukey 1977) and plotting for each field.
Results
Species composition, with a few exceptions, was similar among fields in the initial period of grazing (Table 1). The most important differences were less Parry oat grass in field M and a decline in rough fescue from fields L to M to H to VH. Fields L and M had the lowest similarity coefficient (0.67), which indicates that they were the least similar in their species composition. Fields H and VH had the largest similarity coefficient (0.92).
The similarity of the species composition among fields and between locations was determined using Sorensen’s community coefficient as adapted for quantitative data (Mueller-Dombois and Ellenberg 1974). The coefficient is derived by taking twice the sum of the smaller quantitative value of all species common to the two comparisons and dividing the total by the sum of the quantitative values of all species in both comparisons. The latter value will be 200 in all calculations since the quantitative values used were percent composition which totalled 100 in each comparison. The coefficient will vary from 0, if there are no species common to both samples, to 1, if species composition is identical in both samples.
A range condition coefficient was estimated by year, field, and location. Species composition was recalculated after adjusting the point counts to estimates of plant weight (Lodge and Campbell 1965).
The differences found among fields in the first grazing period were substantially modified by the final grazing period (Table 1). The composition of Parry oat grass increased from fields L to M to H, then decreased to field VH. Rough fescue declined with increased stocking rate. The composition of forbs generally increased with increased stocking rate while shrubs showed little identifiable response.
In the final grazing period, the magnitude of the similarity coefficients was inversely related to the difference in stocking rate. Field L was most similar to field M (0.92) and least similar to field VH (0.50). Field VH was most similar to field H (0.92) and least similar to field L. Field M was more similar to field L (0.92) than to field H (0.72).
Range condition was determined by comparing adjusted species composition of the test area (grazed) with adjusted species compo- sition that might be expected with no disturbance (ungrazed). The latter estimate was assumed to be represented by the average adjusted composition of the exclosure in the last 6 years of the study. This estimate was calculated for each exclosure and used for determining the range condition coefficient only for the field in which the exclosure was found.
The exclosures represented the vegetation of the respective fields reasonably well (Tables I and 2). During the initial period, the only significant (X0.05) differences found in the composition of spe- cies or groups of species, between the exclosure and grazed area, were less Parry oat grass (27.5 vs 39.5%) in the exclosure of field M and more Idaho fesuce (9.4 vs 4.8%) and rough fescue (16.4 bs 8.6%) in the exclosure of field H. For the same period, the similar- ity coefficients were all above 0.8.
Prior to calculating range condition coefficients, the species were categorized as those that decreased with grazing and those that increased, or showed no response, with grazing. The adjusted species composition of the grazed area was then compared with that of the ungrazed area. With the exception of those species that
In the final grazing period, well defined differences were found in the species composition between each grazed field and its exclosure. This was expressed by a decreasing similarity from fields L (0.8 1) to M (0.61) to H (0.43) (but increasing again in field VH, 0.64). Significant differences (X0.05) in composition of individual spe- cies between exclosures and the grazed areas were also found (Tables 1 and 2). The composition of Parry oat grass was less in the exclosure of fields M (16.9 vs 32.7%) and H (I 1.7 vs 48.0%) but
Table 1. Percent composition (basal area) of selected species in grazed areas of 4 fields in both the first and last 6-year periods of the grazing trial.
L
First 6 years
M H VH
Last 6 years
L M H VH
Agropyron spp. 3.0
Danrhonia parri 48.4
Fesruca idahoensis 4.4
Festuca scabrella 16.8
Carex spp. 7.6
Other grasses and grasslikes 3.3
Achilles lanulosa 0.2
Artemisia frigida 0.5
Fragaria glauca 0.4
Galium boreale 1.1
Geum macrophyllum 1.2
Lupinus argenteus 0.7
Oxylropis gracihs 0.8
Taraxacum officinale 0.1
Other forbs 6.9
Poientilla fruticosa 3.2
Rosa acicularis 0.8
Symphoricarpos occidentalis 0.1
Other shrubs 0.5
4.0 39.5 4.8 14.6 8.8 6.2 0.9 0.8 0.9 1.7 1.8 0.2 0.4 0.9 7.0 5.1 1.8 0.3 0.3 4.0 50.4 4.7 8.6 8.6 6.9
0.4 0.5
0.8 0.6
0.7 1.4 0.9 0.3 0.4 0.9 6.2 2.8 1.2 0.7 0.1 5:: 413 4.5 8.1 6.2 0.3 1.9 0.8 0.3 0.4 0.8 7.6 4.2 0.9 0.5 0.2 1.4 24.5 5.2 37.7 2.7 0.8 1.5 Tr 3.4 4.3 2.5 1.3 0.2 0.1 5.2 4.9 3.8 0.5 0 2.0 32.7 5.6 20.7 3.8 2.0 1.2 0.1 4.9 4.2 2.6 1.2 0.4 0.7 5.1 4.7 5.5 2.5 0.1 1.6 48.0 12.5 7.9 6.1 0.5 1.0 0.7 I.1 3.7 2.4 0.9 0.8 0.5 6.9 2.7 2.3 0.4 0 2.2 35.3 11.9 2.5 9.7 1.1 0.2 6.8 0 3.9 1.4 0.2 3.7 3.5 12.1 2.8 0.3 2.1 0.3
Tr - less than 0.1%
Table 2. Percent composition (basal area) of selected species in the exclosures of 4 fields in both the first and last Cyear periods of the grazing trial.
L
First 6 years
M H VH
Last 6 years
L M H VH
Agropyron spp. 3.0 9.4 4.0
Danthonia parri 47.9 27.5 44.4
Festuca idahoensis 4.3 3.7 9.4
Festuca scabrella 23.9 16.4 16.4
Carex spp. 5.9 8.9 6.3
Other grasses and grasslikes 2.4 12.4 4.8
Achilleo lanuloso 0.1 2.4 1.4
Artemisia frigida 0 0.4 Tr
Fragaria glauco 0 0.3 0.2
Galium boreale I.3 2.0 1.7
Geum macrophyllum 0.2 2.3 0.6
Lupinus argenteus 1.4 0.5 0.8
Oxytropis gracilis 0.5 0.1 0.2
Toroxacum officinale 0 0.8 0.1
Other forbs 5.2 5.8 4.6
Potentilla fruticosa 3.5 5.1 4.0
Rosa ocicularis 0.4 1.5 1.0
Symphoricarpos occidentalis 0 0.1 0.1
Other shrubs 0 0.4 0
3.4 55.4 5.2 6.3 9.5 8.5 0.4
0.1 0
0.5 4.7 1.0 0.2 0 2.2 1.2 0.4 0.6 0.41
0.7 19.0 8.4 41.5 2.4 9.0 1.5 0 0.5 3.3 1.4 0.6
Tr
0.3 5.2 4.3 1.7 0.2 0
1.3 16.9 2.5
54.5 1.9 2.8 0.9
0.1
0.6 2.2 0.8 0.7 0
Tr 2.1
7.8 3.8
I.1 0
0.9 I.8
11.7 46.1
5.5 3.7
55.9 23.4
1.6 5.4
3.6 0.1
0.9 0.4
0.1 0.4
0.4 Tr
4.9 2.4
1.1 2.5
0.8 1.0
0 0.2
0 0.1
4.0 6.9
5.0 2.4
3.4 0.5
0.2 2.7
0 0
7-r - less than 0. I%
greater in the exclosure of field VH (46.1 vs 35.3%). There was less
Idaho fescue in the exclosures of fields M (2.5 vs 5.6%) H 5.5 vs
12.5%) and VH (3.7 vs 11.9%) but more rough fescue in the exclo-
. 400
360
320
280
5 240 ._ .*
! 200
s
9 160 ‘i=
cp
z 120
80
Rough fescue
1.2 1.6 2.4
Stocking Rate (AlJM/ha)
4.8
Fig. 2. The effect of 4 stocking rates on the relative composition (basal area) of 4 species in the lost 6 years of the grazing trial. The relative composition is expressed as the percent ratio of the composition of the species in the grazedfield to its composition in the exclosure.
sures of fields M (54.5 vs 20.7%), (55.9 vs 7.9%) and VH (23.4 vs 2.5%). The proportion of shrubby cinquefoil did not differ signifi- cantly (D&OS) in any field. No differences of any species were found in field L. These comparisons are expressed as proportions in Figure 2.
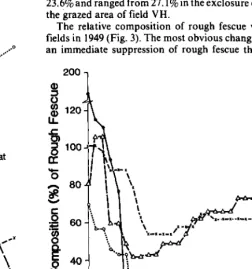
Total basal area of all species was similar among fields as well as between fields and the respective exclosure. Average basal area was 23.6% and ranged from 27.1% in the exclosure of field M to 2 1% in the grazed area of field VH.
The relative composition of rough fescue was similar among fields in 1949 (Fig. 3). The most obvious change that occurred was an immediate suppression of rough fescue that tended to reach
200 ,
80
60
49 53 57 61 65 69 73 77 81
Year
loo
80
80
Field L
80
20!~1111111111,111,1,,‘,,,,,,,,,,,,
49
53
57
61
65
69
73
77
81
Field H
Exctosrre b-0 Grazed areas E---X
I
I I I I I
49
53
57
61
65
69
73
77
81
Year
Fig. 4. Annual estimares of range condition for ljields and their exclosures.
stability after 8 years. Only in field L was there a long-term trend of an increase in the relative composition of rough fescue to about
100% 3 years before the termination of the study.
Vegetation Changes in Exclosures
Range condition improved within the exclosures of all fields and appeared to reach stability over time except in field VH (Fig. 4). On the grazed areas, range condition improved in field Land regressed in field VH. The range condition improved slightly on the grazed area of field M and remained unchanged on the grazed area of field H. Except for field L, the range condition in the exclosures and on the grazed areas of each field tended to diverge with time.
The impact of early differences in species composition among fields was noticeable throughout the grazing trial. Range condition. in the exclosure of field L reached near stability 14 years after protection (1963) from grazing (Fig. 4). This point was reached, in exclosures of fields M and H, after 23 years of protection (1972). Only in the exclosure of field VH was range condition apparently still improving in 198 1.
There was no major change in the moisture regime during the grazing trial. Large yearly variations masked shorter cyclical fluctuations.
Discusdon
The changes in the vegetation documented in this study were the result of both the historical use by herbivores and the grazing treatment imposed. Changes in precipitation were not detected and, therefore, could not have been a factor in vegetation changes.
The estimated coefficient of range condition in the exclosure and grazed area of field VH was likely too high since it was based on the species composition of plant community at a seral stage rather than at equilibrium. When the average composition in the last 6 years for fields L, M, and H are used as the criteria for establishing species composition at equilibrium, then range condition in field VH is about 30 percentage points lower than that shown, This suggests that, at the termination of the study, successional devel- opment in the exclosure of field VH lagged about 20 years behind that of field M and H and about 28 years behind that of field L.
An improvement in range condition and, in particular, the increase in composition of rough fescue within exclosures of all fields suggests that historical use had kept the grassland in a regressed seral stage. The effect of previous grazing had, evidently, not been distributed uniformly among all fields. This is indicated by differences in composition of rough fescue among fields at the start of the study (Tables 1 and 2). Rough fescue declines with an increase in both severity of utilization and soil aridity of the site (Looman 1969). However, since soils among exclosures were sim- ilar, it would appear that site potential was the same. This suggests that the primary reason for the original difference in composition of rough fescue was a difference in historical use by herbivores.
The total length of time required for the recovery of vegetation in the exclosure of field VH would be about 42 years. This agrees with the estimate of 20 to 40 years required for the recovery of over- grazed rough fescue grassland in south central British Columbia (McLean and Tisdale 1972).
The delayed recovery of range condition in the exclosures of field VH was attributed to a more regressed seral stage. This is indicated by a very low proportion of rough fescue at the time the exclosures were established. Rough fescue is the primary contributor to range condition because of its high contribution, and negative response, to grazing (Wroe et al. 198 1).
During the first 6 years of the study, the exclosure in field VH had only 0.4 times the amount of rough fescue as the exclosures in
fields M and H and 0.24 times as much as the exclosure in field L Conclusion (Table 2). Although the proportion of rough fescue in field VH
increased 3.7 times from periods to I to 2, the relative change in fields M and H was about the same (3.4 x). Apparently, rough fescue reached its maximum abundance toward the end of the study.
Vegetation Changes in Grazed Areas
Stocking rate had a major influence on species composition of the grassland. This influence was demonstrated by decreasing spe- cies similarity and by decreasing range condition (Fig. 4) as stock- ing rate increased from fields L to M to H. Light grazing pressure (field L) had no apparent effect on range condition although rate of recovery appeared to be retarded (Fig. 4).
The coefficients of range condition, for field VH, deviated from a trend of decreasing magnitude with increasing stocking rate when the coefficients were derived from species composition in its exclo- sure. However, when range condition in field VH is adjusted by -30% (for reasons discussed above), then the trend would continue in field VH.
The range condition trend from 1948 to 1981 in field VH is complicated by the variable stocking rate imposed in 1960. Reliev- ing the grazing pressure was associated with an improvement in range condition which continued until the conclusion of the study (Figure 4).
A decline in range condition from fields M to H to VH was associated with a loss in forage productivity. Average forage yields in the last 8 years of the study, in fields L, M, H, and VH, were 2,199, 2,17 1, 1,865, and 1,170 kg/ ha, respectively (unpublished data on file at Agric. Can. Res. %a., Lethbridge, Alta.). Utilization estimates for the same fields were 26,36,47, and 8 170, respectively. The information suggests that the substantial decrease in range condition from fields L to M (Fig. 4) was caused by a modest increase in utilization. This did not, however, result in reduced forage yield.
Rough fescue was the most productive forage species on the grassland. However, it was also the most sensitive to grazing. Increasing the stocking rate by 38%, from fields L to M, resulted in a reduction of 45% of basal area (Table 1). When compared on the basis of its relative proportion in the exclosure, the decrease was about 57% (Fig. 2). Rough fescue was nearly eliminated with very heavy grazing (field VH).
Most changes in composition of rough fescue occurred within the first 10 years (Fig. 3). Rough fescue was not recorded in field VH 6 years after the grazing trial was begun. Rough fescue did not appear again in the survey for 7 consecutive years, and only after grazing pressure was relieved in 1960. Rough fescue may not have been eliminated but its basal area only reduced to the point where plants were missed in sampling. It is also possible that the reap- pearance of rough fescue was from seedlings. Johnston et al. (1969) found that the top 2.5 cm of soil in field VH contained about 58 rough fescue seeds/ m2.
The early decline in the relative proportion of rough fescue in field L was the result of its rapid recovery in the exclosure. Although rough fescue did eventually recover to a proportion similar to that in the exclosure (Fig. 3), light grazing apparently prevented the same rate of recovery.
The decrease of rough fescue with increased grazing pressure was associated with an initial increase in the proportion of Parry oat grass (Fig. 2). Parry oat grass is more resistant than rough fescue to heavy grazing pressure. However, as grazing pressure increases, Parry oat grass also decreases. This occurs when the competitive advantage shifts to the shorter and less palatable forbs and sedges. Notable changes, with increased grazing pressure, were an increase in the proportion of pasture sage (Artemisia frigida), locoweed (Oxytropis gracilis). and dandelion (Taraxacum offi- cinale). The proportion of shrubby cinquefoil did not change with increased grazing pressure.
The management of grasslands should not be directed toward maintaining the most productive species in the community. The present study showed that rough fescue was readily lost with increased grazing pressure; however, this loss was compensated for by an increase in Parry oat grass and other associated species. A 37% loss in the basal area of rough fescue from field L to M did not affect forage yield. Very heavy stocking (field VH) resulted in an unproductive grassland that could not support cattle for a 6-month grazing period after it had deteriorated. However, forage palatabil- ity was not necessarily reduced. Although the proportion of some unpalatable forbs (pasture sage, locoweed) increased, others decreased (lupin Lupinusargenteus, yarrow). Furthermore, unpalat- able carryover (litter) was kept to a minimum.
The recovery of grassland to a stable range condition required complete protection from grazing for 20 to more than 32 years. The length of time varied with the original condition that was typified by the proportion of rough fescue in the grassland.
Literature Cited
Clarke, SE., J.A. Campbell, and J.B. Campbell. 1942. An ecological and grazing capacity study of the native grass pastures in southern Alberta, Saskatchewan and Manitoba. Dom. Can. Dept. Agr. Tech. Bull. 44. Ellison, L. 1960. Influence of grazing on plant succession of rangelands.
Bot. Review. 26: I-75.
Hitchcock, C.L., A. Cronquist, M. Owenby, and J.W. Thompson. 1971. Vascular plants of the Pacific Northwest. Parts l-5. Univ. of Wash. Press. _
Johnston, A. 1961. Comparison of lightly grazed and ungrazed range in the fescue grassland of southwestern Alberta. Can. J. Plant Sci. 41:615-622. Johnston, A., S. Smoliak, and P.W. Stringer. 1969. Viable seed popula-
tions in Alberta prairie topsoils. Can. J. Plant Sci. 49:75-82.
Lodge, R.W.,and J.B. Campbell. 1965. The point method and forage yield tables for determining carrying capacity. Agr. Can. Res. Sta., Swift Current, Sask., Mimeograph report.
Looman, J. 1969. The fescue grasslands of western Canada. Vegetatio 19: 128-I 45.
McLean, A., and E.W. Tisdale. 1972. Recovery rate of depleted range sites under protection from grazing. J. Range Manage. 25: 178-184. Moss, E.H., and J.A. Campbell. 1947. The fescue grassland of Alberta.
Can. J. Res. Sect. C. Bot. Sci. 25:209-227.
Mosteller, F., and J.W. Tukey. 1977. Data Analysis and Regression. Addison-Wesley Publ. Co., Don Mills, Ont.
Mueller-Dombois, D., and H. Ellenberg. 1974. Aims and Methods of Vegetation Ecology. John Wiley & Sons, Toronto.
Peake, R.W., and A. Johnston. 1965. Grazing effects on fescue grassland in western Canada. p. 1627-1630. In: 9th Internat. Grassl. congr., Brazil. Steel, R.&D., and J.H. Torrie. 1980. Principles and Procedures of Statis-