Western University Western University
Scholarship@Western
Scholarship@Western
Electronic Thesis and Dissertation Repository
8-22-2019 10:30 AM
Effects of Building Scale Parameters on Pressure Equalization
Effects of Building Scale Parameters on Pressure Equalization
Capacity of Roof Paver Systems
Capacity of Roof Paver Systems
Matthew SparksThe University of Western Ontario
Supervisor
Bitsuamlak, Girma T.
The University of Western Ontario
Graduate Program in Civil and Environmental Engineering
A thesis submitted in partial fulfillment of the requirements for the degree in Master of Engineering Science
© Matthew Sparks 2019
Follow this and additional works at: https://ir.lib.uwo.ca/etd
Part of the Civil Engineering Commons, and the Structural Engineering Commons
Recommended Citation Recommended Citation
Sparks, Matthew, "Effects of Building Scale Parameters on Pressure Equalization Capacity of Roof Paver Systems" (2019). Electronic Thesis and Dissertation Repository. 6382.
https://ir.lib.uwo.ca/etd/6382
This Dissertation/Thesis is brought to you for free and open access by Scholarship@Western. It has been accepted for inclusion in Electronic Thesis and Dissertation Repository by an authorized administrator of
ii
Roof pavers are commonly installed with a cavity beneath the paver that develops an internal suction pressure. These cavity pressures reduce the net pressure felt by a roof paver subject to uplift. Paver-scale parameter effects are well-understood, in this study, the effects of changing building-scale parameters such as height, aspect ratio, afterbody length, small and large scale roof obstructions, and paver to roof size ratio on cavity pressures are investigated. To do so pressure measurements were taken at the University of Western Ontario’s Boundary Layer Wind Tunnel Laboratory on a modular flat roof building model at four different heights with four different plan aspect ratios per height. It was found that size and shape of the separation vortices affect the pressure equalization capacity of the system. It was also found that the ratio of paver size to roof size greatly impacts the magnitude of peak pressures observed.
Keywords
Pressure equalization; roof pavers; cavity pressure; double layer cladding; wind loads; pressure distribution; flat roof; rooftop obstruction
Summary for Lay Audience
iii
Co-Authorship Statement
iv
Acknowledgments
Frankly, there are too many people I am thankful for to mention in this thesis, that would require a paper of its own. Below are a few of the people who have made this thesis both possible and enjoyable.
First, I would like to say thank you to Dr. Girma Bitsuamlak. He made this entire thesis possible, and I am incredibly grateful that he allowed me to be a part of his research team. His knowledge and expertise in the field of wind engineering is truly unparalleled and his passion for research is infectious. I appreciate him taking the time to teach me all that he did about engineering, research, and life.
I would also like to thank the Wind Engineering research group and especially Dr. Girma’s team for all of the support and good memories these past two years. It has been a pleasure to learn alongside of and from all of you. I’d like to especially thank Tibebu Birhane, who was a huge help in my work as well as a great role model for thoroughness and understanding in research in general.
I would also like to thank two of the facilities that were critical to this project. The University Machine Services staff, especially Mr. Ian Vinkenvleugel, were incredibly helpful as well, and your patience and creativity were much appreciated as we pushed the limits of the 3d printer. The Boundary Layer Wind Tunnel Laboratory staff were all very welcoming and I was lucky to have such experienced and helpful people to help me plan and execute my wind tunnel testing.
Finally, from the bottom of my heart, I would like to thank my family and friends for their unwavering support and encouragement. Thank you to my parents for always being there for me and for helping me to pursue my dream even though it was painful being so far from home. And thank you to my fiancé and her family as well for her love, support, and understanding of my busy and erratic schedule.
v
Table of Contents
Abstract ... ii
Summary for Lay Audience ... ii
Co-Authorship Statement ... iii
Acknowledgments ... iv
Table of Contents ... v
List of Tables ...vii
List of Figures ... viii
List of Appendices... xi
Chapter 1 ... 1
1 Introduction ... 1
Chapter 2 ... 9
2 Methodology ... 9
2.1 Model Base Design ... 9
2.2 Model Panel Design ... 13
2.3 Roof Flow Obstruction Elements ... 18
2.4 Development of Profile ... 23
2.5 Data Acquisition ... 25
2.6 Air-Permeability Factor ... 25
Chapter 3 ... 27
3 Results and Discussion ... 27
3.1 Validation ... 27
3.2 Effect of Building Height ... 29
3.3 Effect of Frontal Blockage ... 31
vi
3.5 Effect of Small Rooftop Obstructions... 37
3.6 Effect of Large Rooftop Obstructions... 39
3.7 Effect of Paver-size to Building-size Ratio ... 43
Chapter 4 ... 50
4 Conclusion ... 50
References ... 53
Appendix A ... 58
vii
List of Tables
Table 1. Base Model Dimensions Tested ... 10
Table 2. Definitions of lengths and heights ... 11
Table 3. Configurations tested containing obstruction ... 20
viii
List of Figures
Figure 1. Sample Roof Paver Installation ...1
Figure 2. Schematic of air flow through roof paver system ...1
Figure 3. Schematic showing effect of pressure equalization on net loading...2
Figure 4. Visualization of 16 non-obstructed test cases ... 10
Figure 5. Model Construction Details ... 12
Figure 6. Roof with paver layout ... 14
Figure 7. Roof with same porosity using representative holes ... 15
Figure 8. External pressure tap configuration ... 15
Figure 9. Slice view of model roof paver system panel ... 16
Figure 10. Isometric view of test configurations with roof top obstruction ... 19
Figure 11. Small obstruction attachment at center of building roo ... 22
Figure 12. Wind tunnel test setup... 22
Figure 13. Pressure tap tube connections ... 23
Figure 14. Mean velocity (a) and longitudinal turbulence intensity (b) profiles ... 24
Figure 15. Comparison between GCp values (top), APF values (bottom) from Birhane et al. (2019, submitted) (left) and the current study (right) ... 28
Figure 16. Envelope GCp contour plots for 1:1 aspect ratio building at four heights ... 29
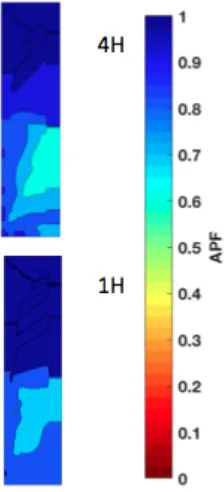
Figure 17. Envelope APF contour plots for 1:1 aspect ratio building at four heights ... 30
ix
Figure 19. APF contour plots for changing frontal blockage cases at constant height ... 32
Figure 20. GCp contour plots for changing frontal blockage cases at constant height ... 32
Figure 21. Centerline Air-Permeability Factor for 2H changing leading edge configurations ... 34
Figure 22. APF plots for changing afterbody length at constant height ... 34
Figure 23. Cp contour plots for changing afterbody lengths at constant height ... 35
Figure 24. Centerline Air-Permeability Factor for changing afterbody length cases ... 36
Figure 25. Centerline Air-Permeability Factor for changing afterbody length cases ... 36
Figure 26. Envelope APF plots for 2H small obstruction configurations ... 37
Figure 27. Envelope APF plots for 4H small obstruction configurations ... 37
Figure 28. Envelope GCp plots for 2H small obstruction configurations ... 38
Figure 29. Envelope GCp plots for 4H small obstruction configurations ... 38
Figure 30. Centerline Air-Permeability Factor for configurations with obstruction... 39
Figure 31. External mean centerline pressures for configurations with large obstructions .... 40
Figure 32. External peak centerline pressures for configurations with large obstructions... 41
Figure 33. Internal mean centerline pressures for configurations with large obstructions... 41
Figure 34. Internal peak centerline pressures for configurations with large obstructions ... 42
Figure 35. Mean net centerline pressures for configurations with large obstructions ... 42
Figure 36. Peak net centerline pressures for configurations with large obstructions ... 43
Figure 37. Zone 3 APF values for 2.67L4L configurations ... 44
x
Figure 39. Zone 3 GCp values for 2.67L4L configurations ... 46
Figure 40. Zone 3 GCp values for 2H small obstructed configurations ... 46
Figure 41. Peak GCp value distribution for System L / Building L = 0.01 ... 47
Figure 42. Peak GCp value distribution for System L / Building L = 0.025 ... 48
Figure 43. Peak GCp value distribution for System L / Building L = 0.05 ... 48
Figure 44. Peak GCp value distribution for System L / Building L = 0.1 ... 48
Figure 45. Peak GCp value distribution for System L / Building L = 0.2 ... 49
xi
List of Appendices
Appendix 1………...59
Chapter 1
1
Introduction
Roof pavers (Figure 1) are commonly used on flat roofs or podiums both as ballast and to provide access to areas that would otherwise go unused. They have many applications, including office buildings, commercial buildings, apartment complexes, and base areas in podium style high rise buildings. Roof pavers, along with solar panels and rain screen walls, are a multilayer cladding system. In a multilayer cladding system, a schematic of which is shown in Figure 2, there is always an inner and an outer layer. The outer layer is permeable, and between the two layers exists a cavity where the air flows through. This is contrary to a traditional single layer cladding system, such as brick or glazing, that has a relatively sealed outer layer.
Figure 1. Sample Roof Paver Installation
2
Figure 3. Schematic showing effect of pressure equalization on net loading As one might expect, there is a significant difference between the aerodynamic loading properties of a multilayer roof cladding system and those of a single layer system (Birhane et al, 2019 Submitted). In a roof paver system, the external layer, or top of the roof paver, is subjected to the flow of wind over the roof of the building. As the wind flow separates from the building at its leading edge, it creates a vortex on the roof and the pavers are subject to strong uplift forces. However, the pressure distribution is spatially varying, and some of the external pressure is transmitted through the gaps between the roof pavers. This creates flow through the cavity under the roof pavers and transfers the external pressure from above the roof pavers to the cavity beneath it, a simplified schematic of which can be found in Figure 3. This phenomenon of transferring the external pressure to the internal cavity is known as pressure equalization. Pressure equalization has the potential to significantly reduce the net uplift force acting on roof pavers, which can result in the difference between a system succeeding or failing, making its understanding critical.
(ASCE 7-16). This happens because the extreme peak values are smoothed out by lower magnitude suctions which are not correlated with those peak suctions.
4
peak net pressure coefficients on a permeable multi-layer roofing system to develop an air-permeability factor. Tests were performed at a 1:3 scale which allowed for reasonable modeling of the pavers, pedestals, gaps, and building. The results indicated that the air-permeability factor due to paver-scale geometry, the sheltering effect of parapets, the shape effect of the bare roof, and the peak velocity pressure were all independent inputs when considering the wind effect on pavers.
building edge. It was found that normalizing pressure coefficients by the relative wall size almost collapsed into a single curve for each array geometry. Interestingly, the author noticed that the height and length normalization is a fairly robust parameter, even for cases of taller buildings with aspect ratios closer to 1:1. In order to better understand the flow around low-profile solar arrays that causes peak loads, Pratt and Kopp (2013) performed particle image velocimetry (PIV) measurements on the models tested in Kopp et al. (2012) and Kopp (2013). The previous studies had identified where peak loads occurred, but the aerodynamic effects leading to these peak loads were still unclear. These PIV tests were done along the centerline of the building to capture critical air movements while also minimizing any out of plane effects. The separation bubble length was found to be fairly similar for the bare roof and low tilt angle cases, around 1.01h, where h is the height of the building. The mechanisms of peak loading for bare roof and low profile panels are shown to be due to the separation bubble and the associated vortex-induced suction. The authors also point out that building size is an important parameter to consider when determining peak loads. As the building’s height increases, the size of the separation vortices increases as well. Therefore, if the panels remain the same size, the relative size of the separation vortex to the panel increases, which likely means that the correlations in pressures over the panel increases, leading to higher loads on the panel. Stenabaugh et al. (2015) also dealt with scaling issues in their test of photovoltaic systems mounted parallel to roofs of low-rise buildings. Similar to roof pavers, they found that solar panel pressure equalization capacity is enhanced by increasing the gap width between modules and lowering the cavity depth between the panels and roof.
6
those cases, it is recommended to use state-of-the-art wind tunnel testing facilities to design rooftop cladding. Neither ASCE 7-16 nor the National Building Code of Canada, NBCC 2015, include general reduction factors when using a multi-layer pressure-equalizing system. However, ASCE 7-16 does recommend using approved test data or recognized literature for the specific type of air-permeable cladding being installed. The Australian/New Zealand Standard for wind loads (AS/NZS 1170.2, 2002) does give a general reduction factor for roofs with permeable external surfaces, granted that the solid to total area ratio of the system is between 0.99 and 0.999. The reduction coefficients range from 0.7-0.9 and are dependent on horizontal distance from the windward edge of the roof. The Building Research Establishment Digest, BRE 1989, and EN 1991-1-4 (2005) also allow the use of a reduction factor when designing permeable building facades. Their allowable reduction is significantly larger than the AS/NZS 1170.2 recommendations, allowing design pressures for the permeable rooftop system to be one-third of what they would be in the same area for an airtight cladding system.
which means that the internal pressure distribution is linear in nature and typically better matches the external pressure distribution, resulting in lower net wind loads on the panel. It has been shown that the literature regarding roof paver systems has led to a strong understanding of how variations in component-scale parameters affects the pressure equalization capacity and subsequently the failure wind speed of roof paver systems. However, there has not been as much research on how varying building-scale parameters affects the pressure equalization capacity of a roof paver system. It has been shown that increasing the level of turbulence in oncoming wind, which is one quantity affected by changing building height, results in decreased failure wind speed (Bienkiewicz and Meroney, 1988). The low-profile solar panel research done by Kopp (2013) has also shown that peak pressure coefficients (transformed to GCp values) depend on HL, the roof height of a nearly flat building multiplied by its length. PIV visualizations over solar panels, shown by Pratt and Kopp (2013), also show that the separation vortex height and reattachment length are dependent on the height of the building. Therefore, this study is necessary to investigate how these changing building scale parameters will affect the pressure equalization capacity of a model roof paver system.
Wind loads on roof pavers are calculated by interpolating and integrating the pressures measured by pressure taps at locations on the roof. Because roof pavers are a double layer system, the most important quantity for design is the net uplift pressure that the panel is subjected to. As previously shown, these net pressures are calculated by subtracting the internal, or cavity, pressure from the external pressure measured at the same time and at the same location. In ideal conditions, those external and cavity pressures will perfectly equalize, resulting in no net wind load on the roof paver. However that is not how the real systems behave, and thus the current study is necessary to investigate how that pressure equalization capacity of the roof paver system is affected by changing various parameters.
8
less net uplift (Bienkiewicz and Sun, 1992, 1997, Oh and Kopp, 2014). It was also found that having larger pavers with an aspect ratio of 1:1 will result in the lowest net pressure on the pavers (Bienkiewicz and Sun, 1997).
While the effect of the paver scale parameters is well understood and accepted, there is a need for more research regarding how changing building scale parameters affects the pressure equalization capacity of the roof paver system. It is known that changing building scale parameters affects the characteristics of the separation vortex, and it has been seen that this results in changing wind loads on the roof. However, there have been no studies that parametrically change different building characteristics and assess their impact on the pressure equalization capacity of a roof paver system. The objective of this study is to address that knowledge gap and to provide a database for future wind tunnel and CFD studies to be compared against.
This study investigates the effect of changing building-scale parameters of the pressure equalization capacity of a given roof paver system. In this study, 24 total building configurations are pressure tested in the Boundary Layer Wind Tunnel Laboratory Tunnel II at Western University. The test cases are comprised of 16 base configurations and 8 obstructed configurations. The different building-scale parameters tested in this study are building height, frontal blockage, afterbody length, and paver size to building size ratio. The effects of small (HVAC system representation) and large (Tower representation) obstructions were also studied. These different parameters are compared against base configurations and conclusions for each parameter are drawn.
Chapter 2
2
Methodology
2.1 Model Base Design
The model scale used in this experiment is 1:75. It was chosen because it would allow for adequate representation of building details without compromising the ability to produce a quality wind profile (Aly and Bitsuamlak, 2013). A smaller model scale would struggle to represent key architectural details while a larger model scale would make it difficult to generate an accurate boundary layer profile. Testing at a 1:75 scale also allows for a wider range of building scale parameters to be tested. In particular, the building size was designed to capture the full separation zone, even when the building is at its highest height.
10
capability. A full list of base building dimensions tested can be found in Tables 1 and 2 below.
Figure 4. Visualization of 16 non-obstructed test cases
Table 1. Base Model Dimensions Tested
Building Length (mm)
Building Depth (mm)
Building Height (mm)
Plan Aspect
Ratio
4L 4L H 1:1
4L 4L 2H 1:1
4L 4L 4H 1:1
4L 4L 6H* 1:1
2.67L 4L H 1:1.5
* It was not possible to recreate the full 6H configuration without creating blockage issues. Therefore, the
2.67L 4L 2H 1:1.5
2.67L 4L 4H 1:1.5
2.67L 4L 6H* 1:1.5
2L 4L H 1:2
2L 4L 2H 1:2
2L 4L 4H 1:2
2L 4L 6H* 1:2
L 4L H 1:4
L 4L 2H 1:4
L 4L 4H 1:4
L 4L 6H* 1:4
Table 2. Definitions of lengths and heights
Symbol
Model Scale 1:75
(mm) Full Scale (m)
4L 667 50
2.67L 444 33.3
2L 333 25
L 167 12.5
H 80 6
2H 160 12
4H 320 24
6H* 450 33.75
12
Figure 5. Model Construction Details
The base building model was created by attaching 40 individual panels together. To adjust the height of the model, a component was designed to be attached to panels vertically adjacent to each other. This component, shown above in Figure 5, was screwed separately into both the upper and lower panels of the base and a pin was inserted into the component to hold them together. The pin was tight enough to resist any separation during testing but was able to be pulled out between tests so that entire levels of the model could be removed and tests could be performed at different heights for the same aspect ratio.
horizontally adjacent pieces of the base and pins were inserted into the newly formed bracket to hold the pieces together. Because tests were planned to start with the full size building and remove pieces along the way, screws were installed to be accessed from the rear of the building where they could be removed without having to flip the entire model over or take it fully apart each time. Because the model was completely modular, each section of the base needed brackets installed into them, and these brackets also needed to be compatible with the front and rear walls because they were in contact during the higher aspect ratio configurations. All gaps between panels were sealed with tape before testing.
2.2 Model Panel Design
14
Figure 7. Roof with same porosity using representative holes
16
Of paramount importance in the design of this model was controlling unwanted leakage. The primary location of concern for leakage was around the pressure taps (Figure 8). There were concerns that if the roofing system models were machined out of two flat pieces of plastic and then attached together, it would be difficult to be confident that after pressure taps were attached to the model, the holes they were put through were completely sealed around them, especially in the middle of the panels. To combat this issue, it was decided that the panels should be 3d printed, or “grown”, all as one piece to be certain that no air could leak through unwanted. A slice view of the panels showing this can be seen in Figure 9. Figure 9 shows the permeable outer layer, the cavity, and the sealed base layer. The continuous pressure taps are shown extending from the exterior surface through the cavity and base layer.
Figure 9. Slice view of model roof paver system panel
The second location of leakage concern was at the joints between the roofing system panels. To control this, the joints were printed with a thin overlapping section between them and then taped on the top to ensure a complete seal.
equalization.. Another strategy used to prevent panel warping was to add more columns or attachments between the porous and base layer of the roofing system. The pressure tap tubes that were grown from the top piece through the bottom act as a structural support for the system, but in areas where the tap density is lower there is not adequate anti-warping support. So, an even distribution of pieces was added, with a few extra components installed around high risk areas like the edges. Along with preventing panel warp, these added members also modeled the posts that roof pavers are installed on top of. This increased the cavity flow resistance to a more realistic level, therefore increasing the quality of the results. Another limiting factor of the 3d printer was the maximum size of the panels it would be able to print. The insert type 3d printer had maximum panel dimensions of around 250 mm x 500 mm, so to accommodate this constraint, panels were split in half lengthwise so that they would be printable.
A potential issue with 3d printing the pressure taps through the two layers of the roofing system is that they were not all printed to the same dimensions. After printing, some of the pressure tubes were partially blocked with excess material. To fix this problem, each pressure tap was first drilled all the way through with a drill bit corresponding to the internal diameter of the pressure tap tubes. This was to ensure a consistent flow of air through the tube and into the tap. Following that, the bottom-most portion of the “grown” pressure tubes was drilled into by a drill bitthe same size as the exterior diameter of the pressure taps. This was to allow the pressure tap tubes to fit snugly into the panels. Finally, they were glued into place to guarantee their stability and to prevent leakage.
18
that type of flow, the flow near the upper and lower boundaries are generally very similar, which means that there should not be much variation between the pressure measured at the bottom of the cavity and the underside of the pavers. Also, the purpose of this study is to identify trends and better understand the physics of pressure equalization under changing building scale parameters. These results were not meant to be used directly in the design of roof paver systems, but rather to provide a roadmap for future study. Therefore, because these internal pressure measurements are similar to those on the underside of the pavers and because they are consistent over all test configurations, they are enough to give good insight into effects of changing the building.
2.3 Roof Flow Obstruction Elements
Figure 10. Isometric view of test configurations with roof top obstruction
The large-scale impedance was designed to represent one scenario where roof pavers are commonly applied: a podium and tower style building. Some condominium and hotel buildings are using roof pavers to open up these podium areas and use them for swimming or gathering areas. This can add value to a building by using space that was previously uninhabited. However, one can imagine that the presence of the large tower on the podium will influence the formation and structure of the separation vortices responsible for the peak loads on the roof paver system.
20
represent half of the plan dimensions of the base in the 1:1 aspect ratio case. This corresponds to the tower blocking 25% of the roof area in plan. The height of the tower was deemed to be sufficient to represent a high rise building while keeping the blockage of the wind tunnel below 5% as per ASCE 7-49 (2012) recommendations.
The other type of obstruction included in this study is of a smaller scale. In this case, the addition to the flat roof is of the magnitude of that caused by an HVAC penthouse, storage unit, or stair access. These types of impedances are common on the roofs of low-rise buildings, and in these cases the roof pavers might simply be used as ballast for the roofing system rather than to make a location accessible. This small obstruction was also placed at three typical locations on the roof, as shown in Figure 10. The HVAC- style impedance was created with model scale dimensions of 150 mm x 150 mm in plan by 40 mm tall. This corresponds to dimensions of 11.25 m x 11.25 m in plan and 3 m height in full scale. With these dimensions, the small-scale obstruction covers 7.5% of the 1:1.5 aspect ratio roof area in plan and its small thickness does not lead to any blockage issues when the height of the building is adjusted. This obstruction is tested at more heights than the large-scale obstruction, because this case is likely to appear on taller structures whereas the large-scale obstruction will only likely be applicable to smaller building heights. A full listing of the configurations including obstructions can be seen in Table 3.
Table 3. Configurations tested containing obstruction Building Length (mm) Building Depth (mm) Building Height (mm) Aspect
Ratio Obstruction
4L 4L 2H 1:1 L, FC
4L 4L 2H 1:1 L, FM
2.67L 4L 2H 1:1.5 S, C
2.67L 4L 4H 1:1.5 S, C
2.67L 4L 2H 1:1.5 S, FC
2.67L 4L H4 1:1.5 S, FC
2.67L 4L 2H 1:1.5 S, FM
Table 4. Definitions of obstruction size and location Symbol Definition of the obstruction
S Small Obstruction L Large Obstruction C Obstruction in Center FC Obstruction at Front Corner FM Obstruction at Front Middle
22
Figure 11. Small obstruction attachment at center of building roo
Figure 13. Pressure tap tube connections
2.4 Development of Profile
24
Both the generated and target mean wind velocity and streamwise turbulence intensity profiles can be found in Figure 14. The mean velocity profile has been normalized by the highest building height (33.75m full scale, 450 mm model scale) assuming a model scale of 1:75, the reference wind speed in these tests is approximately 15 m/s. Figure 14 shows a reasonable match between target and generated turbulence intensity, and the target and generated mean wind velocity profile. The profile used in this study is the same profile used in the development of the UWO contribution to the NIST database discussed at length in Ho et al (2005). The profile has since been used in multiple larger-scale studies, especially on the testing of solar panels (Kopp et al, 2012; and Kopp, 2013). While it is ideal to match the target mean wind profile perfectly, when testing large-scale low rise buildings, it is more important that the streamwise turbulence intensity profile matches the target (Ho et al, 2005). The major reason for this is because it is the turbulence structures present in the wind that dictate the flow structure and separation vortices around the model.
Figure 14. Mean velocity (a) and longitudinal turbulence intensity (b) profiles
2.5 Data Acquisition
Tests were performed from 0o to 90o in 15o increments for the base (no obstruction) cases and from 0o to 360o in 15o increments for the cases with obstructions on the roof. Each configuration was tested for 150 seconds in the wind tunnel, which corresponds to about an hour in full scale time assuming a velocity scale of around 1:3. The pressure scanner system recorded pressure measurements at a rate of 400 Hz in model scale per channel. The pressure coefficients measured in this testing were referenced to a height above the model where the flow was not disrupted by the model. The pressure coefficients were then converted to their correct height based on the measured mean velocity at that height.
The peak values shown throughout the study have been calculated by using the Sadek and Simiu (2002) method. The Sadek and Simiu (2002) method calculates peaks based on the measured frequency distribution of the pressure coefficients and calculates a peak value based on that. This results in a more stable estimate than either the observed peak or peak factor (Davenport 1971) calculation methods.
2.6 Air-Permeability Factor
As previously described, wind loads on porous, double-layer roofing systems can be reduced when the external uplift pressure is transmitted to the cavity beneath the roofing elements. This process is known as pressure equalization, and it has been shown to reduce the net loads on the component by many of the studies discussed in Chapter 1. As this thesis is interested in describing the pressure equalization capacity of a system under various geometric conditions, it is important to define a parameter that can be used to quantify that capacity.
A standard way to represent pressure equalization, and the system used in this thesis, is the air-permeability factor, or APF, introduced by Birhane et al (2019). The APF
26
𝐴𝑃𝐹 = 𝑚𝑎𝑥*+ ,+,-./𝐶𝑝2,4567 𝐶𝑝5,4567
Chapter 3
3
Results and Discussion
3.1 Validation
28
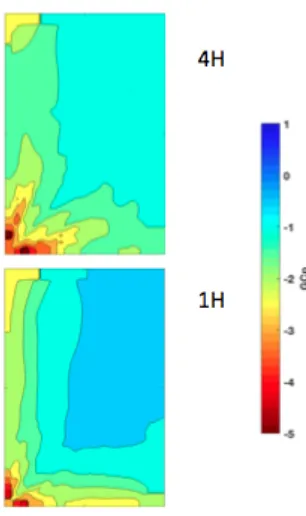
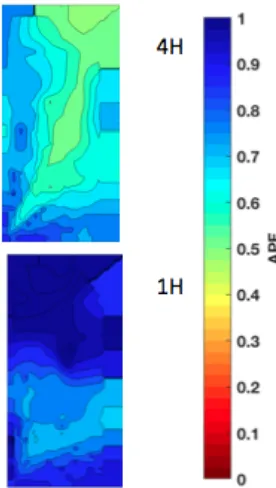
Figure 15. Comparison between GCp values (top), APF values (bottom) from Birhane et al. (2019, submitted) (left) and the current study (right)
To validate the results presented in this study, the GCp values found for the 4L4L1H case of the current study are compared to the values reported by Birhane et al (2019) (Figure 15). The roof paver system used in Birhane et al (2019) was designed to represent the system tested by Aly et al. (2012). The Aly et al. (2012) system was also the basis for the design of the roof paver system in the current study. The Birhane et al. (2019, submitted) study building was created at a 1:3 scale with full scale plan dimensions of 6.6 m by 6.6 m and a full scale height of 3.6 m. This building is smaller than the building tested in the current study. The configuration tested from this study has plan dimensions of 50 m x 50 m and a height of 6 m. The shape of the corner vortices is similar between Birhane et al. (2019, submitted) and this study, although when normalized by the building height the present study corner vortices are larger. This is likely due to the larger building plan dimensions in the current study. The GCp values for the current study are also larger than they are for Birhane et al. (2019, submitted). There are two potential reasons for this. First, the building plan dimensions for the current study are significantly larger than they are for the Birhane et al (2019, submitted) tests. Second, the roof paver size to building size ratio for the two tests are different. The Birhane et al. (2019, submitted) paver to roof size ratio is much larger than the ratio of the current study. As will be shown in this study, larger roof paver size to building size ratios result in lower GCp values than smaller roof paver size to building size ratios. Considering this, the match between the current study and previous studies of the same target roof paver system was deemed to be adequate.
3.2 Effect of Building Height
The first parameter investigated in this study is the effect of changing the height of the model building, while keeping the plan aspect ratio of the building constant. Changing the height of the building does many things at the same time. First, as the height of a building increases, the wind at roof height becomes less turbulent. This can lead to changed loading patterns and loads on the roof as the oncoming flow has higher correlated structures within it. Second, the larger frontal blockage creates a larger separation vortex which results in larger areas of high suction.
30
Figure 17. Envelope APF contour plots for 1:1 aspect ratio building at four heights
To investigate how changing the height of the building affects the exterior and interior pressure distributions on the roof pavers system, GCp (Figure 16) and APF (Figure 17) contour envelopes were plotted for all four building heights at each plan aspect ratio. The
GCp envelopes shown in Figure 16 show a clear pattern. As the height of the building increases, the corner separation vortices grow proportionally larger and have larger areas of maximum suction. The lower magnitude uplift center roof zone also gets smaller and smaller as the building gets larger. Interestingly, there does not appear to be much of a difference between the GCp values of the 4H and 6H* cases, which could indicate an upper limit on roof separation vortex size. The APF envelopes (Figure 17) show a similar pattern to the GCp envelopes (Figure 16). For the lower building heights, the high APF
zones in the roof corners and edges do not extend far into the middle of the roof, but rather seem to stay closer to the edges of the roof. For the higher building height cases, the higher APF zones expand and take up a larger area, which shrinks the low APF center roof zone.
(Figure 18). Figure 18 shows that as the height of the building increases, the APF value of the system decreases. This means that at higher building heights, the roof paver system is better at equalizing the uplift pressure than lower heights. One possible explanation for this is that the lower turbulence in the oncoming flow at higher heights allows it to better transmit into the cavity and equalize the external pressure on the pavers.
Figure 18. Centerline Air-Permeability Factor for varying height configurations
3.3 Effect of Frontal Blockage
Similarly to changing the height of the building, changing the width of the leading edge also alters the blockage area of the windward face of the building. In this case, however, the building stays at the same height, which means that the turbulence in the wind profile at roof height is the same for all cases. This isolates the frontal blockage area as the sole changing parameter and clearly shows its effect on the roof pressures.
0.0 0.1 0.2 0.3 0.4 0.5 0.6 0.7 0.8 0.9
0 0.1 0.2 0.3 0.4 0.5 0.6 0.7 0.8 0.9 1
Ai
r P
er
m
eabi
lit
y
Fac
tor
Normalized Building Depth
32
Figure 19. APF contour plots for changing frontal blockage cases at constant height
To clearly show the effect that frontal blockage has on the APF and GCp values, contour plots of APF (Figure 19) and GCp (Figure 20) were compared for the 2H 0o AOA cases. Figure 19 shows that as the frontal blockage decreases, APF values can become greater than 1. This is especially evident in the 1L4L2H case, where APF values are as high as 1.4 at the leeward side of the building. This means that the cavity pressure is actually positive, and pushes against the underside of the roof pavers, leading to the net pressure coefficients being higher than the external pressure coefficients. The GCp envelopes (Figure 20), however, show that this will likely not result in uplift failure of the roof pavers in that zone. The GCp values (Figure 20) show that the separation vortex for each configuration extends approximately the same distance along the roof surface, validating Pratt and Kopp (2013) theory that the separation vortex length is primarily dependent on the height of the building. Figure 20 also shows that the GCp values in the reattachment zone, where APF is greater than 1, are not as large as the GCp values near the leading edge of the roof.
34
Figure 21. Centerline Air-Permeability Factor for 2H changing leading edge configurations
3.4 Effect of Afterbody Length
The third parameter being investigated is the effect of keeping the windward face of the building constant and altering the length of the afterbody behind the building. These tests will show how the different building depths affect the separation vortex development and the corresponding external, internal and net loads. It is important to note that each of these cases have the same windward frontal blockage area.
Figure 22. APF plots for changing afterbody length at constant height
0.0 0.2 0.4 0.6 0.8 1.0 1.2 1.4 1.6 1.8
0 0.1 0.2 0.3 0.4 0.5 0.6 0.7 0.8 0.9 1
Ai
r-Pe
rm
eab
ili
ty
Fac
to
r
Normalized Building Depth
Figure 23. Cp contour plots for changing afterbody lengths at constant height
The APF (Figure 22) and GCp (Figure 23) contours shown above describe the effect that changing the afterbody length of a building has on its pressure equalization capacity. The
APF contours show that APF values are highest at the leading edge of the roof and they generally increase as the distance from the leading roof edge increases. The size of the high APF zone appears to be relatively constant across each of the changing afterbody configurations. As previously discussed, this is likely because these tests were performed at a constant building height and the size of the separation vortex is directly related to building height. The Cp contours (Figure 23) show that both the size and magnitude of the uplift zone remain constant across all afterbody lengths. Thus, the reattachment phenomenon causing the APF values greater than 1 in the previous section appears to occur only when the afterbody of the building is much greater than the width of the building. This is a potential area of further investigation for future studies.
36
except for 4L, the centerline APF values decrease at approximately the same rate along the entire length of the building.
Figure 24. Centerline Air-Permeability Factor for changing afterbody length cases
Figure 25. Centerline Air-Permeability Factor for changing afterbody length cases
0.0 0.1 0.2 0.3 0.4 0.5 0.6 0.7 0.8 0.9 1.0
0 0.1 0.2 0.3 0.4 0.5 0.6 0.7 0.8 0.9 1
Ai r-Pe rm eab ili ty Fac to r
Building Depth Normalized by 4L
4L 2.67L 2L 1L
0.0 0.1 0.2 0.3 0.4 0.5 0.6 0.7 0.8 0.9 1.0
0 0.1 0.2 0.3 0.4 0.5 0.6 0.7 0.8 0.9 1
Ai r-Pe rm eab ili ty Fac to r
Building Depth Normalized Individually
3.5 Effect of Small Rooftop Obstructions
It is common for flat roofed buildings to have cooling towers, HVAC systems, or other small-scale obstructions on their roof. The effects of these systems on pressure equalization and component wind loading can be imagined but have never been studied and quantified. The small-scale obstruction cases were shown in Figure 10 above. The contour plots in Figure 26, Figure 27, Figure 28, and Figure 29 show the effect that small obstructions have on APF and GCp values.
Figure 26. Envelope APF plots for 2H small obstruction configurations
38
Figure 28. Envelope GCp plots for 2H small obstruction configurations
Figure 29. Envelope GCp plots for 4H small obstruction configurations
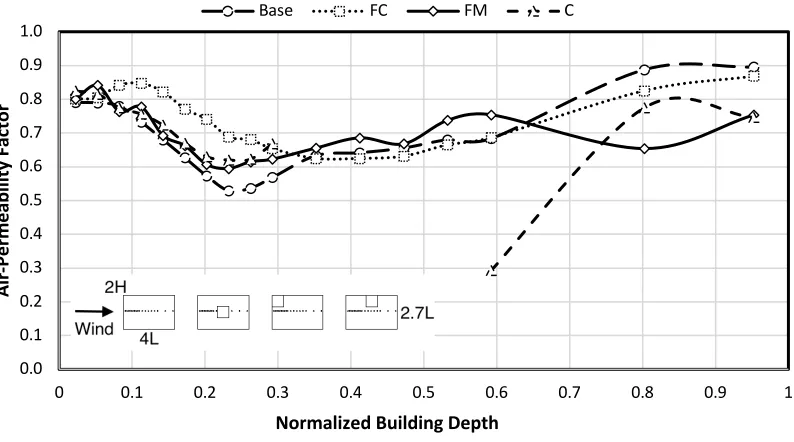
The centerline APF values for this parameter (Figure 30) include the base, front corner, front middle, and center configurations. The base, FM, and C configurations all have similar separation vortex area APF values, but the FC case has much higher APF values. This is likely due to the FC configuration having extra frontal blockage that produces an irregular, larger separation vortex. Also, the C case has a significantly reduced APF value immediately in the lee of the small obstruction.
Figure 30. Centerline Air-Permeability Factor for configurations with obstruction
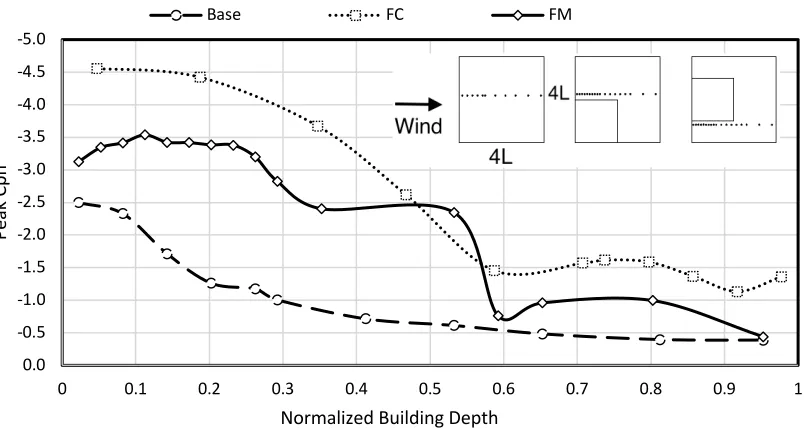
3.6 Effect of Large Rooftop Obstructions
In many cases, roof pavers are used on the podium of a high rise building to provide access to a landscaped or recreational area. In these cases, the large tower near the roof pavers has a clear influence on the flow structure of the wind near the podium. This model, shown in Figure 10, represents that case and investigates how different large obstruction locations affect the pressures acting on the roof.
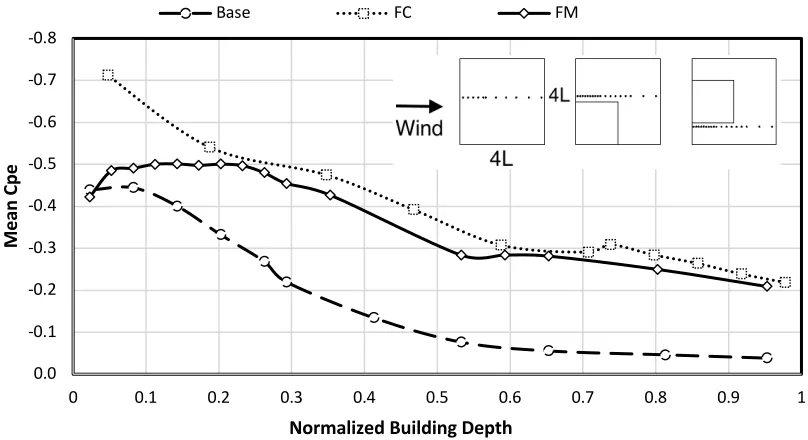
The mean and peak centerline Cpe values, shown in Figure 31 and Figure 32 differ from the base 4L4L2H case in a few ways and the presence of the obstruction is certainly noticeable. The highest peak and mean Cpe values occur when the large obstruction is in
0.0 0.1 0.2 0.3 0.4 0.5 0.6 0.7 0.8 0.9 1.0
0 0.1 0.2 0.3 0.4 0.5 0.6 0.7 0.8 0.9 1
Ai r-Pe rm eab ili ty Fac to r
Normalized Building Depth
40
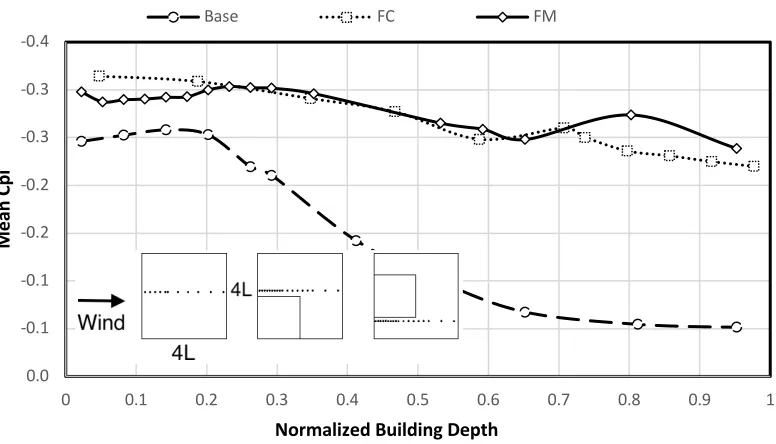
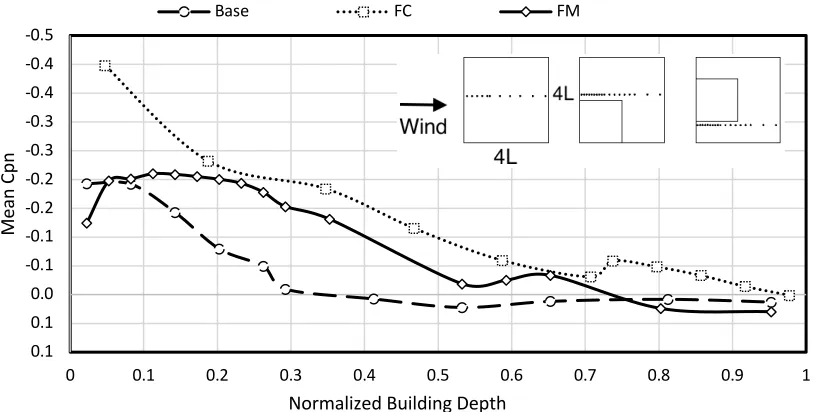
the FC, or Front Corner, position. The FM, or Front Middle, position also causes larger magnitude Cpe values than the base case, but they are not quite as high as the FC case. This is likely due to the fact that the wind splits to go around the FM obstruction whereas in the FC case a more coherent separation vortex can be formed. The internal pressure distributions for both the FC and the FM configurations are very similar, as shown in Figure 33 and Figure 34. They are both consistently flat over the entire depth of the building, whereas the base case has a clear trend toward zero. Due to the flat distribution of the internal pressures, the mean and peak Cpn values for the obstructed cases, shown in Figure 35 and Figure 36 follow a similar trend to the mean and peak Cpe values. The FC case still has the largest magnitude Cpn values, followed by the FM case, and then the base case.
Figure 31. External mean centerline pressures for configurations with large obstructions
-0.8
-0.7
-0.6
-0.5
-0.4
-0.3
-0.2
-0.1
0.0
0 0.1 0.2 0.3 0.4 0.5 0.6 0.7 0.8 0.9 1
Me
an
C
pe
Normalized Building Depth
Figure 32. External peak centerline pressures for configurations with large obstructions
Figure 33. Internal mean centerline pressures for configurations with large obstructions
-7.0
-6.0
-5.0
-4.0
-3.0
-2.0
-1.0
0.0
0 0.1 0.2 0.3 0.4 0.5 0.6 0.7 0.8 0.9 1
Pe
ak
Cp
e
Normalized Building Depth
Base FC FM
-0.4
-0.3
-0.3
-0.2
-0.2
-0.1
-0.1
0.0
0 0.1 0.2 0.3 0.4 0.5 0.6 0.7 0.8 0.9 1
Me
an
C
pi
Normalized Building Depth
42
Figure 34. Internal peak centerline pressures for configurations with large obstructions
Figure 35. Mean net centerline pressures for configurations with large obstructions
-1.8 -1.6 -1.4 -1.2 -1.0 -0.8 -0.6 -0.4 -0.2 0.0
0 0.1 0.2 0.3 0.4 0.5 0.6 0.7 0.8 0.9 1
Pea
k
Cp
i
Normalized Building Depth
Base FC FM
-0.5 -0.4 -0.4 -0.3 -0.3 -0.2 -0.2 -0.1 -0.1 0.0 0.1 0.1
0 0.1 0.2 0.3 0.4 0.5 0.6 0.7 0.8 0.9 1
Me
an
C
pn
Normalized Building Depth
Figure 36. Peak net centerline pressures for configurations with large obstructions
3.7 Effect of Paver-size to Building-size Ratio
The air-permeability factor (APF), previously defined above and by Birhane et al., (2019, submitted) is the ratio of the peak measured net pressure at a location to the corresponding measured external pressure at that location at the same instant. The APF is a measure of how well the external pressure acting on the roof pavers is equalized by the system when it is subject to its highest net load. This value is highly dependent on the paver scale details (Bienkiewicz and Sun, 1992, 1997; Stenabaugh et al. 2015; Birhane et al. 2017). Partly due to the geometry of the system tested, this study reports higher magnitudes of APF values than previous studies. The focus of this study, however, is not the magnitude of the APF values for various cases, but rather the variation of the APF
values between different building and obstruction configurations. The APF values were calculated over the area of ASCE 7-16 roof zone 3. This zone was chosen because it is where the most critical uplift pressures occur. However, when the area of the uplift resisting system was larger than the roof zone, APF values outside of zone 3 were included in the calculation.
-5.0 -4.5 -4.0 -3.5 -3.0 -2.5 -2.0 -1.5 -1.0 -0.5 0.0
0 0.1 0.2 0.3 0.4 0.5 0.6 0.7 0.8 0.9 1
Pea
k
Cp
n
Normalized Building Depth
44
The APF plots shown in Figure 37 and Figure 38 show the trends in APF that occur as the different building scale parameters change. The APF values are plotted against the System L to Building L ratio and the base configuration at four different heights is plotted (Figure 37) and the 2H small obstruction configurations are plotted (Figure 38). In the 0.01 case, the APF values don’t change very much based on the plan aspect ratio of the building. For the system studied, it appears that the APF in zone 3 is typically around 0.9-0.95. This value remains fairly constant until the roof paver system L to building L ratio gets to between 0.4-0.8, with lower building heights dropping off faster because of their reduced zone 3 size. Then, the APF values begin to creep up as they are averaged over larger area. This is due to the separated flow reattaching to the building and causing the cavity pressure to turn positive, meaning that it increases, rather than decreases, the net load on the roof paver system. The 2H small obstructed configuration (Figure 38) has APF values that do not drop off as much with area averaging as the base configurations do. It is most clear by looking at the 0.1 system to building L ratio. For the base configurations, the highest APF value is around 0.84. For the 2H small obstruction configurations, the highest APF value is around 0.95.
Figure 37. Zone 3 APF values for 2.67L4L configurations
0.0 0.2 0.4 0.6 0.8 1.0 1.2
0.01 0.1 1
AP
F
System L/Building L
Figure 38. Zone 3 APF values for 2H small obstructed configurations
GCp values are used in ASCE 7-16 to calculate component and cladding pressures. The APF plots show how well the system equalizes external pressure, and the GCp values show how that equalization capability translates into actual loading on the pavers. Unlike the Cpe, Cpi, and Cpn values discussed above, GCp values are calculated based on 3-second gust speed. Thus, peak Cpn values for each configuration were changed to their corresponding 3-second gust magnitudes by the process described in St. Pierre et al (2006). In each figure below, the maximum magnitude ASCE 7-16 zone 3 GCp values were calculated for paver system sizes ranging from 1-100% of the length of the building. At each paver size, the maximum zone 3 GCp values were calculated for 0, 15, 30, 45, 60, 75, and 90 degree angles of attack. This is then used to create an envelope of the largest magnitude values. A trend that can be seen in the GCp plots shown in Figure 39 is the decrease in spread between GCp values as the values get averaged over larger and larger areas. It is shown that not only does the magnitude of GCp values change as the paver-size to building-size ratio changes, the spread between worst and best angle of attack changes as well. The effect of the presence of the small obstruction on the GCp
values is shown in Figure 40 below. For this configuration, the presence of the obstruction does not appear to change the magnitude of the GCp values significantly compared to the base case. It does, however, delay the effect of area averaging until the
0.0 0.2 0.4 0.6 0.8 1.0 1.2
0.01 0.1 1
AP
F
System L/Building L
46
roof paver system has a larger size relative to the building. In the base configuration, the peak GCp values begin to decrease after the 0.02 system to building ratio. In the obstructed cases, the drop off doesn’t occur until between a 0.08 to 0.12 system to building ratio.
Figure 39. Zone 3 GCp values for 2.67L4L configurations
Figure 40. Zone 3 GCp values for 2H small obstructed configurations
-4.0
-3.5 -3.0
-2.5
-2.0 -1.5
-1.0 -0.5
0.0
0.01 0.1 1
GC
p
System L/Building L
6H 4H 2H 1H
-4.0
-3.5
-3.0
-2.5
-2.0 -1.5
-1.0 -0.5
0.0
0.01 0.1 1
GC
p
System L/Building L
The most visible effect shown in the APF and GCp figures above is the effect of area averaging. As the size of the paver system increases, the magnitude of the maximum APF
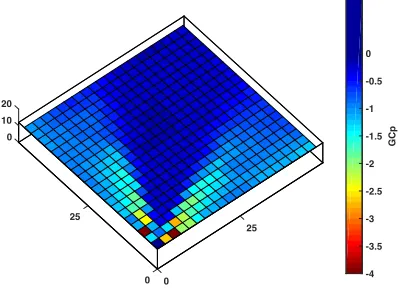
and GCp values decrease. This is due to the diminishing correlation between values as the distance between them increases. Thus, the largest magnitude values are combined with lower values to decrease the average intensity acting over the area. This effect is important to remember during large scale testing of roof pavers. In many of those tests, the paver system length is greater than 10% of the length of the building. As shown in the figures above, this results in paver GCp values that are lower than would be experienced when the paver system is smaller relative to the building size. These lower GCp values are not only attributed to pressure equalization but to area averaging as well. Thus, reduction factors based on those studies should be calculated based on either area averaged external and net pressures or point external and net pressures, not a combination of both. The effect of roof paver system size to building size is clearly shown for the 4L4L2H case in Figure 41, Figure 42, Figure 43, Figure 44, Figure 45, and Figure 46 below. As the roof paver uplift resisting system size becomes a larger proportion of the building size, the peak uplift magnitudes on the system decrease.
Figure 41. Peak GCp value distribution for System L / Building L = 0.01
0 10 20
25
25
0 0 -4
-3.5 -3 -2.5 -2 -1.5 -1 -0.5 0
48
Figure 42. Peak GCp value distribution for System L / Building L = 0.025
Figure 43. Peak GCp value distribution for System L / Building L = 0.05
Figure 44. Peak GCp value distribution for System L / Building L = 0.1
0 10 20
25
25
0 0 -4
-3.5 -3 -2.5 -2 -1.5 -1 -0.5 0 GCp 0 10 20 25 25
0 0 -4
-3.5 -3 -2.5 -2 -1.5 -1 -0.5 0 GCp 0 10 20 25 25
0 0 -4
Figure 45. Peak GCp value distribution for System L / Building L = 0.2
Figure 46. Peak GCp value distribution for System L / Building L = 0.33
0 10 20
25
25
0 0 -4
-3.5 -3 -2.5 -2 -1.5 -1 -0.5 0
GCp
0 10 20
25
25
0 0 -4
-3.5 -3 -2.5 -2 -1.5 -1 -0.5 0
50
Chapter 4
4
Conclusion
This study investigated the effect of building scale parameters on the air-permeability factor of a roof paver system. The base building model was configured for four plan aspect ratios at each of four heights. Then, a small-scale obstruction was added at three different locations to two of the base configurations. Following that, a large obstruction was attached to the building at two different locations to one base configuration. The results of the tests have been discussed above and are summarized below.
The air permeability of a system was clearly shown in the centerline and area averaged plots to increase as the height of a given building with consistent plan dimensions increased. When the frontal area of a building changes, the air permeability of a roof paver system is similar at the leading edge, but as the flow reattaches to the buildings with smaller widths it creates positive internal pressure that results in APF values that are greater than 1. Changing the afterbody length of a building does not appear to affect the
APF values along its centerline. However, as shown in the area averaged APF curves, decreasing the building height and increasing the aspect ratio of the building do seem to result in worse pressure equalization in the system. As well, this decrease of pressure equalization does not result in larger GCp values due to smaller separation vortices created by the smaller building.
This study also shows the importance of the paver size to roof size ratio and how the magnitude of GCp and APF values will change based on that ratio. When a paver is small relative to the separation vortex created by the building, the paver experiences a uniform uplift pressure. This results in higher APF and GCp values because there is no reduction due to area averaging. Therefore, this parameter is one that should be included in future large-scale studies, so that the results can be compared better to each other.
The current study is limited by the 3d printer’s ability to recreate the scaled proportions of the roof paver system. The system is an adequate but imperfect representation of the target roof paver system. Also, although the roof paver system was shown to be a reasonable match for the target roof paver system, it may not be representative of other roof paver systems. If a roof paver system with different paver-scale parameters (Gap width, cavity height, thickness) is to be used, further research may be necessary. This study is also limited by the number of building configurations that were tested. While the 24 configurations are a significant number, they do not capture every possible roof configuration.
52
References
ASCE/SEI 7-16 (2016). Minimum design loads for buildings and structures. Reston, Virginia, American Society of Civil Engineers. ASCE/SEI 7.
Aly, A.M., Bitsuamlak, G.T., Chowdhury, A.G. (2012). Full-scale aerodynamic testing of a loose concrete roof paver system. Engineering Structures, 44:260–270.
Aly, A. M., & Bitsuamlak, G. (2013). Aerodynamics of ground-mounted solar panels: test model scale effects. Journal of Wind Engineering and Industrial Aerodynamics, 123, 250-260.
Asghari Mooneghi, M., Irwin, P., Chowdhury, A.G. (2014). Large-scale testing on wind uplift of roof pavers. Journal of Wind Engineering and Industrial Aerodynamics, 128:22-36.
Bienkiewicz, B., Sun, Y. 1992. Wind-tunnel study of wind loading on loose-laid roofing system. Journal of Wind Engineering and Industrial Aerodynamics, 43:1817–1828.
54
Bienkiewicz, B., & Endo, M. (2009). Wind considerations for loose-laid and photovoltaic roofing systems. In 2009 Structures Congress-Don't Mess with Structural Engineers: Expanding Our Role (pp. 2578-2587).
Birhane, T.H., Bitsuamlak, G.T., Kahsay, M., and Demsis, A.Air permeability factors for evaluating wind load on roof pavers. Journal of Structural Engineering (submitted)
Bofah, K.K., Gerhardt, H.J., Kramer, C. (1996). Calculations of pressure equilibration underneath loose-laid, flow permeable roof insulation boards. Journal of Wind
Engineering and Industrial Aerodynamics, 59: 23–37.
BRE, (1985). Stability under wind load of loose-laid external roof insulation boards, Building Research Establishment Digest 295, Building Research Station, Garston, Watford, UK.
Cheung, J.C.K. and Melbourne,W.H. (1988). Wind loading on a porous roof. Journal of
Wind Engineering and Industrial Aerodynamics, 29:19-29.
Gerhardt, H.J., Kramer, C., Bofah, K.K. (1990). Wind loading on loosely laid pavers and insulation boards for flat roofs. Journal of Wind Engineering and Industrial
Aerodynamics,36 (Part 1), 309–318.
Kind, R. J., Savage, M. G., & Wardlaw, R. L. (1988). Prediction of wind-induced failure of loose laid roof cladding systems. Journal of Wind Engineering and Industrial Aerodynamics, 29(1-3), 29-37.
Kopp, G. A., Farquhar, S., & Morrison, M. J. (2012). Aerodynamic mechanisms for wind loads on tilted, roof-mounted, solar arrays. Journal of Wind Engineering and Industrial Aerodynamics, 111, 40-52.
Kopp, G.A. (2013). Wind loads on low-profile, tilted, solar arrays placed on large, flat, low-rise building roofs. Journal of Structural Engineering, 140.
Morrison, M. J., and Cope, A. D. "Wind performance and evaluation methods of multi-layered wall assemblies." Proc., Structures Congress 2015, 2735-2748.
Oh, J. H., and Kopp, G. A. (2014). "Modelling of spatially and temporally-varying cavity pressures in air permeable, double-layer roof systems." Building and Environment, 82, 135-150.
56
Okada, H. and Okabe, M. (1991). Wind tunnel tests to determine the wind forces on roof blocks for existing buildings. Journal of Wind Engineering and Industrial Aerodynamics, 38:393-403.
Pratt, R. N., & Kopp, G. A. (2013). Velocity measurements around low-profile, tilted, solar arrays mounted on large flat-roofs, for wall normal wind directions. Journal of Wind Engineering and Industrial Aerodynamics, 123, 226-238.
Sadek, F. and Simiu, E. (2002). Peak non-Gaussian wind effects for database-assisted low-rise building design. Journal of Engineering Mechanics, 128(5), 530-539.
Simiu, E. and R. H. Scanlan. (1996). Wind effects on structures: fundamentals and applications to design, John Wiley.
Pierre, L. S., Kopp, G. A., Surry, D., & Ho, T. C. E. (2005). The UWO contribution to the NIST aerodynamic database for wind loads on low buildings: Part 2. Comparison of data with wind load provisions. Journal of Wind Engineering and Industrial Aerodynamics, 93(1), 31-59.
58
Appendix A
Figure A - 2 GCp envelope of 0-90 AOA for 1:2 aspect ratio configurations at various heights
60
Figure A - 4 APF envelope of 0-90 AOA for 1:1.5 aspect ratio configurations at various heights
Figure A - 6 APF envelope of 0-90 AOA for 1:4 aspect ratio configurations at various heights
Figure A - 7 External mean centerline pressure distribution for 1:1 plan aspect ratio building with varying heights
-1.2
-1.0
-0.8
-0.6
-0.4
-0.2
0.0
0 0.2 0.4 0.6 0.8 1
Me
an
C
pe
Normalized Building Depth
62
Figure A - 8 External peak centerline pressure distribution for 1:1 plan aspect ratio building with varying heights
Figure A - 9 Internal mean centerline pressure distribution for 1:1 plan aspect ratio building with varying height
-4.0 -3.5 -3.0 -2.5 -2.0 -1.5 -1.0 -0.5 0.0
0 0.1 0.2 0.3 0.4 0.5 0.6 0.7 0.8 0.9 1
Pe
ak
Cp
e
Normalized Building Depth
6H 4H 2H 1H
-0.9 -0.8 -0.7 -0.6 -0.5 -0.4 -0.3 -0.2 -0.1 0.0
0 0.1 0.2 0.3 0.4 0.5 0.6 0.7 0.8 0.9 1
Me
an
C
pi
Normalized Building Depth
Figure A - 10 Internal peak centerline pressure distribution for 1:1 plan aspect ratio building with varying heights
-1.8
-1.6
-1.4
-1.2
-1.0
-0.8
-0.6
-0.4
-0.2
0.0
0 0.1 0.2 0.3 0.4 0.5 0.6 0.7 0.8 0.9 1
Pe
ak
Cp
i
Normalized Building Depth
64
Figure A - 11 Net mean centerline pressure distribution for 1:1 plan aspect ratio building with varying heights
Figure A - 12 Net peak centerline pressure distribution for 1:1 plan aspect ratio building with varying heights
-0.8 -0.7 -0.6 -0.5 -0.4 -0.3 -0.2 -0.1 0.0 0.1 0.2
0 0.1 0.2 0.3 0.4 0.5 0.6 0.7 0.8 0.9 1
Me
an
C
pn
Normalized Building Depth
6H 4H 2H 1H
-3.5 -3.0 -2.5 -2.0 -1.5 -1.0 -0.5 0.0
0 0.1 0.2 0.3 0.4 0.5 0.6 0.7 0.8 0.9 1
Pe
ak
Cp
n
Normalized Building Depth
Figure A - 13 External centerline mean pressure distribution for configurations with varying windward face area
Figure A - 14 External centerline peak pressure distribution for configurations with varying windward face area
-1.2
-1.0
-0.8
-0.6
-0.4
-0.2
0.0
0.2
0 0.1 0.2 0.3 0.4 0.5 0.6 0.7 0.8 0.9 1
Me
an
C
pe
Normalized Building Depth
4L 2.67L 2L 1L
-3.5
-3.0
-2.5
-2.0
-1.5
-1.0
-0.5
0.0
0 0.1 0.2 0.3 0.4 0.5 0.6 0.7 0.8 0.9 1
Pe
ak
Cp
e
Normalized Building Depth
66
Figure A - 15 Internal centerline mean pressure distribution for configurations with varying windward face area
Figure A - 16 Internal centerline peak pressure distribution for configurations with varying windward face area
-0.8 -0.6 -0.4 -0.2 0.0 0.2 0.4 0.6
0 0.1 0.2 0.3 0.4 0.5 0.6 0.7 0.8 0.9 1
Me
an
C
pi
Normalized Building Depth
4L 2.67L 2L 1L
-1.4 -1.2 -1.0 -0.8 -0.6 -0.4 -0.2 0.0 0.2 0.4
0 0.1 0.2 0.3 0.4 0.5 0.6 0.7 0.8 0.9 1
Pe
ak
Cp
i
Normalized Building Depth