International Journal of Nephrology and Renovascular Disease
Dove
press
O R I g I N A L R e s e A R c h
open access to scientific and medical research
Open Access Full Text Article
Functionally induced changes in water transport
in the proximal tubule segment of rat kidneys
Poul Faarup1
Niels-henrik holstein-Rathlou1
Tove Nørgaard2
Adrian Paul harrison3
Lone Bastholm1
Lisbeth Thatt1
Flemming F Johansen1
Viktor hegedüs1 1Department of Biomedical sciences, Panum Institute University of copenhagen, 2Department of Pathology, hillerød hospital, 3Department of Animal and Veterinary Basic sciences, Faculty of Life sciences, copenhagen University, Denmark
correspondence: Adrian harrison section for Biochemistry, Physiology, and Nutrition, Department of Animal and Veterinary Basic sciences, Faculty of Life sciences, University of copenhagen,
grønnegaardsvej 7, 1870 Frederiksberg c, Denmark
Tel +45 3533 2568 Fax +45 3533 2525 email adh@life.ku.dk
Abstract: To eliminate freezing artifacts in the proximal tubule cells, two cryotechniques were applied to normal rat kidneys, ie, freeze substitution and special freeze drying. In addition, salt depletion and salt loading were applied to groups of rats to evaluate whether the segmental structure of the proximal tubule could be altered. In the superficial part of the renal cortex of normal kidneys, the typical first segment structure in the proximal tubule was generally present in the early postglomerular fraction of the tubule. However, in the second segment, a special cellular phenomenon was constantly present, comprising a significant intercellular space that was easily identified using a light microscope. In the third segment, in which the presence of basolateral interdigitations is minimal, the small lateral space, which was found to be present in cryopreparations between neighboring cells from the normal kidney, was found to be enlarged by heavy salt loading of short duration. It is concluded that these cryotechniques demonstrate quantitative structural variations between superficial and deep nephrons, as well as the pres-ence of extracellular areas between the cells of the second and the third segment, representing a structural background for the essential transport of water from the proximal tubules to the peritubular capillaries.
Keywords: proximal tubule, salt load, salt depletion
Introduction
Since the identification of the segmental structure of the renal proximal tubule approxi-mately 40 years ago,1 only a few reports have documented the consequences associated
with histological variability of these structures with regard to their functional activity. In particular, very little is known about essential transcellular water transport occurring in this part of the nephron.
It is well known that any chance of studying the mechanism of fluid transport in or among cells in the kidney may be significantly obstructed or affected by, eg, rapid postmortem changes, fixative-induced structural alterations, or perturbations caused by instrumental devices. Even the smallest of structural changes can be of significance when investigating the functional structure of a tissue, particularly when such elucida-tion is with the aid of a microscope. The identificaelucida-tion of water-selective aquaporin channels in the proximal tubules of the kidney2–4 serves as an example of results based
on unorthodox technical methodology. It is for this reason that a more appropriate cryotechnology approach needs to be sought and used in an attempt to minimize early postmortem artifacts5,6 and the inevitable fixation-induced changes that occur in terms
of cellular morphological details.7
International Journal of Nephrology and Renovascular Disease downloaded from https://www.dovepress.com/ by 118.70.13.36 on 23-Aug-2020
For personal use only.
Number of times this article has been viewed
Dovepress
Faarup et al
Both structural and functional differences are known to exist between S1 and S2 cell types in the proximal tubule of the kidney. Most notably, the reabsorption of glucose from the tubular fluid mainly occurs in S1 cells, where more than 90% of the glucose present in the lumen is reabsorbed.8
In a similar fashion, glucose, galactose, and amino acids accumulate in an osmotically active form within the small intestinal cells during reabsorption from the ileum, and this is accompanied by an increase in water content and swelling.9–11
This then forms a parallel with the S1-like cells of the proxi-mal tubule. Another difference that exists between the initial and the final fraction of the convoluted proximal tubule is the presence of a countercurrent system, which is found between the convoluted proximal tubule and the peritubular capillaries.12–14 In this way, the oncotic pressure in the
peri-tubular capillaries is highest at the second segment, which is important for the transmural transport of water.4
It was the aim of this study to refine and apply a more appropriate cryotechnology approach to the investigation of the renal proximal tubule structure, and to use this technique subsequently to investigate the varied structural character-istics of superficial and deep nephrons, as well as those of the first, second, and third tubular segments, arising in part from changes in salt loading. Particular emphasis is placed on the structural effects associated with high-speed cellular water transport in the rat kidney.
Methods
Our experiments were conducted in accordance with the ethical guidelines of the Animal Behavior Society and national legislation, and complied with previously published standards and advice.15
Normal rats
Eight male Wistar rats (200–250 g body weight) were allowed free access to distilled water and standard food (Altromin standard rat diet C-1035, Brogaarden, Denmark) containing 0.9% NaCl (dry weight). The urine was analyzed routinely at the end of each experiment using a standard urine strip (Multistix 10 SG, Bayer Diagnostics, Bridgend, UK), and no signs of proteinuria or blood in the urine were noted. On this basis, no ischemic lesions were deemed to be present. Animals were anesthetized intraperitoneally using sodium barbiturate 35 mg/kg body weight with a reflex test to assess that an ade-quate level of anesthesia had been attained. The right kidney of each rat was then rapidly removed and frozen in isopentane cooled by liquid nitrogen to −165°C. The frozen kidneys were subsequently divided into two groups, each comprising four
kidneys. The animals were then humanely killed by an over-dose of anesthetic followed by neck dislocation.
group 1A
The right kidneys from four rats were freeze substituted in ethyl alcohol at −20°C for 4 weeks, and thereafter transferred to 4% paraformaldehyde for fixation at room temperature for 24 hours before finally being conventionally embedded in paraffin.5,7 Sections measuring 3–5 µm in thickness were
periodic acid Schiff (PAS) stained. Part of the kidney cortex was then embedded in araldite. Semithin sections of 0.5–1.0 µm in thickness were stained with toluidine blue. Because this fixation procedure is not suitable for electron microscopy, an ultrastructural investigation was not performed.
group 1B
In four rats, 1.0 mL of a 1% solution of methylene blue in physiological saline was injected intravenously 1 second prior to the rapid removal and freezing of the right kidney. Frozen sections, 5 µm in thickness, were freeze dried for 24 hours in a desiccator containing phosphorus pentoxide at −20°C.7 Thereafter, the sections were mounted in paraffin
oil, thereby omitting fixation, contamination with water, and mounting chemicals (eg, xylene and mounting medium).
salt-depleted or salt-loaded rats
A different NaCl diet was allocated to a total of 24 male Wistar rats (200–250 g body weight) as follows.
group 2A
Four rats received a diet containing 0.1% (dry weight) NaCl (Altromin C-1036, Brogaarden, Denmark) and distilled water for 4 weeks. The animals were anesthetized intraperitoneally using sodium barbiturate 35 mg/kg body weight with a reflex test to determine that an adequate level of anesthesia had been attained. Thereafter, the right kidneys were freeze substituted and pre-pared as described previously. The animals were humanely killed by an overdose of anesthetic followed by neck dislocation.
group 2B
Four rats received a diet containing 5% (dry weight) NaCl (Altromin C-1051, Brogaarden, Denmark) and distilled water for 4 weeks. The animals were anesthetized intraperitoneally using sodium barbiturate 35 mg/kg body weight with a reflex test to assess that an adequate level of anesthesia had been attained. Thereafter, the right kidneys were freeze substituted as described previously. The animals were humanely killed by an overdose of anesthetic followed by neck dislocation.
International Journal of Nephrology and Renovascular Disease downloaded from https://www.dovepress.com/ by 118.70.13.36 on 23-Aug-2020
Dovepress Proximal tubular segmentation
groups 2c–F
All animals in Groups 2C, 2D, 2E, and 2F were prepared as follows. After intraperitoneal anesthesia with inactin 100 mg/kg body weight, the rats were placed on a temperature-regulated table for the duration of the experiment, and a regular reflex test was performed to assess that an adequate level of anes-thesia was being maintained. For each animal, a solution of 0.5 g NaCl in 3 mL of distilled water (2.85 M) was infused over a period of an hour via the femoral vein.
In four rats, the right kidney was freeze substituted immediately after the infusion of the 2.85 M NaCl solution (Group 2C). Groups 2D, 2E, and 2F comprised the controls and included four rats each, which were treated in the same manner as the animals in Group 2C. The right kidneys were removed after the intravenous infusion as follows: Group 2D after 48 hours; Group 2E after 2 weeks; and Group 2F after 4 weeks. The animals were humanely killed by means of an overdose of anesthetic followed by neck dislocation.
Tissue preparation and evaluation
After freeze substitution and PAS staining of the histological sections, Groups 1A and 2A–2F were investigated quantita-tively as follows. The immediate postglomerular fraction of the proximal convoluted tubule (minimal length twice that of the tubular diameter) was photographed for both superficial and juxtamedullary nephrons. On average, 15 randomly chosen nephrons from each location (superficial versus juxtamedullary) in each individual kidney were investigated. The appearance of the immediate postglomerular fraction was classified according to the following three arbitrary groupings:
• For fractions presenting with a typical cellular structure comprising high brush borders, tall cells, and a reduced luminal diameter of the tubule, as previously described,1
the term S1 was assigned.
• For fractions presenting with a mixture of cells com-prising typical S1 cells intermingled with cells having structural characteristics typical of the second segment, the term S1–2 was assigned.
• For fractions presenting with cells with a low brush border, a low cellular height in tubules, and an enlarged luminal diameter, the term S2 was assigned. These cells systematically contained light microscopically identifiable basolateral spaces between the cellular interdigitations. Otherwise, the cellular structure was identical to that of S2, as described elsewhere.1
The quantitative evaluation according to this classifica-tion was made by two of the investigators (TN and VH)
independently of each other and in a blinded fashion. The results were compared and analyzed for statistical significance by a third investigator (NHHR).
A similar procedure was applied for evaluation of the tubular segmental loops S1, S1–2, and S2, in the total renal cortex. In each kidney, 15 randomly chosen superficial and juxtamedullary cortical areas, each covering an area of 0.3 × 0.2 mm, respectively, were photographed to enable further quantitative evaluation of the loops of the proximal convoluted tubule.
In addition, a description of the structure of the third segment cells (S3) was given, because they took on a special appearance depending on the preparations used. Tissue from the contralateral kidney, lungs, liver, and spleen were taken from each rat and were conventionally prepared for micros-copy analysis in order to ensure the absence of irrelevant pathological changes.
statistical analysis
Data, which were normally distributed and of equal variance, are presented as mean ± standard error of the mean. Statistical evaluation of the observations was made using an analysis of variance for repeated measurements. Where significant differences between the means were indicated, the individual means were compared using a Newman–Keuls test. A P value of less than 0.05 was considered statistically significant.
Results
general appearance of proximal
tubule in normal kidneys
The cellular structure of the proximal tubule in the cryo-preparations of normal kidneys was consistently different from the morphology seen in similar specimens, for which no cryotechnique was employed during tissue preparation. In S1, represented by the immediate postglomerular tubu-lar neck region, the tall cells, with a high brush border and a small tubular lumen, were present preferentially in the superficially located nephrons (see later parts of this section concerning the quantitative evaluation of cell types in the differently located nephrons, and Figures 1 and 2). However, in the juxtamedullary nephrons, S2-like tubular cells replaced the typical S1 cellular structure in the postglomerular neck region. Moreover, it is essential to note here that the structure of the segmentally iden-tical tubular cells should be similar for the two types of cryopreparations applied, ie, the freeze-substitution technique, compared with the freeze-drying technique (Figures 1–3).
International Journal of Nephrology and Renovascular Disease downloaded from https://www.dovepress.com/ by 118.70.13.36 on 23-Aug-2020
Dovepress
Faarup et al
S
2S
2S
2S
2S
1C
C
D
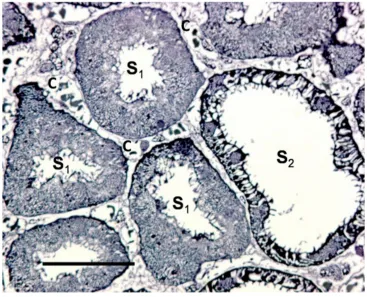
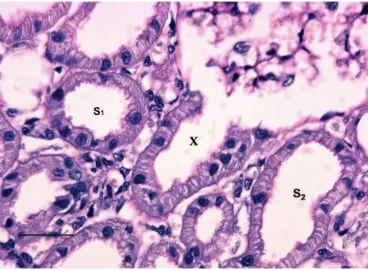
Figure 1 A PAS-stained, freeze-substituted normal kidney, showing the superficial cortex.
Notes: Please note that in the initial fraction of the S1 segment starting from the glomerulus the cytoplasm of the S1 cells has a finely granular cytoplasm, lacking a radial striation, which is typical for s1 cells. In these tall cells the nuclei are round and the brush border is high. In the s2 segment loops the cells are shorter, however, there is variation in cellular height in the different loops (see arrows). The cells also have a reduced height of the brush border. In all s2 segments the radial cytoplasmic striation demonstrates dilated, basolateral spaces (cf. Figure 2 and 3). contrary to the round nuclei of s1 cells, here the nuclei may appear gear-wheel like, apparently a phenomenon secondary to the dilated basolateral spaces (see double arrow). Around the glomerulus a capsular space can be seen, this is always found with optimal cryo-preparations of normal kidneys. D represents the distal tubule, c denotes a capillary. The scale bar represents 25 μm.
Figure 2 A freeze-substituted normal kidney, showing the superficial cortex.
Notes: Please note in this toluidin blue stained, semi-thin specimen from plastic-embedded tissue, the typical differences between the s1 and s2 cells concerning diameter of the lumen and cellular height as well as the very dilated basolateral spaces between the s2 cells. c denotes a capillary.
International Journal of Nephrology and Renovascular Disease downloaded from https://www.dovepress.com/ by 118.70.13.36 on 23-Aug-2020
Dovepress Proximal tubular segmentation
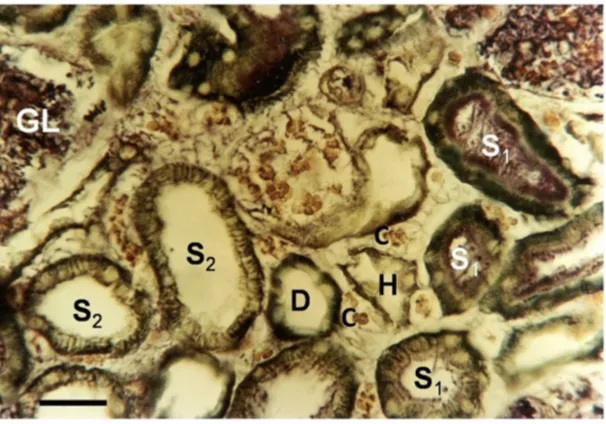
Figure 3 A freeze-dried normal kidney, vitally stained using methylene blue revealing the superficial cortex.
Notes: The lumen of some S1 segments were stained by the intravenously injected methylene blue, which filtered through the glomerulus, whereas other S1 loops and later tubular fractions of the nephrons do not contain any stain in the lumen. Their tissue is only stained from the capillary side. Only in the s2 segments can a radial, cytoplasmic striation be seen, demonstrating a space between the basolateral membranes among s2 cells in the functioning kidney. The nuclei of the tubular cells are unstained in this preparation. D represents the distal tubule, gL denotes the glomerulus and h indicates the ascending branch of the loop of henle, c denotes a capillary The scale bar represents 25 μm.
Figure 2B An enlarged region of Figure 2a. Please note the net-like structure in the nuclear content connecting the nucleolus to the nuclear membrane of the s1 cell (see arrows). The scale bar represents 25 μm.
The most important structural difference found in both types of cryopreparations was the consistent presence of an essential extracellular space between the basolateral membranes of typical S2-like cells of the proximal con-voluted tubule. Although the cell nuclei of the S1 and S3 cells were always oval or circular in shape, the S2 cell
nuclei were frequently angular in appearance, presumably as a consequence of the dilated intercellular space found between the S2 cells (Figures 1, 2, and 4). In the nuclei of the proximal tubule, a special structural phenomenon could be observed, most easily seen in S1-like cells. Here, the nuclear content demonstrated a ramified network, typically connect-ing the nucleolus to the nuclear membrane (Figure 2B). A similar nuclear network was sometimes found in the nuclei of the endothelial cells of the peritubular capillaries.
In the proximal tubular loops located in the immediate subcapsular area there was a predominance of S2 seg-ments (Figures 4A and 4B). In this area, S2 tubular cells constituted the dominant part of the proximal tubular loops. However, it was frequently observed that the cells of the S2 tubule lying adjacent to the capsule were lacking the dilated basolateral spaces that were found to exist between the other typical S2 segment cells. In addition to these changes, the immediate subcapsular cells were found to be structurally identical to the usual S2 segment cells in their appearance (low cell height, low brush border). The reverse of these structural phenomena was never observed in this location, and the intercellular space between the S2 cells of the proxi-mal tubule, identifiable at the light microscope level, was always present outside the immediate subcapsular region.
In terms of a quantitative analysis of the cells in the jux-tamedullary region, ie, in the immediate postglomerular neck
International Journal of Nephrology and Renovascular Disease downloaded from https://www.dovepress.com/ by 118.70.13.36 on 23-Aug-2020
Dovepress
Faarup et al
Figure 4 A PAs-stained freeze-substituted normal kidney showing the subcapsular area of the cortex.
Notes: A)The superficial fractions of the S2 segments, placed just beneath the renal capsule (RC) do not possess the usual basolateral spaces, normally seen in S2 segments (see arrows). In this segment, the angularly shaped, or gear-wheel like nuclei can only be seen in areas where the intercellular basolateral space is present. V = a Venole located between two S1 segment loops, the location of which is consistent with the previously described tubulo-vascular counter-current flow in the proximal convoluted tubule (Faarup et al13). Rc denotes the renal capsule. B) A PAs-stained, freeze-substituted kidney showing a s2 tubular loop, located just beneath the renal capsule (Rc).
The fraction of the loop that is in contact with the capsule is lacking a basolateral interstitial space between the cells, although this is to be found both before as well as after the region of capsular contact. Rc denotes the renal capsule. The scale bar represents 25 μm.
A
B
0.0 0.1 0.2 0.3 0.4 0.5 0.6 0.7 0.8 0.9 1.0
–0.1
1A 2A 2B 2C 2D 2E 2F Superficial nephrons Immediate postglomerular
tubular loop counts
A B
0.0 0.1 0.2 0.3 0.4 0.5 0.6 0.7 0.8 0.9 1.0
–0.1
1A 2A 2B 2C 2D 2E 2F Juxtamedullary nephrons Immediate postglomerular
tubular loop counts
TYPE OF LOOP
SEGM
SEGM
SEGM
S1 S1-2
S2
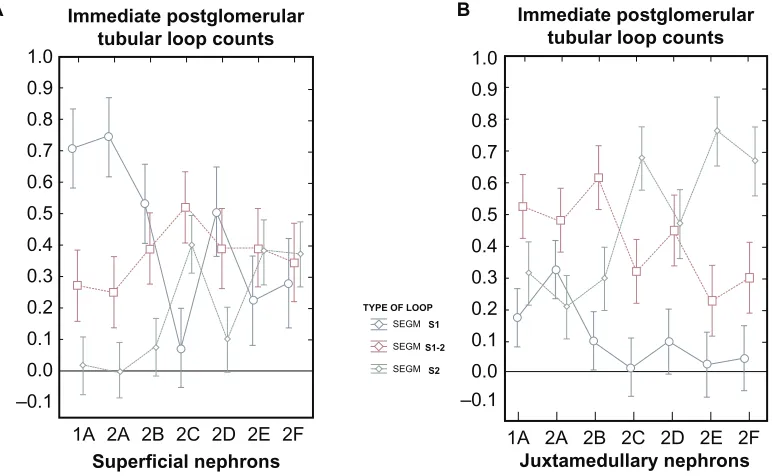
Graph I. Quantitative segmental evaluation of the immediate postglomerular fraction of the proximal convoluted tubule in freeze-substituted tissue from the renal cortex.
Notes: 1A)Among the superficial nephrons from normal kidneys (Group 1A) the number of S1-like cells far exceeds that of the S1-2 like cells, which are themselves significantly more frequent than the S2-like cells. Moderate salt depletion or salt loading over a period of 1 month (Groups 2A and 2B) does not change the distribution significantly. However, a heavy salt loading of short duration (1 hour) (Group 2C) significantly reverses the frequencies of the S1, S1-2 and S2-like cells such that the presence of the S1-like structured cells falls far below the number of S1-2-like and S2-like cells in this part of the tubule. After a temporary, yet significant reversal of the structural changes in the s1- and s2-like structures some 48 hours later, the presence of both s1-, s1-2 and s2-like cells becomes nearly identical (see groups 2D, e and F) 2 days, 2 weeks or 4 weeks after the acute intervention of the heavy salt loading. 1B) In the juxtamedullary located nephrons from freeze substituted normal kidneys the presence of both the s1-like, and the s2-like cells of the immediately postglomerular located fraction of the proximal convoluted tubule were lower in number than the S1-2 like cells (Group 1A). No significant changes were found during moderate salt depletion or salt loading(Groups 2A and B). After a heavy salt loading of short duration (Group 2C) the S1-like cells were nearly totally eliminated, and the S2-like cells were increased in number significantly, to subsequently comprise two thirds of the structure in this region. Interestingly, even 4 weeks later the control group (F) did not show any change in this distribution.
International Journal of Nephrology and Renovascular Disease downloaded from https://www.dovepress.com/ by 118.70.13.36 on 23-Aug-2020
Dovepress Proximal tubular segmentation
–0.2 0.0 0.2 0.4 0.6 0.8 1.0 1.2
1A 2A 2B 2C 2D 2E 2F
Superficial nephrons Total proximal tubular loop counts
A B
–0.2 0.0 0.2 0.4 0.6 0.8 1.0 1.2
1A 2A 2B 2C 2D 2E 2F
Juxtamedullary nephrons Total proximal tubular loop counts
TYPE OF LOOP
SEGM SEGM SEGM
S1
S1-2
S2
Graph 2 The percentage segmental distribution of the total loops from the proximal convoluted tubule of the renal cortex of freeze-substituted kidneys.
Notes: 2A)In the superficially located nephrons of normal kidneys (Group 1A) the S2-like cells in the loops were significantly more frequent than the S1-, and S1-2 like cells, which were found to be equally frequent. Slight salt depletion or salt loading did not change these values significantly (Group 2A and B). However, after a heavy salt loading of short duration (Group 2C) the frequency of S2-like cells was elevated from about 40 % to more than 80 %. In accordance, the number of S1- and S1-2 like cells were reduced to around 10 % of the total. Moreover, even 4 weeks later in the Control (Groups 2F) values were found to return to those seen in normal kidneys (see “normal” - group 1A). 2B) In juxtamedullary located nephrons in freeze-substituted kidneys the normal kidneys (group A) revealed a number of s1-like cells that were slightly lower than those in the superficial nephrons (Graph 2A), otherwise, the distribution was rather similar. No significant changes were found with moderate salt depletion or salt loading (groups 2A and B). however, a heavy salt loading of short duration (group 2c) induced the number of s2-like cells to become clearly elevated in percentage terms. s1-like and s1-2 like cells were concomitantly reduced in proportion. Notably though these structural changes did not normalize, even in the controls up to 4 weeks later (group 2F).
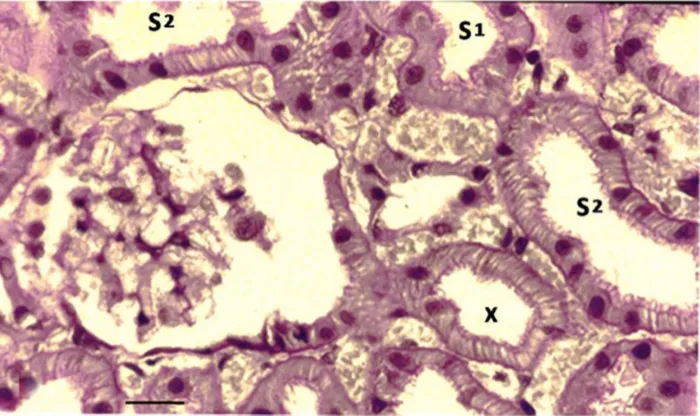
Figure 5. A PAs-stained freeze-substituted normal kidney showing a juxtamedullary nephron.
Notes: The cells in the proximal tubular loop (X), descending from the glomerulus, have a typical s2-like structure. The scale bar represents 25 μm.
region of the normal kidney, the S1 segments were found to be significantly fewer in number than those measured superfi-cially (see Graph 1A compared with Graph 1B, Group 1A). However, a total count of the convoluted proximal tubule showed a difference between superficial and juxtamedul-lary nephrons (significantly lower numbers of S1 segment
loops) for the juxtamedullary nephrons alone (see Graph 2A compared with Graph 2B, Group 1A). In the vitally stained, freeze-dried specimens (free of fixation, water contamina-tion, and embedding media artifact), a similar structure was observed to that of the freeze-substituted specimens with regard to the S1 and S2 loops (Figure 3).
International Journal of Nephrology and Renovascular Disease downloaded from https://www.dovepress.com/ by 118.70.13.36 on 23-Aug-2020
Dovepress
Faarup et al
Kidneys from moderately
salt-depleted rats
In Group 2A, no significant differences were found in the distribution of S1, S1–2, and S2 tubular loops in the kid-neys of salt-depleted rats compared with normal kidkid-neys. This observation was valid in both the superficial and juxtamedullary regions (see Graphs 1A, 1B, 2A, and 2B).
Kidneys from moderately salt-loaded rats
In Group 2B, the quantitative data for segmentation of the proximal convoluted tubules were without significant change when compared with those in Groups 1A (normal rats) and 2A (salt-depleted rats, see Figures 1A, 1B, 2A, and 2B).
Kidneys from acutely heavy
salt-loaded rats and later controls
In Groups 2C–F, when a heavy salt loading of short dura-tion was applied intravenously (Group 2C), the quantitative values for the S1, S1–2, and S2 loop counts were signifi-cantly reversed. Among the superficially located nephrons, the S1-like structures of the initial postglomerular fraction of the proximal tubule were far rarer that the S1–2-like and S2-like cellular structures (see Graph 1A). However, 4 weeks
later, these three types of loops at this specific location were equally prevalent in number. In the juxtamedullary nephrons, S1-like structures from the same region were nearly totally eliminated, being replaced primarily by S2-like structures, which were now found to be in two-thirds of the nephrons (see Graph 2B). However, an identical distribution of the loop structures within the segments was found 4 weeks later.
Overall, in terms of the total count, the number of S1 and S1–2 loops in the superficial nephrons was signifi-cantly decreased after heavy salt loading of short duration (Group 2C). In contrast, the S2 loop counts were found to have increased significantly (see Graph 2A). These values were subsequently found to normalize in the controls 2 days to 4 weeks after the period of salt loading (see Graph 2A, Group 2D–F). With regard to the same values of total loop counts among the juxtamedullary nephrons, a persistent and significant increase in the number of S2 loops was observed with a heavy salt loading of short duration, a change that continued right up until the last control measurement 4 weeks later. Concomitantly, the number of S1 and S1–2 loops was found to decrease (see Graph 2B).
In the S3 segments from normal, freeze-substituted kidneys, a slight extracellular space could be seen between
Figure 6 A PAS-stained freeze-substituted kidney, showing the superficial cortex from a rat that had been exposed to a heavy salt-loading of short duration (Group 2 C). Notes: Pleasenote that the proximal tubular loop, descending from the glomerulus (X) has changed in structure from that of a s1 to a more typical s2-like cell. Note also, that the luminal diameter, the cellular- and brush border height, and the presence of basolateral spaces are somewhat identical to the structure of the surrounding s2 loops. The change in structure from S1 to S2 in the initial postglomerular fraction was more significant among superficial cf. juxtamedullar nephrons (Graph IA and IB). The scale bar represents 25 μm.
International Journal of Nephrology and Renovascular Disease downloaded from https://www.dovepress.com/ by 118.70.13.36 on 23-Aug-2020
Dovepress Proximal tubular segmentation
the lateral cell membranes of some of the S3 cells (see Figure 7). After exposure to an acute heavy salt loading (Group 2C), a systematic and significant dilatation of the lateral intercellular space was noted (see Figure 8). In the later controls (Groups 2D–F) made 2 days, 2 weeks, and 4 weeks following the acute heavy salt loading, this change in cellular structure was found to normalize (see Figure 9).
The contralateral left kidney was removed from all the animals used in this experiment and formalin fixed (neutral formalin 10% over a period of 24 hours) according to tradi-tional methodology. After paraffin embedding, sections were stained with hematoxylin and eosin. None of the changes typical of the cryopreparations for the right kidney, with regard to segmentation of the proximal tubule, appearance of intercellular spaces in fractions of the proximal tubule, or nuclear differences or changes in the cells of the proximal tubule, was noted in the left kidneys fixed using traditional methodology. Independent of treatment, eg, “normal”, “salt-loaded”, or “salt-depleted”, the histology sections from the traditionally fixed left kidneys appeared to be microscopically identical.
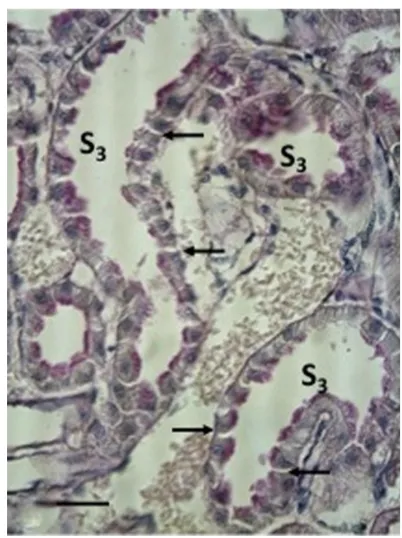
Figure 7 A PAs-stained, freeze-substituted normal kidney (group 1A).
Notes: Pleasenote that in the third segment (s3) of the proximal tubule a few open lateral spaces between the cells can be seen (see arrows). h indicates the ascending branch of the loop of henle. The scale bar represents 25 μm.
Figure 8 A freeze-substituted and PAs-stained kidney investigated immediately after a heavy salt-loading of short duration (group 2c).
Notes: Please note, a systematic and significant dilatation of the lateral spaces between the s3 cells can be seen in this section (see arrows).The scale bar represents 25 μm.
Discussion
The present study, which is based on two different cryo-techniques, makes possible an entirely new evaluation of the structural background underpinning the considerable water transport that occurs between proximal tubular cells and capillaries (Figures 1–5, 7, and 8). The validity of these newly observed structural details is supported by the fact that the two different cryotechniques used, ie, freeze substitution and special freeze drying, demonstrate identical morphology between similar cell types.
The most important finding of our study with regard to normal kidney function has been the observation of a con-sistently open basolateral space between the interdigitating S2 segment cells of the proximal tubule, giving rise to an anastomosing, widely open, extracellular compartment for the transport of water (Figures 1–6). A parallel phenomenon of equal importance is an open lateral space between the cells in the S3 segment (Figure 7). In investigations of the normal rat kidney, in which a cryopreparation was omitted, no dilatation of the basolateral or lateral space between the cells of the proximal tubule was observed.16–19 The essential structural
differences between the three cell types (S1, S2, and S3)
International Journal of Nephrology and Renovascular Disease downloaded from https://www.dovepress.com/ by 118.70.13.36 on 23-Aug-2020
Dovepress
Faarup et al
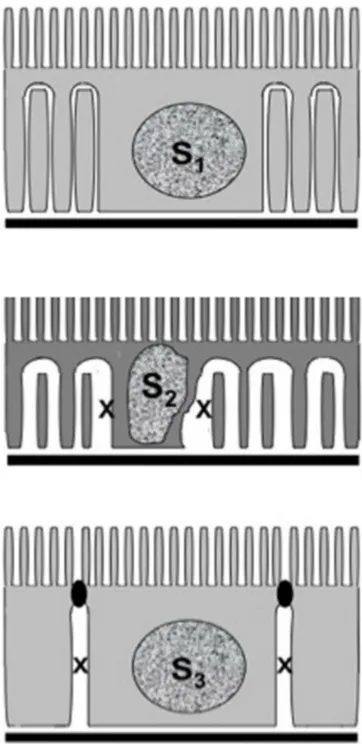
in the proximal tubule, as seen in the cryopreparations of the renal cortex, are illustrated in Figure 10.
The occurrence of intracellular aquaporin channels in the proximal tubular cells,2,3 the endings of which were
found not only at the basal ends of the cells but also laterally near to the basolateral membranes, is an important finding. Consequently, it follows that the basolateral spaces should form part of the transport route for water from the tubular lumen to the capillary. In the normal kidney, these spaces were dilated in the S2 segments of the proximal tubules, and to a lesser degree in the S1–2 and S3 segments. This finding raises the question of whether transcellular water transport is of the same order of magnitude in both the S1 and the S2 segment cells, although, at present, no definite conclusions can be drawn.20 However, the lack of basolateral spaces
identifiable by light microscopy focally in the immediate subcapsular S2 loops (Figure 6) might indicate the functional importance of this structural phenomenon for physiological micropuncture studies at this location.
In the normal rat kidney, the presence of only the typi-cal S1-like cells at the immediate postglomerular region of the proximal tubule is much more frequent in superficial nephrons than in those found in the juxtamedullary nephrons (Graphs 1A, 1B, and 10). However, the opposite is the case
Figure 10 essential structural features distinguishing the three segments of the proximal tubule: Upper: s1; Middle: s2; and Lower: s3. Only in the s2 and s3 segments is an enlargement of the basolateral or lateral space (marked with an X) seen in cryopreparations of the tissue (compared with Figures 2 and 7–9). Figure 9 A freeze-substituted and PAs-stained kidney two days following a heavy
salt loading of short duration (group 2F).
Notes: Please note, that between the s3 cells a lesser degree of dilatation of the lateral space can be found associated with fewer cells compared to Figure 8 (see arrows). h indicates the ascending branch of the loop of henle. The scale bar represents 25 μm.
with regard to the S1–2-like fractions at the same location. Superficially, the presence of only S2 cells initially in the proximal tubular loop is nearly nonexistent, although in the juxtamedullary area 30% of the nephrons are populated solely with the S2 cell type.
The total tubular loop counts for the proximal convoluted tubule in normal kidneys (Graphs 2A and 2B) revealed that the number of S1 loops is significantly greater in superficial nephrons than in those located in the juxtamedullary region. This is parallel to the occurrence of S1 loops found initially in the postglomerular loops from nephrons located superficially versus those in the juxtamedullary region (Graph 1A and 1B). It can be seen from the same figures that a moderate salt load or salt depletion (Groups 2A and 2B) of 1 month’s duration is without significant change initially in the postglomerular loops as well as in the total tubular cell counts (Graph 1A, 1B, 2A, and 2B). However, when a heavy salt loading of short
International Journal of Nephrology and Renovascular Disease downloaded from https://www.dovepress.com/ by 118.70.13.36 on 23-Aug-2020
Dovepress Proximal tubular segmentation
duration was given intravenously over a period of 1 hour, the structure of the tubular cells was seen to change (Group 2C). In the initial postglomerular part of the tubule, the relative proportion of S1-like loops changed from 70% (normal kidneys) to less than 10% in the superficial nephrons. In the nephrons of the juxtamedullary region, values for the same location decreased from 17% to 1%. Correspondingly, sig-nificant increases in the number of S2 loops for the same part of the tubule were observed. A similar significant increase in the number of S2 loops was found in the total tubular loop counts (Graphs 2A and 2B). It is thus concluded that some of the typical S1 loops were changed to S2 loops in the total tubular loop counts. This would mean that S1-like and S2-like cells are mutually exchangeable, depending on the functional physiological milieu to which they are exposed. However, the reason for the structure of the S1 cells, having a reduced lumen and an enlarged cell size, is not definitively understood or indeed explained in the literature.
In the freeze-substituted and freeze-dried kidneys, the structure of the S1 cells was found to be identical (Figures 1 and 3). This was also found to be the case for the structure of S2 cells. This is an especially important point when one considers the presence of the dilated basolateral spaces, which were consistently present among these cells in the normal kidney, independent of the type of cryopreparation. Therefore, it is concluded that the open basolateral space between the S2 cells, as well as the open lateral space seen between S3 cells, represents a functional phenomenon rather than a preparative artifact (Figures 1, 2, 3, and 10).
The glomerular filtration rate in normal kidneys is found to be consistently higher in juxtamedullary nephrons than in the superficial ones.21,22 Thus, returning to the different functional
conditions of S1 cells as compared with S2 cells (eg, glucose transport versus water transport), the higher glomerular filtration rate in the juxtamedullary nephrons may be related to their structural differences.21–23 Indeed, this might explain
why in the normal kidney the total number of S1 plus S1–2 loops in the proximal convoluted tubule was found to be the same in the superficial and juxtamedullary cortical regions (approximately 40%, see Graphs 2A and 2B).
Beyond the sparse vascularization of the S2 loops that are found in the immediate subcapsular region, the peritubular capillaries found inside the renal cortex appear very different from the capsular capillaries. This is very important when one considers the hydrostatic as well as oncotic pressure of plasma. In the renal peritubular cortical capillaries, the hydrostatic blood pressure is about 10–15 mm Hg, whereas the pressure in capillaries outside the kidney is 10–30 mm Hg. Of course
the capsular capillaries generally arise from the lumbar arteries, unlike the peritubular capillaries. Likewise, the oncotic pressure in the peritubular capillaries is in the order of 20–35 mm Hg,24
whereas it is only about 20 mm Hg in the capillaries of the systemic circulation. This serves to highlight the fact that the dominant water transport in the renal cortex is due to reabsorp-tion, in contrast with the typical paracapillary water circulation found in the systemic circulation, as described by Starling.25
Indeed, this reasoning may go a long way toward providing an explanation for the observation that the lack of open basolateral spaces between the cells of immediately subcapsular S2 loops never exceeds more than 50% of the total S2 loops.
If one continues this line of reasoning, it seems logical to conclude that the open basolateral space between S2-like cells is the result of functional conditions not only in the tubule but also in the surrounding peritubular capillaries. Moreover, these cellular changes are probably the cause of the angular form of the nuclei in these cells, because they are never found in typical S1 or S3 cells, where all the nuclei have a circular or oval appearance (Figures 1 and 7).
The application of a heavy intravenous salt load of short duration resulted in what appeared to be a conversion of the vast majority of S1 loops in the immediate postglomerular area from superficial nephrons to S2-like loops (Group 2C, Graphs 1A). This is reflected in the total tubular loop counts where both S1 and S1–2 loops were found to be replaced proportionally with S2-like loops in superficial nephrons, although among the juxtamedullary nephrons only the S1–2 loops showed a significant reduction in number (Graphs 2A and 2B). In both locations, the number of S2-like loops was significantly increased. In order to evaluate the reversibility of these changes, control rats were investigated in which normal feeding was given for a period of 2 days, 2 weeks, and 4 weeks. As can be seen in Graphs 1A and 1B, changes were found to be partly reversible only in the S1 loops of the superficial nephrons. Interestingly, a similar response to nor-mal feeding was not apparent in the juxtamedullary nephrons (see Graphs 2A and 2B). These cellular changes in the super-ficial nephrons may simply reflect a physiological difference between superficial and juxtamedullary nephrons.
The present data clearly demonstrate that typical S1-like and S2-like cellular structures can be reversed, depending on the biological milieu and cellular response. Moreover, the variations in the tubular segmental cell types show that more permanent changes in distribution of the loops can be seen in both the initial postglomerular loops and later fractions of the convoluted proximal tubule (Graphs 1A, 1B, 2A, and 2B).
International Journal of Nephrology and Renovascular Disease downloaded from https://www.dovepress.com/ by 118.70.13.36 on 23-Aug-2020
International Journal of Nephrology and Renovascular Disease
Publish your work in this journal
Submit your manuscript here: http://www.dovepress.com/international-journal-of-nephrology-and-renovascular-disease-journal The International Journal of Nephrology and Renovascular Disease is
an international, peer-reviewed open-access journal focusing on the pathophysiology of the kidney and vascular supply. Epidemiology, screen-ing, diagnosis, and treatment interventions are covered as well as basic science, biochemical and immunological studies. The journal welcomes
original research, clinical studies, reviews & evaluations, expert opinion and commentary, case reports and extended reports. The manuscript man-agement system is completely online and includes a very quick and fair peer-review system, which is all easy to use. Visit http://www.dovepress. com/testimonials.php to read real quotes from published authors.
Dovepress
Dove
press
Faarup et al
It is concluded that the existence of a consistent, open, basolateral, or lateral space between cells from the second and third segment of the proximal tubule in the normal rat kidney is in close agreement with the established concept concerning water transport from tubular cells to peritubular capillaries. Moreover, this study has shown that the distribu-tion of first and second segment cells in tubules is different in superficial nephrons compared with in juxtamedullary nephrons. This finding is consistent with the knowledge that superficial and juxtamedullary nephrons are exposed to different functional conditions. However, perhaps the most exciting finding of our study is that salt loading, in terms of the kidney, results in the transformation of S1 cells to S2 cells, and vice versa, in the proximal tubule under physi-ological conditions.
Acknowledgments
The authors thank Niels Marcher and Paul Mai for their valuable assistance. This work was supported by grants from the Danish Medical Research Council and the Danish Heart Association.
Disclosure
None of the authors has any competing financial interest in this study. They are all employed in independent research institutions, with no support from sources with a financial interest in this study or its results.
References
1. Maunsbach AB. Observations on segmentation of the proximal tubule in the rat kidney. Ultrastruct Res. 1966;16:239–245.
2. Nielsen S, Smith BL, Christensen EI, Knepper MA, Nielsen F. Chip 28 water channels are located in constitutively water-permeable segments of the nephron. J Cell Biol. 1993;120:371–383.
3. Maunsbach AB, Marples D, Chin E, et al. Aquaporin-1 water channel expression in human kidney. J Am Soc Nephrol. 1997;8:358–360. 4. Agre P, King LS, Yasui M, et al. Aquaporin water channels – from atomic
structure to clinical medicine. J Physiol. 2002;542:3–16.
5. Hanssen O. Early post mortem renal changes studied in mice with one kidney exteriorized. 2. The functional and the early post mortem morphology of the kidney. Acta Pathol Microbiol Scand. 1960;49: 287–320.
6. Hegedüs V, Faarup P. The cortical volume of the normal human kidney. Correlated angiographic and morphological studies. Acta Radiol Diagn. 1972;12:481–496.
7. Faarup P, Saelan H, Ryoe G. Correlation between tubules and capillaries and size of interstitial space in the functioning rat kidney. Acta Pathol
Microbiol Scand A. 1971;79:607–616.
8. Tune BM, Burg MB. Glucose transport by proximal renal tubules.
Am J Physiol. 1971;221:580–585.
9. Schultz SG, Fuisz RE, Curran PF. Amino acid and sugar transport in rabbit ileum. J Gen Physiol. 1966;49:849–866.
10. Csaky TZ, Esposito G. Osmotic swelling of intestinal epithelial cells during active transport of sugars. Am J Physiol. 1969;217:753–755. 11. Armstrong WMD, Musselman DL, Reitzug HC. Sodium, potassium
and water content of isolated bullfrog small intestinal epithelium.
Am J Physiol. 1970;219:1023–1026.
12. Steinhausen M, Eisenbach G, Galaske R. A counter-current system of the surface of the renal cortex of rats. Pflügers Arch. 1970;318: 244–258.
13. Faarup P, Holstein-Rathlou NH, Hegedüs V. Structural evidence for counter-current flow in proximal tubules versus peritubular capillaries in the rat kidney. APMIS. 2000;108:779–784.
14. Faarup P, Holstein-Rathlou NH, Nørgaard T, Hegedüs V. Early segmental changes in ischemic acute tubular necrosis of the rat kidney. APMIS. 2004;112:192–200.
15. Drummond GB. Reporting ethical matters in The Journal of Physiology: Standards and advice. J Physiol. 2009;587:713–719.
16. Bulger RE, Lorentz WB Jr, Colindres RE, Gottschalk CW. Morphologic changes in rat renal proximal tubules and their tight functions with increased intraluminal pressure. Lab Invest. 1974;30:136–144. 17. Evan AP, Baker VT, Bengele HH. Zonulae occludentes of the rat
nephron under conditions of experimental expansion of blood and/or fluid volume. Anat Rec. 1976;186:139–150.
18. Lorenz WB, Lassiter WE, Gottschalk CW. Renal tubular permeability during increased intrarenal pressure. J Clin Invest. 1972;51:484–492. 19. Celsi G, Larsson L, Aperia A. Proximal tubular reabsorption and
Na-K-ATPase activity in remnant kidney of young rats. Am J Physiol. 1986;251:F588–F593.
20. Liu FY, Cogan MG, Rector FCJ. Axial heterogeneity in the rat proximal convoluted tubule. II. Osmolality and osmotic water permeability.
Am J Physiol. 1984;247:F822–F826.
21. Lameire NH, Lifschitz MD, Stein JH. Heterogeneity of nephron function. Ann Rev Physiol. 1977;39:159–184.
22. Kritz W, Kaissling B. Structural organization of the mammalian kidney. In: Seldin DW, Giebisch G, editors. The Kidney, Physiology and
Pathophysiology. New York, NY: Raven Press; 1985.
23. Treeck B, Aukland K. Effect of L-NAME on glomerular filtration rate in deep and superficial layers of rat kidneys. Am J Physiol. 1997; 272(3 Pt 2):F312–F318.
24. Gottschalk CW, Mylle M. Micropuncture study of pressures in proximal tubules and peritubular capillaries of the rat kidney and their relation to ureteral and renal venous pressures. Am J Physiol. 1956;185:430–439.
25. Starling EH. On the absorption of fluids from the connective tissue spaces. J Physiol (Lond). 1896;19:312–326.
International Journal of Nephrology and Renovascular Disease downloaded from https://www.dovepress.com/ by 118.70.13.36 on 23-Aug-2020