Research paper
Effect of Process Parameter Modification and Hot
Isostatic Pressing on the Mechanical Properties of
Selectively Laser-Melted 316L Steel
Janusz Kluczyński1, Lucjan Śnieżek1, Krzysztof Grzelak1, Artur Oziębło2, Krzysztof Perkowski2, Janusz Torzewski1, Ireneusz Szachogłuchowicz1, Krzysztof Gocman3, Marcin Wachowski1, Bogusz Kania4
1Military University of Technology, Faculty of Mechanical Engineering, Institute of Robots & Machine Design, 2 Gen. S. Kaliskiego St., 00-908 Warsaw 49, Poland
2Institute of Ceramics and Building Materials, Department of Ceramics and Composites, 9 Postepu St., 02-676 Warsaw, Poland
3Military University of Technology, Faculty of Mechanical Engineering, Institute of Vehicles & Transportation, 2 Gen. S. Kaliskiego St., 00-908 Warsaw 49, Poland
4Institute of Metallurgy and Materials Science, Polish Academy of Sciences, 25 Reymonta St., 30-059 Krakow, Poland
* Correspondence: [email protected]; Tel.: +48 261 837 208
Abstract: Industries that rely on additive manufacturing of metallic elements, especially biomedical companies, require material science-based knowledge of how process parameters and methods affect element properties, but such phenomena are incompletely understood. In this study, we investigated the influence of selective laser melting (SLM) process parameters and additional heat treatment on mechanical properties. The research included structural analysis of residual stress, microstructure, and scleronomic hardness in low-depth measurements. Tensile tests with element deformation analysis using digital image correlation (DIC) were performed as well. Experiment results showed it was possible to observe the porosity growth mechanism and its influence on material strength. Elements manufactured with 20% lower energy density had almost half the elongation, which was directly connected with porosity growth during energy density reduction. Hot isostatic pressing (HIP) treatment allowed for a significant reduction of porosity and helped achieve properties similar to elements manufactured using different levels of energy density.
Keywords: 316L austenitic steel, selective laser melting, hot isostatic pressing, microscopic investigation, residual stresses
1. Introduction
Research on additive manufacturing with metal powders [1] has grown significantly, yet many research questions remain. The intensity of the research is driven by the wide use of additive manufacturing to make geometrically complex parts in fields such as medical devices [2], aviation [3], astronautics, and the automotive industry [4, 5] and other mechanical solutions [6].
One area of ongoing investigation concerns the modification of the mechanical properties of additively manufactured elements. Both the layer-by-layer characteristic of the process and the use of process parameters allow for the control of element properties through a variety of methods, including process parameter modification [6, 7], heat treatment after selective laser melting (SLM) processing [8, 9], element topology [11], and surface treatment [12] after SLM processing [11, 12]. A
proper surface parameters have a significant influence on elements properties which was deeply investigated by Macek et al. in their work [15]. Parameter modification can be used to increase process efficiency or to customize element properties for a specific application, such as increasing the porosity in plain bearings construction.
The most significant element property that changes with process parameters, even within small ranges of parameter modification, is porosity. Additively manufactured elements made using powder bed fusion (PBF) technologies are characterized by low porosity, e.g. lower than 1% [16–18]. However, in some cases, increased porosity is the desired effect. The best examples of this are certain medical applications where element porosity is appropriate [14, 16]. Most additively manufactured elements are designed in such a way that the mechanical properties of the elements can be modified without decreasing the material porosity. To accomplish structural modification of metal 3D printed elements, the most significant factor is use of the proper type of heat treatment to achieve an acceptable microstructure. Some types of heat treatment assure the modification of material properties, but without porosity reduction. To achieve porosity reduction, hot isostatic pressing (HIP) can be an appropriate method of heat treatment. The HIP process results in a reduction in the number of pores in the additively manufactured elements’ structures [20,21]. Despite this, many studies report that HIP treatment positively affects elements properties [8,18,20–23] by reducing the structural porosity and increasing the material elongation (with the presence of significant load) which eliminate probability of brittle material cracking. There is also some research on the negative influence of HIP treatment. Geenen et al. [24] found undesirable effects on element properties after HIP including lack of porosity reduction and also lower corrosion resistance.
Our own previous research results revealed how different technological parameters affect microstructure and mechanical properties based on earlier research [25–27]. This is helpful for understanding when a particular modification method (process parameters, type of heat treatment) would be effective in the design application. In connection with specially designed research programs, this study investigated the influence of five groups of SLM process parameters on austenitic 316 L stainless steel structure and mechanical behavior. Groups of parameters were selected from the existing research based on two main properties: porosity and microhardness. To maintain research continuity, sample indication numbers have been retained from the basic research [25,28]. It is worth noting that parameter modification in the abovementioned own research was based on low-ranged (±10%) changes of three values: laser power, hatching distance (the distance between laser lines) and laser exposure velocity. All these parameters form part of the exposure energy density during the SLM process.
One group of selected parameters was taken from research by Di Wang et. al [29], which stated that using much higher energy density could assure better element properties.
2. Experimental
2.1. Material
Figure 1. Scanning electron microscope image of 316L powder particles captured in secondary electron mode
The chemical composition of the material is shown in Table 1.
C Mn Si P S N Cr Mo Ni weight [%]
max. 0.03
max. 2.00
max. 0.75
max. 0.04
max. 0.03
max. 0.10
16.00-18.00
2.00- 3.00
10.00-14.00
Table 1. 316L steel chemical composition according to LPW Technology quality check
2.2. Manufacturing process description
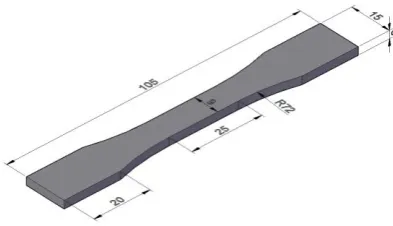
All specimens were manufactured on the SLM 125HL machine (SLM Solutions AG). All research was conducted on specimens designed according to the ASTM E466 - 96 standard. To obtain reliable results, all tests including microstructure, residual stress, and hardness analysis were made on the same types of specimens. For structural and hardness tests, a cutout was taken of each specimen from 7 mm of its tip. The specimen geometry is shown in Figure 2.
Figure 2. Specimen dimensions based on the ASTM E466 - 96 standard
All elements were designed using SolidWorks 2019 software and manufactured using 316L (1.4404) austenitic steel powder.
During the authors’ preliminary tests [25], changes in microhardness and porosity were observed when the selected parameters were modified by 10 percent. During the abovementioned tests, the modified parameters were laser power, laser exposure velocity and hatching distance. The selection of parameters for modification was made based on their influence on energy density. In accordance with equation (1), energy density is affected by four different parameters.
𝝆𝑬[ 𝑱 𝒎𝒎3] =
𝑳𝑷[𝑾]
𝒆𝒗[𝒎𝒎𝒔 ]∙𝒉𝒅[𝒎𝒎]∙𝒍𝒕[𝒎𝒎] (1)
Where:
• LP– laser power [W],
• ev– exposure velocity [mm/s],
• hd– hatching distance [mm],
• lt– layer thickness [mm].
Five different groups of parameters were investigated. The main group consisted of SLM device parameters for 316L steel and was marked as S_01. The second group consisted of parameters where low porosity was recorded despite increased hatching distance. This was called the S_15 group. The third group, marked as S_17, contained the parameters that recorded the highest porosity during manufacturing with the lowest energy density from all groups. Of note, the lowest microhardness values were discovered in samples made using that group of parameters. S_27 was the parameter group of the elements with the highest microhardness values. The last group was S_30, comprising parameters with the highest value of energy density based on the literature [29]. All described parameter groups are specified in Table 2.
Parameter group name
Laser power LP [W]
Exposure velocity ev [mm/s]
Hatching distance hd [mm]
Energy density
ρE [J/mm3]
S_01 190 900 0.12 58.64 S_15 200 810 0.13 63.31 S_17 180 990 0.13 46.62 S_27 180 810 0.11 67.34 S_30 120 300 0.08 166.67
Table 2. Parameter groups used for sample manufacturing
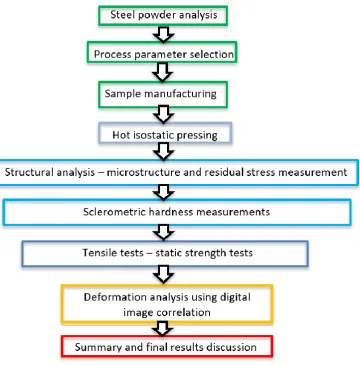
All five groups of parameters were used to produce samples for structural analysis, including microstructure investigation and residual stress measurement; scleronomic and instrumental hardness testing; and creep analysis and tensile tests. The second part of the research used hot isostatic pressing on two selected parameters groups – S_01 and S_17. After heat treatment, all of the original tests were carried out.
The last part of the research was an additional test of S_01 and S_17 samples. The influence of solution heat treatment on the samples made using the S_30 parameters group was checked as well.
Figure 3. The research methodology
Specimens from each series (for example, all of group S_01, shown in Figure 4) were manufactured during a single process to assure the same material properties of each specimen from each group. Specimen manufacturing processes were carried out in an argon atmosphere with the oxygen content lower than 0.2%.
Figure 4.S_01 group specimens on the device’s building platform
Microstructure investigations were made using an Olympus LEXT OLS4100 confocal microscope. Specimens dedicated for microstructure analysis were mounted in resin and prepared for observation by grinding and polishing. To reveal the microstructure elements, samples were etched using an acetic glycergia solution. The solution composition was: 6 mL HCl, 4 mL HNO3, 4 mL CH3COOH and 0.2 mL glycerol. To reach the proper effect, 40 s etching time was applied.
To determine the surface residual stresses, diffractometric measurement was made of the values
of σ1and σ2, two main, perpendicularly oriented directions of the residual stresses distribution, sin2ψ.
The measurements were made using a Bruker D8 Discover X-ray diffractometer with the Euler wheel and the sample positioning system in three axes. The samples for the research were prepared by separating part of the material from the end of the handling zones by electrical discharge machining. This particular type of machining had been used to avoid measurement interference based on the available research conclusions [30]. Radiation and beam optics were specially prepared for the
specimen measurements and were characterized by CoKα filtration series, polycapillary primary
beam optics with Ø 1.0 mm pinhole collimator, paraphocous secondary beam optics with a positionally sensitive semiconductor LYNXEYE detector with a 2.6° span in 2Θ angle, and parallel
beam optics for a secondary beam with a Soller collimator with 0.23° equatorial divergence. For the additively manufactured elements, the standard diffractometric measurements of residual stresses were used. For the qualitative phase analysis, CrystalImpact Match! 3 software was used with an ICDD PDF-4+ 2019 crystallographic database.
Sclerometric hardness testing was conducted using the Center for Tribology, Inc. (CETR) Universal Nano & Micro Tester. This device enables a comprehensive assessment of the mechanical and tribological properties of thin coatings and solid materials; depending on its configuration, it allows you to carry out various tests at the nano, micro, and macro scale.
Sclerometric hardness measurements were based on the analysis of the average width of a scratch made by an indenter with specified geometry. During material scratching, there is a constant normal load with additional constant indenter movement speed. This method is helpful to test the hardness of the material in nano, micro, and macro scales. This kind of hardness test enables the analysis of the additively material layered structure on the perpendicular surface to the building platform. The sclerometric measurements were compared to test results made on parallel surfaces to building platforms. The described surfaced has been shown in Figure 5.
Figure 5. Cubic specimen showing two main tested surfaces. xy - plane parallel to the building platform surface; yz - plane perpendicular to the building platform surface; hd - hatching distance between the exposure lines; Z – the direction of element-building growth [25]
The surface structure of the sample fractures after the tensile test was observed using the Jeol JSM-6610 scanning electron microscope.
Deformations of the material during tensile tests were recorded using the DIC method. The analyses were carried out using the Dantec Q - 400 Series system, while data processing was carried out in the ISTRA 4D software. Deformation observations were made from the front surface of the analyzed samples.
3. Microstructure analysis – results and discussion
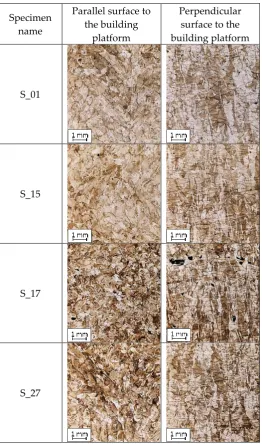
Microstructure observations were performed on two different surfaces in reference to the machine-building platform – perpendicular and parallel. On some specimens’ surfaces, porosity
could be seen as black, non-regular shapes. The use of five different groups of parameters revealed that parameter modification mainly affects the porosity between the layers, visible in the figures of Table 3 on the perpendicular surfaces to the building platform.
Specimen name
Parallel surface to the building
platform
Perpendicular surface to the building platform
S_01
S_15
S_17
S_30
Table 3. Microstructure of specimens: two cross-sections
As was described in [25] and shown in Table 3, the S_17 specimen has visible porosity on a much higher level than other specimens. The porosity is mainly caused by the gas-made balling effect [23] and the share of non-melted grains in the material volume. During the microstructure investigation, a homogeneous distribution of the spherical nanoprecipitation was observed (Figure 6).
Due to the very small size of the precipitations, it was not possible to determine the chemical composition of the particles using EDS X-ray microanalysis.
Comparing the microstructure of the S_01 and S_30 specimens, smaller grain size was observed in the S_30 specimen. This phenomenon relates to the latter’s three times higher energy density,
which caused more shrinkage due to the higher level of the temperature gradient after exposure. The microstructure analysis allows registering the border outline shape on the parallel surface to the building platform. As can be seen in Figure 6, there are no visible gaps between the core and border outline areas.
Figure 6. Microstructure of the element in the core and border outline areas
No imperfections were observed between borderline and core in any specimens. This was achieved by using different parameters for the outline shell than in the core of the element structure. In accordance with own research [22], the default parameters of the machine producer for the 316L steel material were used.
4. Parameter modification influence on residual stresses – results and discussion
Based on the monocrystalline elastic constants for austenitic steel (C11 = 204.0 GPa, C12 = 133.0
GPa, C44 = 126.0 GPa), the elastic constants of the specimens were determined using the Reuss model.
The obtained values were, respectively, E311= 144.5 GPa, ν311 = 0.35 and E111 = 298.1 GPa, ν111 = 0.18.
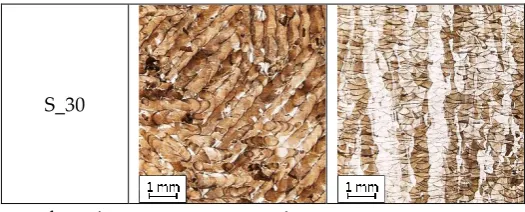
Detailed test results were presented using a measuring series based on 311 reflections analysis, because these results, due to the angular position of the Fe 311 peak, are more resistant to systematic measurement errors. The residuals stress measurements with their orientation directions are shown on the chart (Figure 7).
Figure 7. Vertical and horizontal residual stresses (𝜎1 is parallel to x axis, 𝜎2 is parallel to
z axis)
Sample orientations in the diffractometer are shown in the circular diagrams of directional stresses in Figure 7, indicating directions and values of main stresses. Stress orientation is presented according to the additive-manufacturing directions of the specimens: the vertical direction in the visualization corresponds to the direction parallel to the building platform, and the horizontal direction corresponds to the surface perpendicular to the building platform. All uncertainties are given with the coverage factor k = 1.
As can be seen in Figure 7, all additively manufactured elements indicate compressing stresses, which were caused by the high-temperature gradient during the manufacturing process. Residual stresses in specimens manufactured using much higher energy density (S_30) were much lower than expected. The main reason for this phenomenon may be connected with the use of cutouts from bigger specimens.One of the research goals was, in fact, to discover the level of residual stresses after removing a part of the material. The biggest registered residual stress level was in the S_17 specimen, where the greatest porosity was recorded. That level of residual stress could be connected with the balling effect[31]during porosity formation.
5. Measurements of sclerometric hardness – results and discussion
5.1. Indentation force measurement
Sample
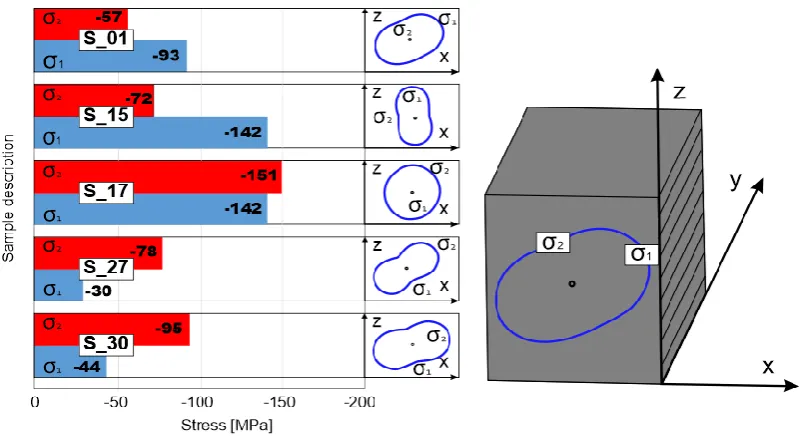
group Indentation force as a function of scratch length
S_01 S_15 S_17 S_27 0 2 4 6 8 10 12 14 In d en d at ion f o rce [ m N ]
Scratch length [mm]
S_01_on_layer_scratching S_01_through_layers_scratching 0 2 4 6 8 10 12 14 In d en d at ion f o rce [ m N ]
Scratch length [mm]
S_15_on_layer_scratching S_15_through_layers_scratching 0 2 4 6 8 10 12 14 In d en d at ion f o rce [ m N ]
Scratch length [mm]
17_on_layer_scratching 17_through_layers_scratching 0 2 4 6 8 10 12 14 In d en d at ion f o rce [ m N ]
Scratch length [mm]
S_30
Table 4. Indentation force as a function of scratch length
The charts shown in Table 4 were compared across all measurements. Differences between the force values for each layer are especially visible in S_17 specimens. These issues are not a result of different material properties but with the surface curvature imperfections of some specimens.
During the measurement, the entire system was calibrated in accordance with standards to ensure proper force values during scratching. In almost all specimens, excluding S_30, there are visibly higher force fluctuations in the surface perpendicular to the building platform than in the surface parallel to the building platform. In the S_30 sample, this phenomenon is not visible. Based on these results, we conclude that in the standard range of energy density values the layered structure of the material is noticeable during cross-sectional scratching of the surface through the material layers. When using much higher energy density values during the process, the layered structure characteristic was not recorded. This result may be the result of the melting of the material in the volume deeper than single-layer height due to the much higher energy delivered to the material.
5.2. Sclerometric hardness measurement
Based on the recorded scratching force and the scratch dimensions, it was possible to calculate the sclerometric hardness of the elements using the equation parameters associated with the indenter (2).
𝐻𝑆𝑝= 8⋅𝐹
𝜋⋅𝑤2 (2)
where: HSp – sclerometric hardness [Pa], F – normal force [N],
w – average scratch width [m].
Measurements were made for both element orientations (Figure 8).
0 5 10 15 20 25
In
d
en
d
at
ion
f
o
rce
[
m
N
]
Scratch length [mm]
Figure 8. Sclerometric hardness measured in both directions in relation to the machine-building platform – on layer (ol) and through layers (tl)
Lower sclerometric hardness values were found across the through layers (perpendicular to the building platform) than the on layers in specimens S_01, S_15, S_17, and S_27. The opposite phenomenon was found in the S_30 group.
6. Tensile strength and displacement measurements using DIC – results and discussion
To expand the analyses, conventionally made elements of the same material were subjected to static tensile tests. Model elements were cut out of the cold-rolled sheet with a rolling direction consistent with the direction of exposure in additively manufactured samples. The results of monotonic tensile tests on samples produced by the SLM technology with 316L steel are shown in Figure 9.
Figure 9. Monotonic stretching curves for S_01, S_15, S_17, S_27 and S_30 samples with the recorded waveform for a conventionally produced element (P1) with marked characteristic points recorded during digital image correlation
The highest tensile strength was reached using the S_01 parameter group, whereas the lowest tensile strength value was recorded during S_17 sample testing. The results indicate over 40% reduction in relative elongation, 16% reduction in tensile strength and 20% decrease in yield strength
4.16 4.44
3.80 4.04 3.67 4.04
3.04 3.33
3.85
3.53
S_01_tl S_01_ol S_15_tl S_15_ol S_17_tl S_17_ol S_27_tl S_27_ol S_30_tl S_30_ol
Sc
le
rom
etric
h
ard
n
es
s
[Pa]
for elements manufactured using parameter group S_17 compared to the S_01 group, which is the recommended parameter set by the manufacturer of the SLM 125HL system. Elements manufactured using the S_27 parameter group were characterized by the largest relative elongation among all tested samples.
The observed decrease in ultimate tensile strength (Rm) value is affected by increases in hatching
distance and exposure speed, and is also related to lower laser power. These three parameters affect the energy density (Equation (1)). All mentioned parameter modifications decrease the energy delivered into the volume of the material.
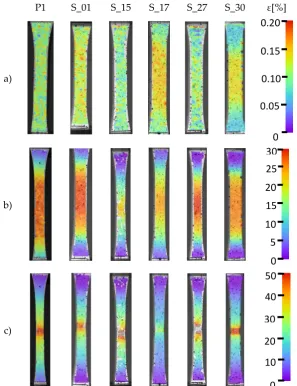
Tensile test results with marked places of occurrence of characteristic quantities (yield strength, ultimate tensile strength, and breaking strength) are presented in Figure 9. The recorded deformation values for these characteristic values are shown in Figure 10.
P1 S_01 S_15 S_17 S_27 S_30 ε[%]
a)
b)
c)
Figure 10. Deformation distributions of three characteristics recorded during digital image correlation tests for each sample: a) yield strength, b) ultimate tensile strength and c) breaking strength
The results obtained during DIC (Figure 10) indicate homogeneous deformation distribution over the entire surface for all analyzed samples. A visible difference was observed in the deformation distributions of the S_17 samples, where after exceeding the yield point (Figure 10 b) areas of almost equal material deformation were observed. The same samples did not show visible narrowing after reaching the breaking point. This phenomenon relates to a high amount of porosity inside the S_17 sample volume.
0.20
0
0.05
0.10
0.15
30
0
5
10
20
25
15
50
0
10
30
40
For samples P1, S_01, S_15, S_27, and S_30 (Figure 10 c), maximum deformations were observed near the crack initiations. Cumulation of the maximum deformations at one place and the uniform nature of their growth indicate that additively manufactured elements are stabilized throughout the load range. In the area with high deformation value (Figure 10 c), narrowing is visible, which proves the high plasticity of the manufactured material. There were no local or band heterogeneities of deformations, which in a wide range of load changes makes it impossible to predict the location of the crack initiation.
During the analysis of all tests, there was no clear phenomenon noted which could allow accurate determination of crack initiation sites. The nature of the cracking mechanism could only be analyzed based on the SEM images (Figure 11).
P1
S_01
S_15
S_17
S_27
S_30
Figure 11. Fracture surfaces of the samples after tensile tests with marked inter-crystalline crack areas
The surfaces of the samples made of the conventionally manufactured 316L steel (P1 in Figure 11) are characterized by plastic fracture, which is typical for this type of material. For the fracture surfaces of additively manufactured samples marked as S_01, S_15, S_17, and S_27, brittle-like cracking was observed. In the elements manufactured using the S_30 parameters group plastic fracture with small areas of brittle-like cracking were observed. Arrows mark the places of occurrence of cracks near the pores of the material, in the vicinity of which are visible faults resulting from the inter-crystalline course of the cracking process (Figure 11).
1 mm
1 mm
1 mm
1 mm
1 mm
1 mm
50 µm
50 µm
50 µm
50 µm
50 µm
6. Heat treatment – hot isostatic pressing – results and discussion
Additively manufactured elements using two sets of parameter groups, S_01 and S_17, were obtained using HIP. The specimens received HIP treatment in an argon atmosphere at 1150° C under pressures equal to 100 MPa for 3 h. The process was preceded by heating with a speed of 600° C per hour with the input pressure equal to 40 MPa. After the annealing process, the cooling rate was equal to 400 °C per hour. The process characteristic is shown in Figure 12.
Figure 12. Temperature and pressure regimes during the HIP process
Specimen selection was based on the preliminary test results, in which the S_01 specimen group was characterized by the best tensile properties and the S_17 group had the worst. The primary purpose of HIP annealing was to check the ability of the process to improve the structure and mechanical properties of the elements from both selected parameter groups. After HIP treatment, all measurements and analyses shown in this article were conducted on annealed specimens with the addition of the porosity analysis, which were carried out in preliminary research [25].
The first analysis compared porosity before and after HIP annealing. Table 5 shows the results before and after HIP for specimens manufactured using parameter groups S_01 and S 17.
Specimen
description Porosity before HIP [%]
Porosity after HIP [%]
S_01 - xy 0.171 0.043 S_01 - yz 0.184 0.036 S_17 - xy 0.879 0.195 S_17 - yz 0.957 0.335
Table 5. Porosity in two main orientations: xy - plane parallel to the building platform surface, yz - plane perpendicular to the building platform surface
After the HIP process, significant porosity reduction was observed on both surfaces of the S_17 specimen. The porosity reduction was equal to 78% in the xy plane and 65% in the yz plane. No significant change in porosity was observed in either orientation of the S_01 specimens because of low porosity directly after the additive manufacturing process. The phenomenon of porosity reduction can be observed in Table 6, where the microstructures of S_01 and S_17 before and after heat treatment are shown.
Specimen
description Before HIP After HIP
S_01 - xy
S_01 - yz
S_17 - xy
S_17 - yz
Table 6. Microstructure of the elements along two main orientations: xy - plane parallel to the building platform surface, yz - plane perpendicular to the building platform surface
Porosity reduction is visible in the microstructure of both element orientations in the S_17 specimens. For both S_01 and S_17, the same microstructural changes are visible after HIP annealing. Element microstructure is characterized by polygonal austenite grains that are typical for austenitic steels. Slow cooling after HIP annealing caused grain growth after the process in both directions. The grain distribution direction is strictly connected with the distribution of exposure lines in the xy plane and with the layers deposition direction for the yz plane.
Figure 13. Residual stress comparison after HIP process (𝜎1 is parallel to x axis, 𝜎2 is parallel to
z axis)
After HIP annealing, significant growth (30-40%) of residual stress is visible in the perpendicular plane in both S_01 and S_17 specimens which were shown as S_01H and S_17H in figure 13. This phenomenon could relate to consolidation of the material near the borders and generation of layers of additional stress in that area.
Sclerometric and instrumental hardness measurements were conducted on the samples, as well as calculations for elastic modulus and creep analysis. HIP influence on all these parameters are shown in Table 7.
Measurement
type Chart
Indentation force – S_01;
S_01h (hipped)
0 2 4 6 8 10 12 14 16 18 20 22
In
d
en
d
at
ion
f
o
rce
[
m
N
]
Indentation force
– S_17; S_17h (hipped)
Sclerometric hardness
Table 7. Sclerometric and instrumental hardness measurements and elastic modulus with creep calculations
Different measurements of sclerometric hardness show opposite behavior of S_01 and S_17 specimens after HIP. Fluctuations in S_01 force are much higher after HIP whereas in S_17, the fluctuations are almost at the same level before and after HIP. This phenomenon appeared also in sclerometric hardness measurements, where there is a significant decrease in the material hardness after HIP in S_01 specimens and no consistent relationship between HIP and sclerometric hardness in S_17 specimens.
The last group of analyses comprised tensile tests with DIC measurements of element deformations during tensile testing. Figure 14 charts the characteristics of additively manufactured
elements after heat treatment. A significant increase in the elements’ elongation was observed for
both types of samples, S_01H and S_17H.
0 2 4 6 8 10 12 14 16 18 In d en d at ion f o rce [ m N ]
Scratch length [mm]
S_17_on_layer_scratching S_17_through_layers_scratching S_17h_on_layer_scratching S_17h_through_layers_scratching
4.16 4.44
3.43 3.47 3.67 4.04
4.50 4.17 0 1 2 3 4 5 6
S_01_tl S_01_ol S_01H_tl S_01H_ol S_17_tl S_17_ol S_17H_tl S_17H_ol
Figure 14. Monotonic stretching curves for additively manufactured samples before (S_01, S_17) and after heat treatment (S_01H, S_17H) and for conventionally produced elements (P1)
P1 S_01 S_01H S_17 S_17H ε[%]
a)
b)
c)
Figure 15. Deformation distributions recorded during digital image correlation tests
Deformation distribution in all samples up to the breaking point is characterized by very high uniformity. The results of deformation measurements are similar for HIP treated elements as for conventionally produced samples (P1 in Figure 15). In the case of the model elements S_01H and S_17H, no local or band heterogeneities of deformations were found, which in a wide range of load changes makes it impossible to predict the location of the crack initiation. Fracture surfaces of samples subjected to static tension after heat treatment are shown in Figure 16.
0.20
0
0.05
0.10
0.15
30
0
5
10
20
25
15
50
0
10
30
40
P1
S_01
S_01H
S_17
S_17H
Figure 16. Fracture surfaces after tensile tests with and without heat treatment with marked areas of inter-crystalline cracks
The fracture surfaces of additively manufactured samples made of 316L steel and subjected to heat treatment using HIP (S_01H; S_17H) are characterized by plastic fracture, which makes them similar to conventionally produced elements (P1 in Figure 16). This result clearly indicates the positive effect of this type of heat treatment.
7. Conclusions
Understanding the phenomena of using different process parameters in SLM processing and heat treatment on the material microstructure and mechanical properties is very helpful during the design of special purpose constructions. Based on the results obtained in this study, the following conclusions could be drawn:
Energy density reduction of 20% caused almost a 50% decrease in the elements’ elongation and
a 10% decrease in tensile strength. Additionally, the elements manufactured using parameters with lower energy density had no visible sample narrowing during tensile testing. The surface of almost all tensile fractures had a brittle-like structure. In elements manufactured with higher energy density, plastic cracking was observed.
The layered structure of the elements’ surfaces tested in cross-section perpendicular to the
building platform was observed. Using higher values of energy density during the SLM process and using HIP eliminates the layered structure effect and reduces the element roughness with the growth of the material solidification.
Porosity generation based on the balling effect caused a higher level of residual stresses in element structure. Additional heat treatment using HIP caused residual stress growth in the horizontal direction of the elements (along the layer deposition direction) due to recrystallization of the materials in the volume of pressed powder grains which were not melted in the SLM process.
Additional heat treatment using HIP did not cause greater narrowing in the samples during tensile testing of the S_17 samples, which were characterized by higher porosity. DIC analysis revealed that increased levels of elongation relate to the wide range of element deformation in the
sample’s front surface areas.
1 mm
1 mm
1 mm
1 mm
1 mm
50 µm
50 µm
50 µm
50 µm
Funding
The Programme is co-financed by the European Social Fund under the "Knowledge Education Development Operational Programme" in 2014-2020.
Bibliography
1. du Plessis, A.; Broeckhoven, C.; Yadroitsava, I.; Yadroitsev, I.; Hands, C.H.; Kunju, R.; Bhate, D. Beautiful and Functional: A Review of Biomimetic Design in Additive Manufacturing.
Addit. Manuf.2019, 27, 408–427.
2. Murr, L.E. Frontiers of 3D Printing/Additive Manufacturing: from Human Organs to Aircraft Fabrication. J. Mater. Sci. Technol.2016, 32, 987–995.
3. Rokicki, P.; Kozik, B.; Budzik, G.; Dziubek, T.; Bernaczek, J.; Przeszlowski, L.; Markowska, O.; Sobolewski, B.; Rzucidlo, A. Manufacturing of aircraft engine transmission gear with SLS (DMLS) method. Aircr. Eng. Aerosp. Technol.2016, 88, 397–403.
4. Prakash, K.S.; Nancharaih, T.; Rao, V.V.S. Additive Manufacturing Techniques in Manufacturing -An Overview. Mater. Today Proc.2018, 5, 3873–3882.
5. Inovar Communications Ltd Fully functional additively manufactured automotive cylinder block produced for Volkswagen. Mag. Met. Addit. Manuf. Ind.2016, 2, 40–41.
6. Kluczyński, J.; Śnieżek, L.; Kravcov, A.; Grzelak, K.; Svoboda, P.; Szachogłuchowicz, I.; Franek,
O.; Morozov, N.; Torzewski, J.; Kubeček, P. The Examination of Restrained Joints Created in
the Process of Multi-Material FFF Additive Manufacturing Technology. Materials (Basel).2020,
13, 903.
7. Spierings, A.B.; Schoepf, M.; Kiesel, R.; Wegener, K. Optimization of SLM productivity by aligning 17-4PH material properties on part requirements. Rapid Prototyp. J.2014, 20, 444–448. 8. Riemer, A.; Richard, H.A. Crack Propagation in Additive Manufactured Materials and
Structures. Procedia Struct. Integr.2016, 2, 1229–1236.
9. Strong, D.; Kay, M.; Conner, B.; Wakefield, T.; Manogharan, G. Hybrid manufacturing –
integrating traditional manufacturers with additive manufacturing (AM) supply chain. Addit. Manuf.2018, 21, 159–173.
10. Yu, H.; Li, F.; Wang, Z.; Zeng, X. Fatigue performances of selective laser melted Ti-6Al-4V alloy: Influence of surface finishing, hot isostatic pressing and heat treatments. Int. J. Fatigue 2019, 120, 175–183.
11. Li, M.; Lai, C.; Zheng, Q.; Han, B.; Wu, H.; Fan, H. Design and mechanical properties of hierarchical isogrid structures validated by 3D printing technique. Mater. Des. 2019, 168, 107664.
12. Lou, S.; Brown, S.B.; Sun, W.; Zeng, W.; Jiang, X.; Scott, P.J. An investigation of the mechanical filtering effect of tactile CMM in the measurement of additively manufactured parts. Meas. J. Int. Meas. Confed.2019, 144, 173–182.
13. Blinn, B.; Klein, M.; Gläßner, C.; Smaga, M.; Aurich, J.C.; Beck, T. An investigation of the microstructure and fatigue behavior of additively manufactured AISI 316L stainless steel with regard to the influence of heat treatment. Metals (Basel).2018, 8.
14. Löber, L.; Flache, C.; Petters, R.; Kühn, U.; Eckert, J. Comparison of different post processing technologies for SLM generated 316l steel parts. Rapid Prototyp. J.2013, 19, 173–179.
107347.
16. Tucho, W.M.; Lysne, V.H.; Austbø, H.; Sjolyst-Kverneland, A.; Hansen, V. Investigation of effects of process parameters on microstructure and hardness of SLM manufactured SS316L.
J. Alloys Compd.2018, 740, 910–925.
17. Leordean, D.; Dudescu, C.; Marcu, T.; Berce, P.; Balc, N. Customized implants with specific properties, made by selective laser melting. Rapid Prototyp. J.2015, 21, 98–104.
18. Röttger, A.; Geenen, K.; Windmann, M.; Binner, F.; Theisen, W. Comparison of microstructure and mechanical properties of 316 L austenitic steel processed by selective laser melting with hot-isostatic pressed and cast material. Mater. Sci. Eng. A2016, 678, 365–376.
19. Yang, Y.; Lu, J. Bin; Luo, Z.Y.; Wang, D. Accuracy and density optimization in directly fabricating customized orthodontic production by selective laser melting. Rapid Prototyp. J. 2012, 18, 482–489.
20. Riemer, A.; Richard, H.A.; Brüggemann, J.P.; Wesendahl, J.N. Fatigue crack growth in additive manufactured products. Frat. ed Integrita Strutt.2015, 9, 437–446.
21. Kunz, J.; Kaletsch, A.; Broeckmann, C. Influence of HIP post-treatment on the fatigue strength of 316l-steel produced by selective laser melting (SLM). World PM 2016 Congr. Exhib.2016. 22. AlMangour, B.; Grzesiak, D.; Yang, J.M. Selective laser melting of TiB2/316L stainless steel
composites: The roles of powder preparation and hot isostatic pressing post-treatment. Powder Technol.2017, 309, 37–48.
23. Ścigała, K.; Bedziński, R.; Filipiak, J.; Chlebus, E.; Dybała, B. Application of generative
technologies in the design of reduced stiffness stems of hip joint endoprosthesis. Arch. Civ. Mech. Eng.2011, 11, 753–767.
24. Geenen, K.; Röttger, A.; Theisen, W. Corrosion behavior of 316L austenitic steel processed by selective laser melting, hot-isostatic pressing, and casting. Mater. Corros.2017, 68, 764–775. 25. Kluczyński, J.; Śniezek, L.; Grzelak, K.; Mierzyński, J. The influence of exposure energy
density on porosity and microhardness of the SLM additive manufactured elements. Materials (Basel).2018, 11.
26. Kluczyński, J.; Sniezek, L.; Grzelak, K.; Torzewski, J. The influence of layer re-melting on tensile and fatigue strength of selective laser melted 316L steel. In Proceedings of the 12th International Conference on Intelligent Technologies in Logistics and Mechatronics Systems, ITELMS 2018; 2018; pp. 115–123.
27. Śniezek, L.; Grzelak, K.; Torzewski, J.; Kluczyński, J. Study of the mechanical properties
components made by SLM additive technology. In Proceedings of the 11th International Conference on Intelligent Technologies in Logistics and Mechatronics Systems, ITELMS 2016; 2016; pp. 145–153.
28. Kluczyński, J.; Śnieżek, L.; Grzelak, K.; Janiszewski, J.; Płatek, P.; Torzewski, J.;
Szachogłuchowicz, I.; Gocman, K. Influence of Selective Laser Melting Technological
Parameters on the Mechanical Properties of Additively Manufactured Elements Using 316L Austenitic Steel. Materials (Basel).2020, 13, 1449.
29. Wang, D.; Liu, Y.; Yang, Y.; Xiao, D. Theoretical and experimental study on surface roughness of 316L stainless steel metal parts obtained through selective laser melting. Rapid Prototyp. J. 2016, 22, 706–716.
Rapid Prototyp. J.2006, 12, 254–265.
![Figure 5. Cubic specimen showing two main tested surfaces. xy - plane parallel to the building platform surface; yz - plane perpendicular to the building platform surface; hd - hatching distance between the exposure lines; Z – the direction of element-building growth [25]](https://thumb-us.123doks.com/thumbv2/123dok_us/7999809.1328707/6.595.196.394.487.629/specimen-surfaces-perpendicular-building-distance-exposure-direction-building.webp)