Correlation ECE diagnostic in Alcator C-Mod
C. Sung1,a, A. E. White1, N. T. Howard1, D. Mikkelsen2, J. Irby1, R. Leccacorvi1, R. Vieira1, C. Oi1, J. Rice1, M. Reinke1, C. Gao1, P. Ennever1, M. Porkolab1, R. Churchill1, C. Theiler1, J. Walk1, J. Hughes1, A. Hubbard1, M. Greenwald1, and and the Alcator C-Mod team1
1Plasma Science and Fusion Center, Massachusetts Institute of Technology, Cambridge, Massachusetts 02139, USA
2Princeton Plasma Physics Laboratory, Princeton, New Jersey 08543, USA
Abstract.Correlation ECE (CECE) is a diagnostic technique that allows measurement of small amplitude electron temperature,Te, fluctuations through standard cross-correlation analysis methods. In Alcator C-Mod,
a new CECE diagnostic has been installed[Sung RSI 2012], and interesting phenomena have been observed in various plasma conditions. We find that localTefluctuations near the edge (ρ∼0.8) decrease across the
linear-to-saturated ohmic confinement transition, with fluctuations decreasing with increasing plasma density[Sung NF 2013], which occurs simultaneously with rotation reversals[Rice NF 2011].Tefluctuations are also reduced
across core rotation reversals with an increase of plasma density in RF heated L-mode plasmas, which implies that the same physics related to the reduction ofTefluctuations may be applied to both ohmic and RF heated
L-mode plasmas. In I-mode plasmas, we observe the reduction of coreTefluctuations, which indicates changes
of turbulence occur not only in the pedestal region but also in the core across the L/I transition[White NF 2014]. The present CECE diagnostic system in C-Mod and these experimental results are described in this paper.
1 Introduction
In fusion research, the cross-field transport level is usually higher than the level predicted from neo-classical theory, and it is considered that turbulent transport is responsible for this anomalous transport[1]. Since turbulent transport is determined by fluctuations of potential, density, temper-ature and magnetic field and their phase relations, fluc-tuation measurements are required to understand the tur-bulent transport behavior. Correlation ECE (CECE) is a diagnostic technique that can resolve small amplitudeTe fluctuations. It is hard to measure turbulent Te fluctua-tions, whose level is∼ 1%, with ECE radiometry due to inherent thermal noise. If we have two channels with un-correlated thermal noise and commonTefluctuations, the fluctuations can be resolved by correlating these two chan-nels. More details about the principles of CECE can be found in [2–4].
2 Description of the Correlation ECE
diagnostic in Alcator C-Mod
A new CECE diagnostic has been installed in the Alcator C-Mod tokamak, andTefluctuations have been measured in various plasma conditions. The CECE diagnostic in Al-cator C-Mod measures long wavelength (kθρs <0.3)Te fluctuations. The spectral decorrelation method[3] is used in the CECE diagnostic to measure the small amplitude(≤ 1%) turbulentTefluctuations. Figure 1 shows a diagram
ae-mail: [email protected]
Figure 1.Diagram of the CECE diagnostic in Alcator C-Mod
of the CECE diagnostic in C-Mod. The CECE diagnos-tic at C-Mod is an ECE radiometer which measures 2nd harmonic X-mode EC emission(230-248 GHz) approxi-mately 7 cm above the midplane in the region, ρ ∼ 0.8,
ρis normalized square root of toroidal flux[5].
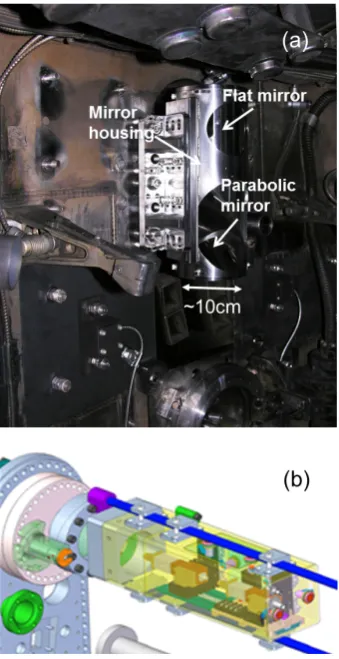
The CECE diagnostic in C-Mod consists of two parts. The first part is the optical system, which determines the CECE beam pattern in the plasmas and collects the emis-sion. This system is composed of two in-vessel mirrors (parabolic and flat), ex-vessel lens and scalar horn antenna. The installed in-vessel mirrors are shown in Figure 2(a). The second part of the diagnostic is the receiver. The CECE receiver consists of an RF and an IF section. The RF section accepts high frequency signals (230-248 GHz)
C
Owned by the authors, published by EDP Sciences, 2015
Figure 2. (a) In-vessel optical system for CECE diagnostic in C-Mod (b) front-end components for selecting 2ndharmonic EC
emission (232-248 GHz)
and downshifts these signals to the intermediate frequency (IF) range (2-18 GHz). The components in the RF section and the first amplifier for 2-18 GHz signals are installed in front of the diagnostic port as shown in Figure 2(b). The current CECE IF section has 8 channels, two of which are tunable (6-18 GHz). More details about Correlation ECE diagnostic in C-Mod can be found in [5] and upgrades in the IF section will be published in the future[6].
High poloidal resolution (kθ<9.8 cm−1) with CECE
at C-Mod is possible due to a small beam spot size (beam diameter, d<1 cm), and was one of the important design considerations for the diagnostic[7]. Figure 3 shows the theoretical beam pattern in the poloidal direction based on the optical components such as in-vessel mirror and ex-vessel lens. With the current optics, the measurement region is limited to the outer core region of the plasma,
ρ >0.7.
3
T
efluctuation measurements across
rotation reversals
In ohmic plasmas, there are two different confinement regimes observed. When the plasma density is lower than the critical density, the energy confinement time linearly increases with average electron density. This regime is
Figure 3.The CECE beam pattern in the plasma estimated from Gaussian beam calculations, using the focal length of the in-vessel parabolic mirror and ex-in-vessel lens.
called Linear Ohmic Confinement (LOC) regime. How-ever, when the density is higher than the critical density, the energy confinement time does not linearly increase any more with density, and is saturated. This regime is called Saturated Ohmic Confinement (SOC) regime. One hypothesis is that a change of the dominant type of turbulence is responsible for the ohmic confinement transition: Trapped Electron mode (TEM) is dominant in the LOC regime and Ion Temperature Gradient (ITG) mode is dominant in the SOC regime. Although the LOC/SOC transition has been studied extensively in the past[8–13], the transition still remains a mystery in fu-sion transport research. In previous studies, only line inte-gratednefluctuations were measured across the LOC/SOC transition[9, 13], and local turbulence changes and other fluctuating quantities, such as potential and temperature fluctuations, were not available. Thus, changes in local
Tefluctuations across the LOC/SOC transition at C-Mod are new observations, and may be helpful to explain the physics of the transition.
In order to compare Te fluctuations across the LOC/SOC transition, we studied the dependence of fluctuations on the normalized average electron density(ne/ncrit), where ncrit is the rotation reversal density[14], which defines the LOC/SOC boundary. In Alcator C-Mod, it is observed that the rotation reversal from co-current direction to counter-current direction occurs across the LOC/SOC transition. A normalized electron density less than 1 (orne/ncrit<0.85, considering the error inncrit) indicates that the plasma is in the LOC regime. In the opposite case (ne/ncrit >1.15), the plasma is in the SOC regime. Figure 4(a) shows the changes in
Tefluctuations withne/ncrit. TheTefluctuation amplitude reduction is not accompanied by changes in normalized gradient scale lengths, which all stay the same within error bars[15].
(a)
(b)
Figure 4. Time averaged relative fluctuation level versus line averaged electron density normalized to the critical density to the LOC/SOC transition (a) electron temperature fluctuation level at ρ∼0.8, black points are relative electron temperature fluctuation levels without considering density fluctuations, and red points are minimum values of the relative electron temperature fluctuation level, assuming a relative density fluctuation level of 2% (b) line integrated density fluctuation level. (Reprinted from C. Sunget al, Nucl. Fus.53083010 (2013))
it is possible that ne fluctuations can perturb the CECE measurements[16]. The black points in Figure 4(a) in-dicate the relative Te fluctuation level at ρ ∼ 0.8 with-out considering electron density fluctuations, and the red points indicate the minimum relativeTefluctuation level with a relativenefluctuation level of 2%[15]. As shown in the figure, both black and red points tend to decrease as
ne/ncritincreases. Even assuming the maximum contami-nation by largenefluctuations (∼2%) does not eliminate the observed trend in the CECE measurements.
In this study, the relativeTefluctuation level is calcu-lated by integrating the cross power spectrum in the fre-quency range where the coherent signal is observed be-tween two CECE channels. When there is no coherent signal between two CECE channels, it is assumed thatTe fluctuation level is at or below the minimum level which can be resolved through correlation analysis. More details about the calculation ofTefluctuation level is described in [15].
It is interesting to compare and contrast the changes inTefluctuations andnefluctuations across the LOC/SOC transition. Figure 4(b) shows the relative line-integrated
nefluctuation level measured with Phase Contrast
Imag-0.0 0.2 0.4 0.6 0.8
-4 -2 0 2 4 6 8 10
Toroidal Rotation [kHz]
ρ
1120221012 0.9<t<1.2
1120221011 0.9<t<1.2
0.0 0.2 0.4 0.6 0.8
-4 -2 0 2 4 6 8 10
Toroidal Rotation [kHz]
ρ
1120626023 0.9<t<1.4
1120626028 0.9<t<1.4
C oher enc e(γ) of Te fluc tuation 0.02 0.04 0.06 0.10
100 200 300 400 500 f (kHz) 0.00 0.08 0 0.12 statistical limit C oher enc e(γ) of Te fluc tuation 0.02 0.04 0.06 0.10
100 200 300 400 500 f (kHz) 0.00 0.08 0 0.12 statistical limit ce
ce 01 02 1120626028_900_1400
ce
ce
01 02 1120626023_900_1400
C oher enc e(γ) of Te fluc tuation 0.02 0.04 0.06 0.10
100 200 300 400 500 f (kHz) 0.00 0.08 0 0.12 statistical limit ce ce
01 02 1120706018_800_1300
C oher enc e(γ) of Te fluc tuation 0.02 0.04 0.06 0.10
100 200 300 400 500 f (kHz) 0.00 0.08 0 0.12 statistical limit ce
ce 01 02 1120706019_800_1300
Ohmic plasmas RF heated L-mode
Low ne (LOC)
Low ne
High ne
High ne (SOC)
Low ne (LOC)
High ne (SOC)
Low ne
High ne
(a) (b)
(c) (d)
(e) (f )
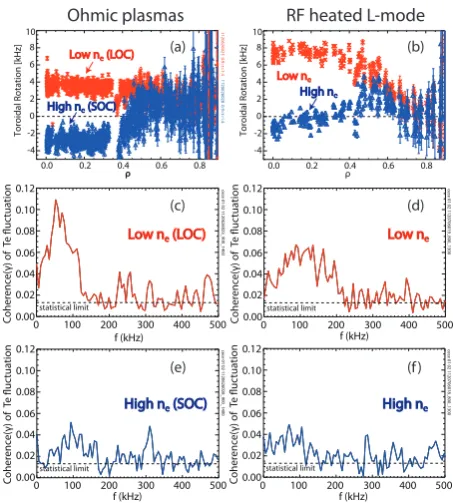
Figure 5. Changes inTefluctuations across rotation reversals in
ohmic and RF heated plasmas. Toroidal rotation profile with the change of electron density in (a) ohmic plasmas, (b) RF heated L-mode plasmas. Coherence spectrum ofTefluctuations in (c)
the low density ohmic plasma (LOC plasma), (d) the low density RF heated L-mode plasma, (e) the high density ohmic plasma (SOC plasma), (f) the high density RF heated L-mode plasma
ing diagnostic[17] in the same plasmas. Since it is known that low frequency fluctuations from PCI measurements come from the edge[13], we need to eliminate low fre-quency signals to estimate the corenefluctuations. How-ever, there are no clear criteria for the cutofffrequency to choose, so we used different cutofffrequencies. Regard-less of the frequency range used for PCI analysis, there is no trend in relative line-integratednefluctuation level. Thus, in C-Mod ohmic plasmas, we observe a decrease of
Tefluctuations atρ∼0.8 across the LOC/SOC transition with no clear change in relative line-integratedne fluctua-tion level.
transport corresponding to rotation reversal, as suggested in [20].
Related to the Te fluctuation measurements in the ohmic confinement transition, there are two questions for future work.
The first question concerns the cause of the reduction ofTefluctuations in the SOC regime compared to the LOC regime. As shown in the appendix (Section A),Te fluctua-tions mainly come from non-adiabatic electron response due to trapped electrons, so CECE measurements have been predicted to be sensitive to TEM turbulence[21]. In both ohmic and RF heated L-mode plasmas, as a plasma moves from LOC to SOC (or low to high density) with the same input ohmic (or RF) power, asneincreases, there is a decrease of electron temperature, reducing electron col-lisionality. The decrease of collisionality will suppress the non-adiabatic response and TEM turbulence. Thus, it is possible to interpret the reduction of measured tempera-ture fluctuations as being due to a reduction of TEM tur-bulence due to the increase of collisionality, which would support the hypothesis about the LOC/SOC transition. However, these measurements do not necessarily imply a change of dominant turbulent mode across the LOC/SOC transition, as suggested by past authors[1, 10, 20]. The change of turbulence across LOC/SOC transition should be studied through gyrokinetic analysis. Initial simulation results from linear stability analysis indicate no change of dominant mode within the uncertainty of input parameters in the simulation[15]. In order to investigate the role of the TEM mode, the sub-dominant modes in gyrokinetic sim-ulations should be studied. Since there is no pure TEM or ITG mode in the real experiments, for more realistic picture of turbulence changes across the LOC/SOC tran-sition, non-linear gyrokinetic simulations should be per-formed. Without these studies, the interpretation of the CECE measurements will be inconclusive.
The second question will be whether the reduction of
Tefluctuations is localized or occurs globally. It is note-worthy that rotation reversal occurs deeper in the core re-gion as shown in [14] while the change inTefluctuations near the edge (ρ ∼ 0.8) was observed. From the mea-surements in both ohmic and RF heated L-mode plasmas, the correlation between the core rotation reversal and the change inTefluctuations near the edge was shown, but the details in causality between these two observations are still unknown, and it is inconclusive regarding the effect of the change in localTefluctuations on the global ohmic con-finement transition. Future CECE measurements deeper in the core region where rotation reversal occurs will shed light on these questions, and will be performed in the fu-ture.
4
T
efluctuation measurements in C-Mod
I-mode plasmas
I-mode is a steady state high energy confinement regime with H-mode energy confinement and L-mode particle confinement[22]. I-mode has desirable characteristics as an operation regime in ITER and future devices. For
fu-sion energy production, high energy confinement is re-quired, but high particle confinement is undesirable in high performance plasmas (burning plasmas) due to helium ash accumulation[22]. I-mode has only a thermal transport barrier, without a particle transport barrier. Large ELMs are also naturally suppressed in the I-mode plasmas, which makes I-mode good candidate for burning plasmas in the future. I-mode also has little degradation of energy con-finement with input heating power, while H-mode has a relatively strong degradation in energy confinement with input heating power (τE ∝P−in0.7)[22]. Here, however, we are interested in studying the natural separation of energy and particle transport in I-mode from a basic physics per-spective.
In order to understand the transport phenomena in I-mode, most studies focus on the edge and pedestal region [23–25], and the study of how the core plasma and edge plasma are coupled has not been explored in detail in high confinement regimes.
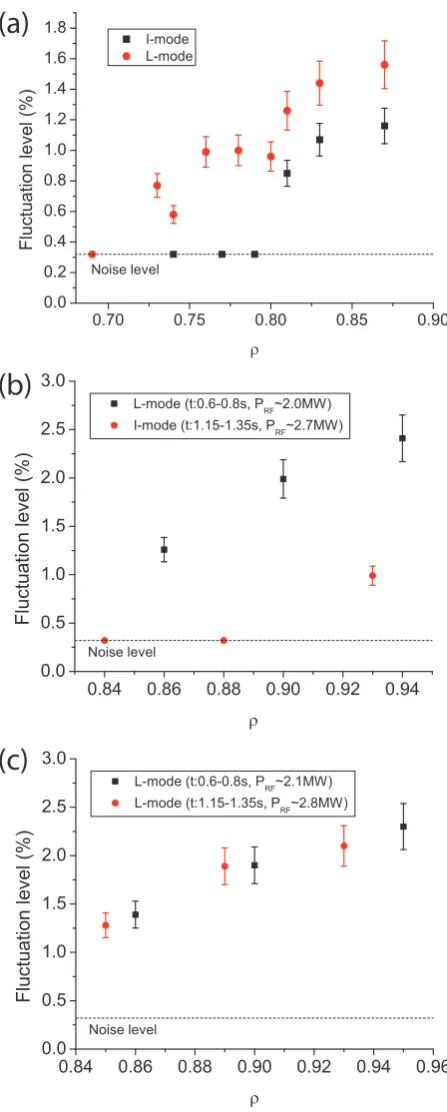
Using the CECE diagnostic, the change ofTe fluctu-ations inside the pedestal region in the core plasma was explored. The Te fluctuation profiles in L-mode and I-mode plasmas were measured by scanning the measure-ment position with a slight change of toroidal magnetic field with the same discharge parameters in each confine-ment mode. As shown in Figure 6(a),Tefluctuation levels decrease in I-mode plasmas compared to L-mode plasmas over the entire CECE accessible measurement region in-side the pedestal(0.7 < ρ < 0.9). In both L/I mode plas-mas,Tefluctuations tend to decrease in the inner region, and no fluctuations above the noise level were found in
ρ <0.8 region in I-mode plasmas.
Another interesting observation is shown in Fig-ure 6(b) and (c). In C-Mod, I-mode is usually accessed by the increase of ICRF heating power. In Figure 6(b), I-mode was obtained with the increase of RF power after time, t>1.15 s, and we can observe clearly the reduction ofTefluctuations across the L/I transition. In Figure 6(c), we show an example of a discharge where the increase of ICRF input power was the same as that in Figure 6(b) but the plasma remained in L-mode. In this case, theTe fluctu-ation levels after the ICRF power increase are comparable to the level before the change in ICRF power. These obser-vations indicate thatTefluctuations inside pedestal regime are reduced in I-mode plasmas compared to L-mode plas-mas; not as a result of increased RF power, but due to the changes in transport across the L/I transition. We note that these I-mode results are consistent with the observations in H-mode in DIII-D[26]. These measurements and analysis results imply that reductions in core turbulence in I-mode and H-mode are important and should be investigated.
5 Summary
Using a new CECE diagnostic in Alcator C-Mod, localTe fluctuations have been measured in various plasma condi-tions, which gives valuable information for plasma trans-port research. First, we observed the reduction of relative
(b)
(a)
(c)
Figure 6.(a) The change inTefluctuation profile across the L/I
transition (Reprinted from M. Greenwaldet al, Nucl. Fus. 53 104004 (2013)). (b) The change inTe fluctuations in the L/I
transition discharge (c) The change inTefluctuations in the
L-mode discharge with RF power change
line integratednefluctuations. In RF heated L-mode plas-mas,Tefluctuations atρ ∼0.8 were also reduced across rotation reversals with the increase of electron density. In both ohmic and RF heated L-mode plasmas, we observed the correlation between core rotation reversals and local
Tefluctuations atρ∼0.8. These observations suggest that the change of turbulence may be linked to the change in momentum transport, but more work is needed to under-stand the mechanisms.
The cause of the reduction in Te fluctuations across LOC/SOC transition is still inconclusive. Since CECE measurements are sensitive to non-adiabatic electron re-sponse, the suppression of non-adiabatic electron response through the increase of collisionality may explain these measurements, but further analysis is required. We also need to know the extent of the region whereTe fluctua-tions change across LOC/SOC transition. If onlyTe fluc-tuations near the edge are changed, it will indicate the lo-cal turbulence change near the edge is correlated with the global confinement transition and core rotation reversal. The CECE measurements in this study were performed at
ρ∼0.8. Observations deeper in the core region will shed light on both LOC/SOC transition physics and the connec-tion between momentum transport and energy transport, and will be performed in the future.
We also observed the change ofTefluctuations inside the pedestal region in I-mode plasmas. The coreTe fluctu-ations in I-mode plasmas are reduced compared to the fluc-tuations in L-mode plasmas. From the comparison of Te fluctuations in the L/I transition discharge with the L-mode discharge with an RF power scan, we can confirm that the change ofTefluctuations is associated with the change of confinement regime, not the change of RF power. CECE measurements in I-mode plasmas imply that not only edge turbulence but also core turbulence in I-mode should be investigated to understand L/I transition physics.
As shown in this paper, the CECE diagnostic in C-Mod has provided meaningful information for transport research in C-Mod. Through upgrades for deeper core measurements, we can expect that CECE measurements will be useful for future studies.
A Non-adiabatic electron response in
T
efluctuations
A first order electron velocity distribution function per-turbed by turbulence has two parts as shown in Eq. 1.
fe(v)=eφ
TefMe+h
(v) (1)
where fMeis a Maxwellian distribution function for elec-trons andφis the turbulent electrostatic potential.
The first term on RHS in Eq. 1 represents an adiabatic (or a Boltzmann) electron response, and the second term shows a non-adiabatic electron response. The electron en-ergy and density fluctuations will be defined as Eq. 2 and Eq. 3, respectively.
˜
E=
1 2mev
2
˜
ne=
fe(v)dv (3)
In the first order approximation, electron temperature fluctuations can be extracted from electron energy fluctua-tions as shown in Eq. 4-6.
E+E˜=3
2(ne+n˜e)(Te+T˜e) (4)
where E,neandTeare quantities in the equilibrium state, andE=3
2neTe.
˜
E∼3
2(˜neTe+T˜ene)= 3 2neTe(
˜
ne
ne +
˜
Te
Te
) (5)
˜
Te
Te ∼
2 3
˜
E
neTe−
˜
ne
ne
(6)
Then,Tefluctuations can be calculated from the defi-nition of ˜Eand ˜ne. The first and second terms in Eq. 6 will be calculated as Eq. 7 and Eq. 8, respectively.
2 3
˜
E
neTe =
2 3neTe
1 2mev
2f
e(v)dv
= 2
3neTe
1 2mev
2[eφ
TefMe+h
(v)]dv
=eφ
Te+
2 3neTe
1 2mev
2
h(v)dv (7)
˜
ne
ne =
1
ne
fe(v)dv
= 1
ne
[eφ
TefMe+h
(v)]dv
=eφ
Te+
1
ne
h(v)dv (8)
Using the results in Eq. 7 and 8, Te fluctuation level is represented as Eq. 9
˜
Te
Te ={
eφ
Te+
2 3neTe
1 2mev
2
h(v)dv} − {eφ
Te +
1
ne
h(v)dv}
= 2
3neTe
1 2mev
2
h(v)dv− 1
ne
h(v)dv
(9)
As shown in Eq. 9, the non-adiabatic electron response is dominant inTefluctuations.
References
[1] F. Wagner, U. Stroth, Plasma Physics and Controlled Fusion35, 1321 (1993)
[2] C. Watts, Fusion Science and Technology 52, 176 (2007)
[3] G. Cima, et al., Physics of Plasmas2, 720 (1995) [4] S. Sattler, H.J. Hartfuss, Physical review letters72,
653 (1994)
[5] C. Sung, et al., Review of Scientific Instruments83, 10E311 (2012)
[6] N.T. Howard, et al., Submitted to Review of Scien-tific Instruments (2014)
[7] A. White, et al., Plasma Physics and Controlled Fu-sion53, 115003 (2011)
[8] R.R. Parker, et al., Nuclear Fusion25, 1127 (1985) [9] X. Garbet, et al., Nuclear Fusion32, 2147 (1992) [10] C.L. Rettig, et al., Physics of Plasmas8, 2232 (2001) [11] B. Esposito, et al., Plasma Physics and Controlled
Fusion46, 1793 (2004)
[12] D.L. Brower, et al., Physical Review Letter 59, 48 (1987)
[13] L. Lin, et al., Plasma Physics and Controlled Fusion
51, 065006 (2009)
[14] J.E. Rice, et al., Nuclear Fusion51, 083005 (2011) [15] C. Sung, et al., Nuclear Fusion53, 083010 (2013) [16] T.D. Rempel, et al., Review of Scientific Instruments
65, 2044 (1994)
[17] M. Porkolab, et al., IEEE Transactions on Plasma Science34, 229 (2006)
[18] M.L. Reinke, et al., Plasma Physics and Controlled Fusion55, 012001 (2013)
[19] A.E. White, et al., Physics of Plasmas 20, 056106 (2013)
[20] J.E. Rice, et al., Physics of Plasmas 19, 056106 (2012)
[21] C.E. Thomas, R.F. Gandy, Review of Scientific In-struments61, 3570 (1990)
[22] D.G. Whyte, et al., Nuclear Fusion 50, 105005 (2010)
[23] A.E. White, et al., Nuclear Fusion51, 113005 (2011) [24] A.E. Hubbard, et al., Physics of Plasmas18, 056115
(2011)
[25] I. Cziegler, et al., Physics of Plasmas 20, 055904 (2013)