DISTANCE AND THE PATTERN OF
INTRA-EUROPEAN TRADE
W. Beckerman
THE
basic question to which this paper is
addressed is "What is the importance of distance in determining the pattern of Western European trade?" The importance of distance in the pattern of trade has, of course, always been recognized. The assumption of "no trans- port costs," which has always been necessary in expositions of theories of international trade, is a recognition of the fact that transport costs, that is, the costs of covering distance, exist and are significant; so that abstraction from them has to be made quite explicitly in order to analyze other elements such as factor endow- ments.'
First, it is necessary to abstract from the ef- fect on the pattern of trade related simply to differences in the size of countries. Thus, Ger- many's imports from Greece are likely to be smaller than Germany's imports from France simply because the total exports of Greece are small relative to the total exports of France. Therefore, in order to explain the distribution of Germany's imports in terms of factors other than the relative size of the supplying coun- tries, say, in terms of distance, relative prices, relative incomes, the data have to be corrected to eliminate the effect of differences in the size of the trade of the various countries. This may be done by adjusting every country to an "(equal importer" or "equal exporter" basis. The framework used for this adjustment is as follows.
To facilitate statistical work, Western Eu- rope is defined as the member countries of the O.E.E.C. The intra-European trade of these countries is arranged in the form of a trade matrix. The data used are the f.o.b. export figures as recorded by the exporting countries. Then in order to examine first the distribution
of each country's imports, all countries have been put on an "equal exporter" basis. To do this the elements in all the rows (exports) of all the countries have been multiplied by the coefficients (one for each row) required to
bring the row totals up to (or down to) ioo.
Similarly, in order to examine the distribution of each country's exports, the data have to be adjusted to put each country on an "equal im- porter" basis by adjusting the columns relating to each country in such a way that they all total ioo. The principal tables are in the form of trade matrices; there are two tables for each year examined, one in which the countries are adjusted to "equal exporter" basis, and one in which they are adjusted to "equal importer" basis. Three years have been covered in this
study, namely, 1938, I948, and I953. The
tables for I938 and I953 are shown in full in
the Appendix. The tables for I948 can be sup-
plied by the writer upon request.
Concentration of trade. Before proceeding to analyze statistically the basic tables, certain features are immediately apparent. One of these is the abnormality of the distribution of the figures. Consider, for example, Appendix Table ia and examine the column for, say, Sweden. Fourteen other countries are listed as exporters to Sweden, so that if Sweden's im- ports were distributed evenly among them,
each would account for 7.15%o of her imports.
(The discussion will proceed in terms of the equal importer or equal exporter basis unless otherwise specified.) If the distribution were not perfectly even but varied more or less ac- cording to some normal distribution, one would expect an accumulation of figures round the 7 per cent level, with few figures at either very high or very low percentages. In fact, as can be seen from the table, the reverse is the case. The figures seem to accumulate at the extremes
- at high percentages (i6.7% from Iceland,
i6.7 % from Norway, I2.0 % from Germany)
or at low percentages (I.07% from Greece,
0.07% from Ireland, 2.4 % f rom' Turkey).
311
I A recent article by W. Isard and M. Peck contains
some empirical evidence of the importance of transport costs in trade within the United States. This article also contains reference to related studies, such as that carried out in the
1920's by the German National Bureau of Statistics. See Isard and Peck, "Location Theory and International and Interregional Trade," Quarterly Journal of Economics,
THE REVIEW OF ECONOMICS AND STATISTICS
Sweden is not exceptional in this respect. The result is that, taking all the countries to- gether, there is a relatively high number of very high or very low percentages, that is to say, high or low compared with the average of
7.I5 per cent.2 This can be seen in the fre-
quency distribution in Table i. In short, after
correcting for differences in the sizes of all countries' total imports and exports, imports and exports do not tend to be distributed in a statistically normal fashion among the other countries.
TABLE I. - FREQUENCY DISTRIBUTION OF ADJUSTED
PERCENTAGE DISTRIBUTION OF INTRA-EUROPEAN
TRADE, I938
Class Imports Exports Class Imports Exports
0-i% 44 45 7- 8% 9 7
I-2% I5 23 8- 9% I0 II
2 -3%0 20 25 9-I0% 2 II
3-4% 23 I5 Io-II%o 6 3
4- 570 25 I9 II-I2% 5 0
5-6%o 12 I3 I2-I3% 8 5
6-7% I0 I4 I3+% 37 35
SOURCE: Appendix Tables ia and ib.
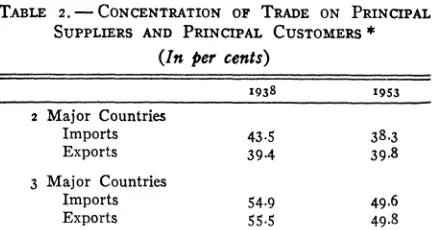
The concentration of each country's trade may be represented by considering, for each country, what percentage of imports is sup- plied by the two or three most important sup- pliers of its imports. The results of such a calculation vary, of course, from country to country. The averages for all Member coun-
tries are shown in Table 2.
TABLE 2. - CONCENTRATION OF TRADE ON PRINCIPAL
SUPPLIERS AND PRINCIPAL CUSTOMERS *
(In per cents)
1938 '953
2 Major Countries
Imports 43.5 38-3
Exports 39.4 39.8
3 Major Countries
Imports 54.9 49.6
Exports 55.5 49.8
* Average percentage, for all O.E.E.C. members, of total intra-
European imports/exports covered by major suppliers/customers.
These figures suggest three conclusions: (I)
there is a striking degree of concentration of each country's trade on a small range of other
countries, (2) the degree of concentration has
declined somewhat between I938 and I953,
and (3) both these conclusions apply equally
to imports and exports. Table 2 is only a rough
guide, however, to the degree of concentration. Table 3 gives the Gini coefficients for imports
and exports in I938 and I953, showing how far
from a Lorenz curve distribution the trade per- centages are. (Zero would measure equal dis- tribution; unity would measure complete con- centration.)
Table 3 confirms the conclusions, already
reached on the basis of Table 2, concerning the
approximate equality of concentration of im- ports and exports and the decline in concentra-
tion between I938 and I953.3
TABLE 3. - GINI COEFFICIENT OF CONCENTRATION FOR
TRADE OF O.E.E.C. MEMBER COUNTRIES
1938 1953
Imports .507 .442
Exports .522 *443
Concentration and distance. We have seen the strong tendency of countries to concentrate their trade on a few other countries rather than spread it evenly. An even distribution would, in fact, be rather surprising, for various rea- sons. The object of this study, however, is simply to investigate the relationship between the manner in which the trade is distributed and the relative distances between countries.
The concept of "economic distance" relates to the cost of transversing distance rather than the actual mileage involved. Unfortunately, countries cannot be regarded as occupying only points in space between which the distances to be converted into economic distances are easily measured. Countries occupy large areas, and the concept of distance between areas depends
2The arithmetic mean is 7.I5% for imports and 6.68% for exports in 1938. This is because in I938 there are no Austrian trade figures, so that as the tables are based on export data for all countries Austria appears only as a destination of exports (as an importer) and not as an ex- porter.
' Examination of the basic data (see Appendix) shows that the reduction in concentration is partly due to the changed relationship in the trade between Ger- many on the one hand and Greece and Turkey on the other. But the decline in trade concentration between I938 and
on such considerations as whether we conceive the distances between the areas to be the dis- tances between the closest points, or between the geometrical centers, or between their "centers of gravity" as determined by some system of weighting.
For purposes of measuring the cost of trans- porting a commodity from one country to an- other, the appropriate concept would appear to be a mixture of these alternative measures. Products are likely to be shipped (or entrained) between points as proximate as possible. But the availability of harbor or railway facilities determines what is possible. On the other hand, somebody has to bear the cost of transporting the goods from the source of production to the export point, and from the import point to the final destination. This means that though in
country I, port A may be nearer to country 2
than port B, the goods being exported to coun-
try 2 may be produced very near to port B and
a long way from port A. This qualification to distance brings us closer to the "center of grav-
ity" concept - of course it is the economic
center of gravity, rather than the physical cen- ter of gravity, that is relevant.4
Finally, even if there were some unique dis- tance between countries in terms of some unit of distance such as miles, there is the problem of allowing for variation in the cost of alterna- tive means of transport. The main problem here is the difference between sea and rail trans- port. While France is adjacent to Belgium the cost (per unit weight) of rail transport from the source of production in France to the final location of consumption in Belgium may be greater than the cost (per unit weight) of trans- port of some product manufactured in London and consumed in Oslo and which is therefore transported almost entirely by sea.
Before proceeding to a more detailed anbalysis
of the relative distance between the countries represented in the basic tables, an assessment has been made, for each country, of which two or three countries are "nearest" to it in the sense described above. (The actual ordering of countries on which this selection has been based is shown in Table 5 below.) To do this an esti- mate has been made of the percentage of trade of each country going to the two or three nearest countries. The results for the average of O.E.E.C. Member countries are shown in Table 4a.
TABLE 4a. - CONCENTRATION OF TRADE ON NEAREST COUNTRIES '
(In per cents)
1938 1953
2 Nearest Countries
Imports 27.9b 26.5
Exports 28.4 26.2
3 Nearest Countries
Imports 34.9 b 34.5
Exports 36.7 33.0
a Average percentage, for all O.E.E.C. members, of total intra- European imports/exports of each country coming from/going to the two or three nearest countries.
b See footnote 2 above.
As it stands, however, Table 4a cannot ac- curately show the difference in the degree to which trade is concentrated on neighbors as be- tween two and three countries, for even if there were no correlation at all between relative dis- tance and concentration the percentage of trade covered by any three countries would be greater than that covered by any two coun- tries. This, and other incomparabilities, means that the data have to be standardized by divid- ing all the figures by the percentages of trade that would be covered anyway by the number
TABLE 4b. CONCENTRATION OF TRADE ON NEAREST COUNTRIES, STANDARDIZED DATA *
(In per cents)
I938 1953
2 Nearest Countries
Imports I.95 I.99
Exports I.99 1.97
3 Nearest Countries
Imports I.63 1.72
Exports I.83 I.64
Average percentage, for all O.E.E.C. members, of total intra- European imports/exports of each country coming from/going to the two or three nearest countries. Data standardized by procedure out- lined in text.
I This modification has important consequences. For
THE REVIEW OF ECONOMICS AND STATISTICS
of countries specified if there were a perfectly even distribution. The result of this operation is given in Table 4b.
The above table suggests the following con-
clusions: ( i ) even allowing for statistical quali-
fication there appears to be a strong tend- ency to concentrate trade on "near" countries;
(2) this tendency is not so strong, however, if
the three nearest countries are considered
rather than the two nearest countries; (3) it is
just as strong for exports as for imports; and (4) it does not appear to have declined between
I938 and I953.
Thus far we have not discussed the problem of how to measure, in practice, the relative dis- tances between countries in the sense outlined above. One possible measure would be to ex-
amine the mark-up between (i) the f.o.b. aver-
age value of exports of certain specific goods as they appear in the export statistics of countries accompanied by specification of the destination
of these exports and (2) the c.i.f. average value
of those quantities of the same goods, which are specified as being imported from the corre- sponding countries, in the- import statistics of the relevant importing countries. To take a hypothetical example, suppose that in French export statistics, exports of alcoholic bever- ages are shown by quantity and value and at the same time by destination. One could readily compute the average value (price) f.o.b. of French exports of alcoholic beverages to each main destination separately. Turning to the import statistics of each of these coun- tries in which similar data are available, one could readily compute the average value c.i.f. of their imports of alcoholic beverages from France. The mark-up for each country will vary, and the differences in this mark-up should indicate roughly the relative costs (including insurance, etc.) of sending alcoholic beverages to each of the countries concerned.5
In actual practice, this procedure is subject to several limitations, owing to various defects of international trade statistics. For example, the time period concerned may not be identical for both countries, since products may be re- corded in French export statistics long before
they are recorded in the importing statistics of the recipient countries. The exact classifica- tion of products is also not identical in all countries. There may also be substantial changes in the weight of some products (for example, tobacco) that rest in bond for a long time between being officially exported and of- ficially imported. There may be discrepancies
arising from transit trade-country A may
show, in its export statistics, that a certain quantity of some product has been exported to country B, but it is possible that a part of this amount has not been officially imported into country B at all, and that it was merely a transit transaction. If the average value of this part of the commodity in trade differs substan- tially from that of the rest then the procedure outlined above will give an incorrect result.
In view of such difficulties the above method of estimating distance has been used to obtain only a rough ordinal comparison of distances rather than a cardinal comparison. That is to say the limitations on the data enable us to say only that country A is further from country Z than is country B, but we cannot say by how much. Even the mere ordering of countries can only be carried out with a rough accuracy by this method. This is largely because, in many cases it has not been possible to find enough products giving sufficient pairs of statistics (on the import side and on the export side) for a reliable averaging of the mark-ups. A large number of observations are needed because otherwise there are inconsistencies in the re- sults. For example, according to the data for one product Germany is nearer to Greece than is Denmark, but according to the data for an- other product the reverse result may be ob- tained.
For these and other reasons the sort of data referred to above can only be used to give a rough ordering of the relative distances be- tween countries. In some cases obvious errors can be legitimately corrected by simple knowl- edge of geography. For example, the following results of percentage mark-ups is obtained for Sweden on the basis of her trade in paper and paperboard.6
' The source actually used in this study is O.E.E.C.
Country Percentage Mark-up It will be obvious from inspection that in the
Denmark - I1 absence of fully reliable statistical indicators Belgium + I% there is a considerable element of uncertainty
Norway ? 5%
Netherlands + 6% about the ordering of countries which are close Germany + 6%o together. For example, in the column relating
UIKend 9% to Belgium, the exact ordering of the Nether-
France +IO% lands, France, and Germany is liable to be
Italy +I2% erroneous. It is on account of the absence
Portugal +I4% of sufficiently reliable statistical data that not
Turkey +23%
Greece +28% all countries could be included in Table 5.
TABLE 5. RANKING OF COUNTRIES IN ORDER OF ESTIMATED ECONOMIC DISTANCE FROM SELECTED COUNTRIES'
Belgium Denmark France Germany Italy
Netherlands Sweden Belgium Austria Switzerland
France Germany Germany Switzerland Austria
Germany Norway Netherlands France France
U.K. Netherlands U.K. Netherlands Germany
Norway U.K. Portugal Belgium Greece
Denmark Belgium Norway Italy Turkey
Sweden France Sweden Denmark Portugal
Portugal Portugal Denmark Sweden U.K.
Italy Italy Italy U.K. Netherlands
Greece Greece Greece Norway Belgium
Turkey Turkey Turkey Portugal Norway
Greece Sweden
Turkey Denmark
Greece Netherlands Norway Sweden Turkey U.K.
Turkey Belgium Sweden Denmark Greece Ireland
Italy Germany Denmark Norway Italy Belgium
Portugal France U.K. Germany Portugal Netherlands
Germany U.K. Germany Netherlands Germany France
France Norway Netherlands Belgium Switzerland Norway
U.K. Sweden Belgium U.K. Austria Sweden
Belgium Denmark France France France Denmark
Netherlands Portugal Portugal Italy U.K. Germany
Norway Italy Italy Portugal Belgium Portugal
Sweden Greece Greece Greece Netherlands Italy
Denmark Turkey Turkey Turkey Norway Greece
Sweden Turkey
Denmark
a Some countries have been given a longer list than others. This depends on how many countries it has been possible to order for each selected country on the basis of the technique described in the text. It will be observed, for example, that Switzerland only appears in the columns relating to Italy and Germany, and Austria in the columns of these two countries, plus Turkey.
If one is attempting only to order the countries, one can probably improve the above ranking by, say, transposing Greece and Turkey (Turkey should be "further away" from Swe- den than is Greece), or Norway and Belgium, and so on. On the basis of evidence for other products and including any adjustments that seem to be reasonably certain, the countries were ordered as shown in Table 5.
Such inaccuracies in the ordering are just as likely to reduce the correlation coefficients which have been calculated below as to increase them.
Being limited to ranked data, the obvious
test of a relationship between distances and importance in trade is the Spearman rank cor- relation coefficient. Applied here, this coeffi- cient measures, roughly speaking, the strength of the relationship between the ranking of countries with respect to their relative distance from a given country and the ranking of the same countries with respect to their relative importance in the trade of the given country. The results obtained, for several given coun- tries, are given in Table 6.
between distance and trade, and (2) this cor-
relation appears to be about equal for imports and exports.
In order to evaluate the significance of these coefficients, however, an important point must be now introduced. Since one country's imports are another country's exports the actual dis- tribution of (say) the first country's imports will depend on a mixture of two distance ele-
ments: (i) the relative distance of every other
country to the given country, which will influ-
TABLE 6. -RANK CORRELATION COEFFICIENTS, DISTANCE AND TRADE '
Distance & change
Distance and imports Distance and exports in imports
1938 1948 1953 1938 1948 1953 1938-53
Belgium .72 .82 .85 .8i .62 .52 .75
Denmark .76 .52 .8i .87 .73 .68 .78
France .74 .X8 49 .80 .65 .I8 .26
Germany b J3 .20 .o6 .95 .77 .43 .75
(.57) (.50) (.45) (.36) (.87) (.68) (-
Italy .65 .79 .83 .50 .74 .78 .67
Netherlands .87 .83 .84 .91 I77 .90 .70
Norway .90 .85 .95 .63 .83 .78 .84
Sweden .87 .80 .67 .83 .54 .85 .78
Turkey *43 .37 .6 i .59 .45 .47 *44
U.K. .65 J15 .I8 .33 .JO *34 .o8
Arithmetic mean
Including all trade .67 .55 .63 .72 .62 .59 .54
Excluding German trade with
Greece and Turkey .72 .58 .67 .66 .63 .62
Excluding U.K. but including German trade with Greece and
Turkey .67 .6o .68 .77 .68 .62 .55
a Significance levels for the correlation coefficients are as follows: Level of
significance .I % .0%5 .02% .o I % I938 imports .458 .532 .6I2 .66i
All other figures .44I .SI4 .592 .641
b Figures in parentheses exclude trade with Greece and Turkey.
It should be noted that the right-hand column of Table 6 constitutes a check on the possibility of having made errors in the ranking of dis- tance which fortuitously increase the correla- tion coefficients. For the same distance rank- ing is, of course, used for the calculations re- lating to the pattern of trade in the given years and for the changes in the pattern over time. A distance ranking which was fortuitous from the point of view of the former would not necessarily be so from the point of view of the latter.
The last three rows in this table seem to con- firm two of the conclusions reached above,
namely, (i) there is a fairly strong correlation
ence the import pattern of the given country
in one way; and (2) the relative distance of
the given country to each other country, which will affect the export pattern of each other country and will thereby also have an effect on the import pattern of the given country.
Relative distances in the economic sense are
not symmetrical- the United Kingdom may
France, which are "nearer" the United King- dom than Ireland is.8
To sum up: since (i) relative distances will
affect both the distribution of exports and im-
ports, (2) each country's exports are some
other country's imports, and vice versa, and (3) relative distances are not necessarily sym- metrical, the final pattern of trade will be a mixture of the various pulls, the export pull against the import pull. This means that it would be most unlikely to obtain for all coun- tries high rank correlation coefficients for both imports and exports. For if, for example, im- port patterns of all countries were found to have correlation coefficients of nearly unity when compared with ranked relative distances, this would suggest that the influence of dis- tance on export patterns would be small unless there were a high degree of symmetry in rela- tive distances. That a considerable degree of symmetry must exist can be seen from the fact that in Table 6 both the import and the export coefficients are, on the whole, fairly high.
This does not mean, of course, that other determinants such as changes in relative in- comes and prices have not had any influence on trade patterns. For the correction factor used on the data (to an equal importer or equal exporter basis) has eliminated such de- terminants as regards their influence on the pattern of each country's trade in the given years and hence as regards their influence on changes in the pattern. To compare the influ- ence of distance with that of the other deter- minants would be a much more difficult prob- lem, for while the technique used above can show the influence of distance other things being equal,9 it is not possible to calculate the influence of other things (such as prices and in- comes), distances being equal, until a tech-
nique is found for adjusting data to an "equal distance" basis. For this, mere ranking is of course insufficient.
Conclusions. Apart from the specific con- clusions already mentioned above, the basic tables show a tendency on the part of the less- developed countries of Europe to concentrate their trade more than the other countries. The concentration is also very closely linked to neighboring countries. Now it is not surprising that this should be the case, since the less-de- veloped countries will, in general, have less diversified economies; this will in practice (though with no absolute theoretical neces- sity), lead to relative concentration country- wise of total trade. What is interesting is the possibility of a causal connection between de- gree of development and distance. This re- quires the notion of "absolute distance," not merely of relative distance, to and from other countries - of being, in an absolute sense, far away or near to other countries as a whole. The fact that the countries on the periphery of Europe tend to have less-developed economies
(Iceland, Portugal, southern Italy, Greece, and Turkey) may be due partly to their being simply "far away" from everybody that matters in trade.10 The Scandinavian group of coun- tries may constitute the exception that proves the rule. For the countries nearest to them are Germany and the United Kingdom, two very important traders and two countries with which they are connected by sea-passage-the cheapest form of transport. The fact that the great distance of Turkey and Greece from the major trading countries of Europe is offset by their proximity to Russia and Eastern Europe has been poor compensation, for these countries have been far less important traders than the countries of northwest Europe.
This view can, of course, be developed along many lines. The main implication in the field of the economics of underdeveloped areas, for example, is to confirm the fact that means of transport usually constitute the most useful form of overhead capital. What is important, in other words, is to be "near" other countries
s In a more formal manner one can envisage a trade matrix transformed into a matrix in which coefficients allo- cate each country's imports on the basis of the relative distance of each other country. Similarly the transforma- tion could be made to one in which coefficients apply to each country's exports. The relative strength of the result- ing two coefficients applying to each box in the matrix will determine the final value of the relevant element of the matrix.
'Roughly speaking, the correction to equal exporter basis wipes out differences in competitiveness, among other things; and the correction to equal importer basis wipes out differences in relative incomes, among other things.
- preferably important countries. The rapid
development of the Canadian economy is no doubt largely due to proximity to the United States. It is probable that the favorable pros- pects for Latin America are also related to the same cause.
As well as speculating on the future relative rates of growth in terms of nearness, it would be interesting to speculate on the effects of changes in modes of transport and transport costs. Apart from the general reduction in 'eco- nomic distances which would result from a re- duction in the costs of air freight, for example, a special problem is posed by the existence of "psychic" distance. It is probable that the manner in which the purchases of raw materials by a firm are distributed geographically will depend partly on the extent to which foreign
sources have been personally contacted and cultivated. While the transport costs paid (di- rectly or indirectly) by an Italian entrepreneur on a raw material supplied by Turkey may be no greater (as the material may come by sea) than the same material supplied by Switzer- land, he is more likely to have contacts with Swiss suppliers, since Switzerland will be "nearer" to him in a psychic evaluation (fewer language difficulties, and so on), as well as in the economic sense that air travel will absorb less of his time. The growth of air travel and freighting would not only tend to iron out dis- crepancies arising from sea versus rail trans- port (as the aircraft travel, in general, along
straight lines - or great circles) but would
* ..
99"o 'A-.
00 U~4~ 0 04 ~C C7t-.C0 --
~~
-0
~~et~~oo - it '~~~~t-oo oco ~~~~i-e4en n ,d t 0 H~'
~
C7' 0 C7en0 0 i I o0o .-C o
40 0% 1-41-4
H 0 0 RtC -d -4C C~00t 0 1
0 0 o
0CC0 O 4 00Cco t-
~(0 CO %O
~
00 -1 14
0
1-)f4 1
e4 ~~~~~~0
0%%) 00. 't r4 1-4 -
0, 0\
C-\0 \-. 06 10 -.- 00 nOt
%
~0 14%C0
\
-) Coin
0
- 0 1-40 C
6 4 6 o P4~~~0 6 Co6 6 \-.
40 ~~~~~~~~~mi '0' Co C) -
4-. 0%0 OCo 0 ~~~0 C-.Vo6o u ; 0%0() 1-i4 .C%
0 -~~~~o 6 6 - C\o
.-o o ,-
o 0o.o~ *IC~O)Cl
A4 H~~( o
C* o1-4 0-. .Ifw1-9c%Co*i' t
1-4 -- -o - Z~~~~~~~~~~~~~~~~~~~c o o ,A~ o o c
0coi0 o
~~
o o ,o0% 1d-C C ( inC 1-4 e4 % )l%~ o 00 C.. 00 C1-..Cr)041-404r) ~o-~i-xin.c0ir +~~~0
~
0 -in 0 0 CoC--0%14C-..(4 6
z- 0
Ho H . i,
0 \ 0 00 \ (4 i 0%OCoC i,t \ U) 0 '04 J)0%C
k i a \0t
in0C-.00%0 in 0- \ in 400'0
- - c~~~~~~~~~~~ - -
~
04 v oenIt\0 00t %Inr 4e
H H~
~~ ~ ~~~~~~~~~~~~~~~~
. .. ..0 la
0
0 C.. 00'- 4z 0 in4% o0 -tI- 1-4i 0 (4 (41o40 1-4 1-4
CO t1-. R)1 ocio-'"o C)-Co( o00 O'-.i
-4 0C'0%o- ~o~
~~V)c4~~ '0 Cr)1-4 (4~~~~~O V)II)4%0'0'0-, to - -, - 0 c c oXR o0coo )0
o o o o \6 9 4 4 ; o o o 0(4 00 0C c0)-.o' 0 rCI( 0jCf
~1-; 0 100~ -4 (4 -41414 ).* 0 I1- t
4-~~~~~~ 0
~ ~ ~ ~ ~ ~ ~ ~
~~~~~~~~~~~~~-~ ~ ~ ~
(41-4C) -enr-4 ON 4.4 in1-40
Z o4 )Cr% ~') \ \"0 0%4 lot
Z co-.14 - ~44 4440 q It ~~. 9 q 0 oo (4 (e4 0 4OCoO4(4Coo(4c1-40
OCo (4-0 (')C--Cf)Co cI1I4(4Co 00 0Ci .4 0 -r 0oo
0 ) 6- 0 - -
1-4Co- 0%' Cot- 1o)in-.. '0 "4 0" (4V %-'. 40 0 N0~~0N000~o ~~~'I1-4 0 m0 i o C7% 4-e (4
4-4 0
~ ~
~~~~~~~~~~~o ;6o~
0%(4C--CoCo r\0 " -\~ ~
C) C)~~~~C
0 0~~~~moo 0r -0 6 Nr 64c
CdC U
H H " en ON 0 %O N --d0 in
C) 0~~~~~~~~~
~
~~'0 0~~0~g00414'041) 140' 0~~o~~o-~-b . . . . ~~~~?
('4 14~~~~~~~~~~~~~~~~~~~~~~~~~~~~~~~~~~~~~~~~' r)0 0 4%
co o6 u; o; c6 c4 c~~ 6 '0nOOO'It1414)14 414 141
1400'tO14OO'00-.41)
to
'014 14- '14 C'4 )'100 14o 0-1 1) - I It ')4 \ 0' 0440C'41 1
H 1-4 0-4 H 8 En 4)0.I0-140 0-~'f '14-
14O0'It001)O~~~~~~~~~~~~~~~~~~~0t0') 14400000~ ~~~I-H 0 11) \ 0
0 .0 0-in"in tt m 4\
000
in in f)4co 0 0 -It00 0 0 001 41)i C'ht 144) e)14) C'0 \q00-.
C 1 in
\0 t00')C1401441)- o14I)141% 00 .
o 0 inoo 4) s
4 14 140
0-4~~~~~>
(I) 000-.1400It'014 1400 '014~~~~~~~~~~~)0-.
~~~
0000-0140014141)C' 14)I0'1414 'Itm 0%0 0 R\') 0 (O4 o'o0004914. 00 0- C' 0 \4 tr 14 'o0014't in0\r)C'o'100
144)C 't)'4 4-14101 4)1 o'o'0 I1441
- z.
o 0 1~~~~~~~~~~~~~~~~~~~~~~~~~~~~~~~~~~~~~~~~O04 %O \0.41ON.In It0% '0 00 e 1)Ze)'t0
o '0 14)4~~~~~\ 014 01414in 41)0 `- C' 0 040- n 0l w co14t 1414it
0 o o- ,ir r i U) o
'0re) % 4 0 1 \0 in0 014o1 0 0141 \8 H 0'1 44100 '4)4t-'
0 (0 0 It1441)014')14)41)~~~~~~~~~~~~~~~~~~~~~~~~~~~~~~~~~~~~~~ \ 14)"o14004 \t1'It
C. 1 00144 14t 0 4 I 0 T
!6 4 - ;6 4o.
H It tC -0 101)400't1
410000014 t 0 N l)ce)0
in "t ) 0d oin ) in" " U001) mcis en t z , 0 . ' It in)4in )1)1410 \0
0 64 4
\6
A1) U 1
14 "4141414) '041)14 14~~~~~~~~~~~~~~~~~~~~~~~~~~~~~~~ 0--0 4)1 C,,
i
0-14
t
0 14)0 0-'IO
t- 0 ci Ull) inC71, \0 0 \0 m o e4
4) C ''It in'4
Cs
I1-4 't- 'It1)'t1 1
H go \01)
to
1)00--0\ -41)' 41)-- e4) 4,l C\414\ 1 14 ;411 4 1 .
S0i. 614u ;u
~ ~
;%6i;rI-.4
C'14) It C'00 Ite' 0 14')14'0 0'0 14 140-.. 0 14) (-00140 (-41)Itm \0 41)'0 , in 41)C"0 - 0 'O 14 OC
0 in4)1 14 in1 \Cin0 re)'041)41)1 1e)'It'It 14 -? - 14'T- q '?
4 e; 6 i;)1 1~,6i4 140-~o
00 . '0~~~~~~~~~~~~~~~~~~~~~~~~~~~~~~~' 0 14~~~~~~~~~~\'Iti m H \ 14-en r \
14 1 ')itO 0014 't- N0')41'0 00 14al'0 0 4)r-% c Ho C
4) 1~ 4 \14 1\4r % l 4 l 0
0 ~~4 4~4 41'0 C'40C100-.)
$ -Cin"0 01)0in00,,0%-41)144\0 C'00 14 410 00-n' H0 --C''ot- I00 in 0--
0)0~ 140\ r 041)C0 C0 140 -0 in %O. 04 14400114'\014044
bO ;)4I0--1001't44'C1 4) 4 14 1; 6 4 14 4; -
1;416 44 1 ;6-6c4 1 0,
0 0~~~~~~~~~
00
16 16~~~~~~~~~~~~~~~~~t 0 . C Nc
0 0" H
~~' 0~~~~'10o~~ 0