DOI: http://dx.doi.org/10.26483/ijarcs.v8i7.4378
Volume 8, No. 7, July – August 2017
International Journal of Advanced Research in Computer Science
RESEARCH PAPER
Available Online at www.ijarcs.info
ISSN No. 0976-5697
EARTH OBSERVATION AND SATELLITE IMAGERY USING SPIDER MONKEY
OPTIMIZATION (SMO)
Er. Ruchi Jaswal and Dr. Harish kundra
Research Scholar ,Head of Department
Department of Computer Science.&Engg, Rayat College Of Engg. & IT, Ropar, Punjab, India
Abstract: Remote Sensing Image classification is one of the major research areas due to its wide spectrum of applications including natural terrain feature classification, land use monitoring, ground water exploration, environmental disaster assessment and urban planning etc.Various Swarm Intelligence Techniques, nature inspired and some other intelligent techniques have been used in the field of remote sensing image classification. The various Artificial Intelligent techniques used in the area are Genetic Algorithm, Particle Swarm Optimization (PSO), Artificial Bee Colony optimization (ABC), Ant Colony Optimization (ACO), Cuckoo Search (CS) and also hybrid techniques of these for image classification& they also provide accuracy. An extensive research has been done in this field to classify various features of the image. Throughout feature extractions efforts can be made in direction of identifying all these features and classify the remote image areas consisting of, to get more efficiency than existing methods by means of spider monkey optimization a recent artificial intelligence technique. We used Artificial Intelligence Techniques in image classification of Natural Terrain features & using Spider Monkey Optimization (SMO) for Image Classification
Keywords: Image Classification, Spider Monkey Optimization (SMO), Particle Swarm Optimization (PSO), Artificial Bee Colony optimization (ABC), Ant Colony Optimization (ACO), Cuckoo Search (CS)
1. INTRODUCTION
1.1Image Classification in Remote Sensing
Image classification refers to the task of extracting information classes from a multiband raster image. The resulting raster from image classification can be used to create thematic maps. Depending on the interaction between the analyst and the computer during classification, Digital image classification techniques group pixels to represent land cover features. Land cover could be forested, urban, agricultural and other types of features[1]. There are three main image classification techniques.
1.2 Image Classification Techniques in Remote Sensing • Unsupervised image classification
• Supervised image classification
• Object-based image analysis
Pixels are the smallest unit represented in an image. Image classification uses the reflectance statistics for individual pixels. Unsupervised and supervised image classification techniques are the two most common approaches. However, object-based classification has been breaking more ground as of late.
1.2.1 Unsupervised Classification: Pixels are grouped based on the reflectance properties of pixels[2]. These groupings are called “clusters”. The user identifies the number of clusters to generate and which bands to use. Unsupervised classification is where the outcomes are based on the software analysis of an image without the user providing sample classes. The computer uses techniques to determine which pixels are related and groups them into classes. The user can specify which algorithm the software will use and the desired number of output classes but otherwise does not aid in the classification process.
However, the user must have knowledge of the area being classified when the groupings of pixels with common characteristics produced by the computer have to be related to actual features on the ground.
1.2.2 Supervised Classification
The user selects representative samples for each land cover class in the digital image. These sample land cover classes are called “training sites”[2]. The image classification software uses the training sites to identify the land cover classes in the entire image.
The classification of land cover is based on the spectral signature defined in the training set. The digital image classification software determines each class on what it resembles most in the training set. The common supervised classification algorithms are maximum likelihood and minimum-distance classification. Supervised classification is based on the idea that a user can select sample pixels in an image that are representative of specific classes and then direct the image processing software to use these training sites as references for the classification of all other pixels in the image.
1.2.3 Object-Based (or Object-Oriented) Image Analysis Classification
Object-based image analysis supports the use of multiple bands for multi-resolution segmentation and classification. For example, infrared, elevation or existing shape files can simultaneously be used to classify image objects. Multiple layers can have context with each other. This context comes in the form of neighborhood relationships, proximity and distance between layers.
1.4 Remote Sensing:
Remote Sensing[3][4] is the technology to sense, observe and measure any object on the Earth surface using data acquired from Geo spatial Satellite without any physical contact to that object and displays those measurements over a two dimensional Spatial Grid i.e. Image. So, Image classification plays an important role in the field of Remote Sensing for recognizing different Terrain features. The intent of classification process is to categorize all the pixels of multispectral images into all the terrain features for almost all the regions like water, vegetation, urban, barren and rocky. The dataset included for the experimentation is of Alwar region existing in Rajasthan, India. Seven band satellite images of the Alwar region are used for the implementation of the concept.
Remote sensing (RS) data provides its ability for a synoptic view, repetitive coverage with calibrated sensors to detect changes, observations made at different resolutions provides a better management of resources. Extraction of land cover map information from remote sensed images is a very important task of RS technology. Hence, in the above context, accurate image classification results are a prerequisite. Remote sensing imagery with high resolution data (spatial, spectral, radiometric and temporal)[5] have made analysts to constantly explore the image processing and data mining techniques to exploit their potential in extracting the desired information efficiently from the RS data to improve classification accuracy. Moreover, obtaining satisfactory classification accuracy over urban! semi urban land use/ land cover (LU/ LC) classes, lack of fixed network and the nature of nodes give rise to challenges for robust and reliable data particularly in high spatial resolution images. Because, it is intuitive from the simple visual observation that urban semi urban areas comprise of roof tops made of reinforced concrete slabs, clay tiles, corrugated plastic, fiber and asbestos sheets, parking lots, highways, interior tar roads, vegetation, lawn, garden, tree crowns, water bodies, soil, construction sites [6].
2. COMPUTATIONAL INTELLIGENCE BASED CLASSIFICATION TECHNIQUES
A. Artificial Bee Colony Optimization[7]
This optimization technique is developed by Karaboga due to his innovative vision to notice the collective behavior of Honey Bees. ABC consists of three types of work groups depending upon their work experience are Scout Bees, Onlooker Bees and Employed Bees. Firstly employed bees fly for the food search (i.e. pollen and nectar) in a particular direction. If they find any nectar source, then these employed bees come back to hive and share their information with other onlooker bees. Information exchange process in bees is carried out by a dancing ritual well known as “Wangle dance”. Then onlooker bees follow the employed bees to get the food source.
In ABC, the main parameters considered to find optimized solution are probability value of food source, distance between the food source & hive and number of iterations. B. Cuckoo Search
Cuckoo Search [8](CS) is swarm intelligence based nature inspired algorithm developed by Yang and Deb. It is based on the clever behavior of cuckoo bird to lay their e reproductive egg in other bird’s similar nest. They lay their egg in a parasitic manner. The only possibility to survive the egg is adaptation of host nest. The process of finding the similar nest is done by random with the help of Levy flight. Finally, the quality nest is kept to find the best solution of optimization problem.
C. Fuzzy Set Theory
Fuzzy logic[8] was introduced by Zadeh in 1965. But fuzzy set theory has proved the existence of such a system other than binary true and false values. In Fuzzy Set Theory, values/ things can be lying in between true and false.With Fuzzy logic, we can also capture some of the uncertainties like thinking, reasoning, vagueness etc. Various intelligence features like easy to understand; flexible in nature; capability to tolerant the imprecise data; ability to build on the basis of expert experience etc force it to fall in computational intelligence category.
D. Rough Set Theory
Rough set[8] concept is a pragmatic mathematical tool to reason about uncertainty caused by vagueness and imprecision due to granularity in the domain of discourse. Rough set theory deals with the approximation of sets that are difficult to describe with the available information. In order to deal with the incomplete, imprecise and vague information in classification concept formulation, Pawlak put forward his main idea in his work. Yao studied Pawlak’s rough sets through the topological properties of lower &upper approximation operations.
E. Membrane Computing
It is a bio-inspired computing technique in which membrane issued as interface model. After the successful consideration of loving cells as the Protected Reactors, Membrane Computing [9] came into existence. It is the computing inspired by the features of biological membranes. There is the existence of compartments in membrane having placement of multi-sets ofobjects that have to follow some “Reaction Rules” for the movement of objects in membrane. In membrane computing, we explore the features of membrane and model them for computation purpose. A skin membrane consists of skin, elementary region, main region and outside space is environment. For computational problem, objects are taken and applied with a Rule model to find the optimal solution.
F. Minimum Distance Classifier
It is a supervised image classifier that fall under the category of computational intelligence due to its intelligent behavior to classify a computational image. The unknown image data can be classified into different classes with the help of MDC[9]by minimizing the distance between the feature class and image data. In MDC, each class is represented by its mean vector and new objects are classified by finding the closest mean vector.
G. Maximum Likelihood Classifier
into its representative class. MLC form a decision function for each class and represented by mean vector and covariance matrix. Maximum Likelihood Classifier[9] assumes a normal distribution and calculates the variance and correlation value for the classification of unknown pixel. The initial assumption indict is to have all the vectors from the same field. Due to intelligent and learning ability of computational Intelligence based techniques all of these techniques can be applied for remote sensing image classification into various classes like Water, Vegetation, Urban, Rocky and Barren etc. In classification process, first of all a satellite image is taken and training set is generated from that image. Then, the different classifiers can be used for extraction of rules to classify the image into various classes.
3. REVIEW OF LITERATURE
Kundra and Rana (2015) [1]implemented new approach in order to find optimized path which is different from the conventional approaches. The newly developed approach acknowledged the problems like terrain mapping, obstacle detection and avoidance, and goal seeking in cross-country using Swarm Intelligence. A combination of techniques PSO (Particle Swarm Optimization) for finding out the natural paths moreover keeping the obstacle detection from the satellite image, and BCO (Bee Colony Optimization) algorithm for obstacle avoidance and shortest path to the goal was used b the authors.
Prashar and Kundra (2015)[2]implemented image classification technique using SURF descriptor and SVM classifier. SURF method which is advanced version of SIFT was used to match feature points of training and test images. SVM classifier based on the outcome of feature points then classified images. Through the experiment and analysis of results, better results were achieved in terms of accuracy and matching time.
Woo et. Al. (2014)[3]focused on the computational intelligence approach to classify and detect building, foliage, grass, bare-ground, and road of land cover. They proposed a method, which has a high accuracy on classification and object detection by using multi-class AdaBoost algorithm based on a combination of two extracted features, which are co-occurrence and Haarlike features. With all features, multi-class Adaboost selects only critical features and performs as an extremely efficient classifier. Experimental results showed that the classification accuracy is over 91% with a high resolution satellite image.
Chandrakala and Amsayeni (2013)[4]classified the satellite images into 3 different regions as water, urban and Greenland. The process involves two steps, first training the class images and second classifying the testing image which consist of all the classes based on training image. Speed up Robust Features (SURF) was used to enhance the performance over low level features like mean and standard deviation. Topic modeling concept was used to obtain Bag of Features (BoF) with Latent Dirichlet Allocation (LDA) algorithm. Threshold value for each class was obtained from BoF and compared with testing image feature values in order to classify it. Experiments were conducted on LANDSAT 7 images obtained from Google earth.
Jayanthet. al. (2015)[6]studied and described that the attempts to classify remote sensed data with traditional statistical classification technique faced number of
challenges as the traditional per-pixel classifier examine only the spectral variance ignoring the spatial distribution of the pixels, corresponding to the land cover classes distribution of the pixels, corresponding to the land cover classes and correlation between bands causes problems in classifying the data and its result. The author’s used artificial bee colony to improve the performance of classification of data, based upon swarm intelligence to characterize, spatial variations within imagery as a means of extracting information forms on the basis of object recognition and classification in several domains avoiding the issues related to band correlation. The belonging to the classes and other artificial intelligence results showed that ABC algorithm brings improvement of 5% achieved in overall classification accuracy at 6 classes on comparison with MLC.
Singh et. al. (2015)[8]compared Intelligence Based Techniques in the field of Remote Sensing Image Classification. They concluded that to proper classify remotely sensed images, there is the need of a high level Computational Intelligence based classifier for the perfect use of land cover features. Computational Intelligence explodes its area based on Swarm Intelligence, Modelization of human mind, nature inspired and some other intelligent techniques. From these major categories, the author’s included Artificial Bee Colony optimization, Cuckoo Search, Rough Set, Fuzzy Set, Membrane Computing, Minimum Distance Classifier and Maximum Likelihood Classifier for the comparison classification of Alwar region, India. Kappa coefficient was taken as acceptance estimation parameter. User’s accuracy & Producer’s accuracy are considered to check the accuracy of a solitary land feature.
4. METHODOLOGY
• Training Dataset
The first step in undertaking a supervised classification is to define the areas that will be used as training sites for each land cover class. This is usually done by using the on-screen digitized features. For this purpose, band is chosen with strong contrast (such as a near infrared band) or a color composite image for use in digitizing. Training of the system is an essential part of the classification process. In this process of image classification different bands of the satellite images has been used for the training process.
• Spider Monkey Optimization (SMO)
Social behavior of spider monkeys inspires to develop a stochastic optimization technique that can provide better solutions for various problems on the basis of mimics Fission–fusion social structure (FFSS) based foraging behavior of spider monkeys. Following are the key features of the FFSS.
1. The fission–fusion social structure based animals are social and live in groups of 40–50 individuals. The FFSS of swarm may reduce the foraging competition among group members by dividing them into sub-groups in order to search food.
3. Sub-groups are also supposed to be led by a female (local leader) who becomes decision-maker for planning an efficient foraging route each day.
4. The members of these subgroups then communicate within and outside the subgroup depending upon the availability of food and to maintain territorial boundaries.
In the developed strategy, the foraging behavior of FFSS based animals (e.g. spider monkeys) is divided into four steps. The algorithm for proposed thesis can be represented as follows:
Input: Satellite Image 7 band dataset
Output: Classified Image
Step 1: Consider 7 band satellite image as input.
Step 2: Initialization: Select static and dynamic parameters randomly and then calculate fitness values
Step 3: For entire iterations initialize population form spider monkey optimization. SMi (1…2…………..N) is a D-dimensional vector. In this D represents total number of variable available in optimization problem.
(1)
Where and are bounds of SMiin jthdirection and U(0, 1) is a uniformly distributed random number in the range [0, 1].
Calculate the fitness value for that position
Step 4: divide the whole population into different sub groups and use local leader phase for detection of best pixels available in the regions using eq. 2 (path extracted and obstacles detected)
The position update equation for ithSM(which is a member of kth local group) in this phase is
(2)
Where is the jth dimension of the ithSM, represents the jth dimension of the kth local group leader position. Step 5: Calculate optimum values using SMO algorithm and compute the best position for food and transmit information to local leader. Repeat this step 4 for all the local groups.
Step 6: computation of global leader from local phase outputs. The position update equation for this phase is as follows:
(3)
Where GL j represent the jth dimension of global leader position and j belong to {1,2..3}is the randomly chosen index. \
Step 7: The position of spider monkey is updated on the basis of a probabilities probj which are calculated using their fitness.
(4)
Step 7: local leader decision making process has been done on the basis of fitness value extracted from local and global groups. The position of local leader is updated by applying greedy selection.
Fork = {1...MG} do
IfLocalLimitCount k >LocalLeader Limit Then
LocalLimitCount k = 0. GS = kthgroup size; Fori∈ {1...GS} do Foreach j ∈ {1...D} do IfU(0, 1) ≥ prthen
SMnewi j = SMminj+ U(0, 1) × (SMmaxj−SMminj ) Else
SMnewi j = SMi j +U(0, 1)×(GL j −SMi j )+U(0, 1)×(SMi j −LLk j )
End if End for End for End if End for
Step 8: global leader decision phase has been initiated based on the global count limits of the local groups
IfGlobalLimitCount>GlobalLeader Limit Then
GlobalLimitCount= 0
IfNumber of groups < MG Then
Divide the population into groups. Else
Combine all the groups to make a single group. End if
Update Local Leaders position. End if
Where MG denotes minimum number of groups, that have been initialized for image classification process.
Step 9: Classify satellite image on the basis of best solution obtained from SMO.
Step 10: Compute Kappa coefficient and Accuracy accordingly to verify the efficiency.
5. RESULTS AND DISCUSSIONS
This proposed research makes use of multispectral, high resolution satellite images of Alwar region of Rajasthan. This multi-resolution image having dimensions 472*546 that are used to classify various terrain features. 7 band satellite images are named as Green, Red, NIR (Near Infra-Red), MIR (Middle Infra-Infra-Red), and Radarsat-1 (RS1), Radarsat-2 (RS2) and Digital Elevation Model (DEM). The dimensions of the image is 472*546 which means it contains 2, 57,712 pixels. The ground resolution of these images is 23.5m and 10m respectively from Radarsat 1 and LISS-III. In the purposed research work SMO has been used with minimum distance classifier that is used for extraction of pixels that are nearby to the mean pixel of the output class. On the basis of distance pixels have been aligned to a single class.
Classification of image using SMO
depicts original image which is being compared with Fig 5.3, classified image by SMO.
Fig 5.2 original alwar image
[image:5.595.59.262.334.485.2]This figure represents original image of alwar that has been divided among different classes on the basis of properties. Image has been divided into 5 different regions that are water, urban, vegetation, barren and rocky. These regions have different colors and these are interconnected to each other.
Fig 5.3 Classified image using SMO
[image:5.595.321.557.375.646.2]Figure 5.3 represents classified image that has been produced after using spider monkey optimization approach. Image has been classified into 5 different classes that are categorized by different colors. These bands have been utilized for extraction of features based on different regions andafterwards these regions must be used for classification of a remote sensing image. In classified result image blue color water region, green depicts Vegetation area, yellow color represents Barren, brown represents Rocky region, red represents urban region.
Table 5.1 Error Matrix based on satellite image classification using SMO
Features Wat er
Vegetati on
Urba n
Rock y
Barre n
Tot al
Water 68 0 5 1 0 74
Vegetati on
0 157 6 0 3 166
Urban 0 11 155 0 8 174
Rocky 0 0 0 92 3 95
Barren 0 0 1 0 52 53
Total 71 158 160 101 70 560
This table represents error matrix that has been computed by implementing SMO based image classification. In this matrix different pixel that has been used for classification has been represented in different regions in which they are aligned. On the basis of this table various performance evaluation parameters have been analyzed.
5.2 Parameter Analysis
In the purposed work various parameters have been analyzed for performance evaluation of purposed work. These parameters are kappa coefficient, user accuracy, producer accuracy and overall accuracy. These parameters are illustrated below.
KAPPA COEFFICIENT:
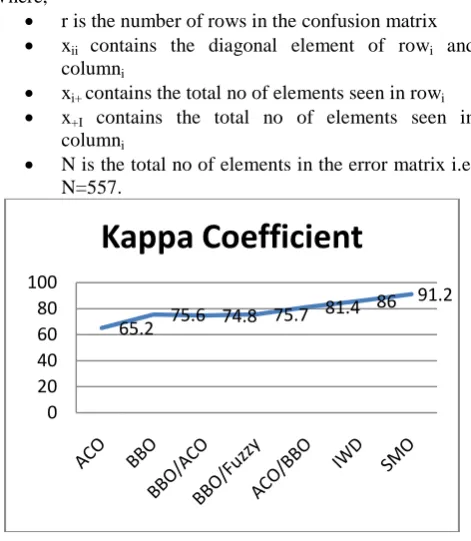
The Kappa Coefficient is the parameter taken to calculate the efficiency and accuracy for the algorithm used. Kappa coefficient for spider monkey optimization (SMO) is 91.2 %. This Kappa coefficient would be compared with its previous results and kappa with better results considered to be a more efficient.
It may determine from the error matrix. The kappa coefficient incorporates both the diagonal and off-diagonal elements of the rows and columns to give an impressive evaluation of accuracy as compare to overall accuracy. This can be measured by the formulation as given below:
Where,
• r is the number of rows in the confusion matrix
• xii contains the diagonal element of rowi and columni
• xi+ contains the total no of elements seen in rowi • x+I contains the total no of elements seen in
columni
• N is the total no of elements in the error matrix i.e. N=557.
Fig 5.4 Kappa Coefficient
This figure represents kappa coefficient for different classification approaches that has been used for satellite image classification process.
OVERALL ACCURACY:
The Overall accuracy of terrain classification using spider monkey optimization comes out to be 93.2%, which is
65.2 75.6 74.8 75.7 81.4
86 91.2
0 20 40 60 80 100
beyond than better in comparison to the previously used swarm techniques.
User Accuracy and Producer Accuracy are the two different styles to calculate over all accuracy. Accuracy in error matrix means perfect classification of 5 regions with 5 distinct colors can be seen as per the elements given in the error matrix both column wise and row wise.
User’s Accuracy measured through element or pixels that comes across row wise in the given error matrix.
[image:6.595.35.283.272.341.2] [image:6.595.35.282.456.521.2]Following
Table demonstrates user’s accuracy differentiating pixels into five given regions using proposed technique i.e. spider monkey optimization
User’s Accurac
y
Water Vegeta tion
Urba n
Rock y
Barre n 99% 100% 100
%
94% 86%
Producer’s Accuracy measured through element or pixels that comes across column wise in the given error matrix
[image:6.595.43.273.553.737.2]Following
Table demonstrates producer’s accuracy with proposed technique i.e. spider monkey optimization
Produce r’s Accurac
y
Water Vegeta tion
Urba n
Rock y
Barre n 97% 97% 100
%
100% 100%
Overall Accuracy can also be seen below in the form of measuring graph:
Figure 5.4 Overall accuracy of classification technique
6. CONCLUSION
In this paper satellite image classification has been done to extract different regions of valuable regions on the basis of the properties. These regions have been classified into five different classes that are water, barren, vegetation, urban and rocky. In the process of Taren image classification spider monkey optimization approach has been used that extract optimal features on the basis of initial population using global leader phase and local leader phase to find out best food locations in the regions. In this process nature inspired optimization approach has been used for extraction of best pixel values on the basis of global leader decision phase. Alwar dataset 7 band images have been used for extraction of training features and these features have been optimized using SMO. On the basis of SMO parameters image has been divided into 5 different classes.
On the basis of these parameter we can conclude that purposed method provide better accuracy rate that is 93.2 % and better Kappa coefficient that is 91.21 % than previous approaches.
In the future reference hybrid approaches can be used to evaluate unclassified classes and better classification.
7.REFRENCES
[1] Dr. Harish kundra and Er. AnikaRana, “Hybrid Algorithm of PSOand BCOfor Image Classification of Natural Terra Features”, International Journal of Computer Science and Communication Engineering, Volume 4, Issue 2, 2015. [2] ParulPrashar and Harish Kundra, “Hybrid Approach for
Image Classification using SVM Classifier and SURF Descriptor”, International Journal of Computer Science and Information Technologies, Vol. 6, Issue 1, pp. 249-251, 2015.
[3] Ngoc-Hoa Nguyen and Dong-Min Woo, Seungwoo Kim, and Min-Kee Park, “Terrain Segmentation of High Resolution Satellite Images Using Multi-Class AdaBoost Algorithm”, International Conference on Natural Computation, 2014
[4] Ms. Chandrakala. M and Mrs. R.Amsaveni, “Classification of Remote Sensing Image Areas Using Surf Features and Latent DirichletAllocation”, International Journal of Advanced Research in Computer Science and Software Engineering, Volume 3, Issue 9, pp. 178-182, 2013.
[5] Tang Yingjun, “The Variant of Latent Dirichlet Allocation for Natural Scene Classification”, Computing and Informatics, Vol. 30, pp. 311–319, 2011.
[6] Jayanth J, Dr. Ashok Kumar, Dr. ShivaprakashKoliwad, Sri
Krishnashastr, “Artificial Bee Colony Algorithm for Classification of Remote Sensed Data”, International Conference on Industrial Instrumentation and Control (ICIC), pp. 1512-1517, 2015.
[7] Anna Bosch, Andrew Zisserman and Xavier Munoz, “Scene classification using a hybrid generative/discriminative approach”, pp. 1-35,2007.
[8] Vartika Singh, Gourav Kumar and DivyaSabherwa, “A Comparative Study of Computational Intelligence Based Techniques in the field of Remote Sensing Image Classification”, IEEE, pp.1402-1408, 2015.
[9] Er. Sakshi Sharma, Er. PoojaNagpal, Er. Harish Kundra, A Review on the Satellite Image Classification using Swarm Intelligence based Techniques, International Journal of Advances in Science and Technology (IJAST).
68.3 68.8 76.4 81.05
86.2 89.2 93.2
0 20 40 60 80 100