DOI: http://dx.doi.org/10.26483/ijarcs.v8i7.4585
Volume 8, No. 7, July – August 2017
International Journal of Advanced Research in Computer Science
RESEARCH PAPER
Available Online at www.ijarcs.info
ISSN No. 0976-5697
A NOVEL APPROACH FOR THE EXTRACTION AND CLASSIFICATION OF
TUMOR IN MR IMAGES OF THE BRAIN VIA PRINCIPLE COMPONENT
ANALYSIS AND KERNEL SUPPORT VECTOR MACHINE
Meenakshi Pareek
AIM & ACT , Banasthali Vidhyapith Banasthali Vidhyapith
Jaipur, Rajasthan
C.K Jha
AIM & ACT , Banasthali Vidhyapith Banasthali Vidhyapith
Jaipur, Rajasthan
Saurabh Mukherjee
AIM & ACT , Banasthali Vidhyapith Banasthali Vidhyapith
Jaipur, Rajasthan
Abstract: Medical imaging plays an important role in the medical field. In present time there are various computerized methods for medical imaging to diagnose the inner portion of human body. Brain tumor detection is an important application in recent days. In this paper, various methods have been used for brain tumor detection and classification taking magnetic resonance images as input. For tumor classification, we had done experimentation with 50 MRI images taken from “figshare brain data set”. We propose an efficient method for brain tumor classification to classify cancerous and noncancerous tumor. The proposed method has three major steps 1.) Feature extraction 2) Feature reduction and 3) Classification. The present approach extracts the statistical texture features using 2D Discrete Wavelet transformation (Daubechies) and GLCM. PCA (principle Component Analysis) is used for feature reduction. We create a training data set that was carried out with 50 MRI images and applied SVM classifier to classify the tumor whether it is Benign and Malignant and evaluate the performance by Kernel based SVM.
Keywords: DWT, PCA, GLCM and Kernel SVM.
1.INTRODUCTION
Nowadays computer technology used in medical field to focus on vast scale of medical field, such as tumor, brain research , cardiac research etc. For the brain research Medical Resonance Imaging (MRI) plays important role to diagnose tumor [1] Brain tumor is leading cause of death in youngs and adults. According to the “Central Brain Tumor Registry of the United States (CBTRUS), there will be 64,530 new cases of primary brain and central nervous system tumors diagnosed by the end of 2011” . On the whole more than 600,000 people presently survive with the disease.[2] T1 weighted and T2 weighted images are part of the MRI[3].Anatomic behavior of brain is shown through the MRI. MRI is also used for study the internal structure of human body. Radiologist visualizes and analyzes those images. MRI technique completely based on Magnetic Field. [4]. In MRI electromagnetic waves are used and these wave are transmitted in human brain and signal are recorded and reconstructed on images and these images are analyzed by computer program. [4]. When large no of MRI images are analyzed and visualized by radiologist manually or with conventional method, leads to inaccurate classification. For accurate classification of tumor many techniques are used. Some of them are fuzzy methods, neural network, atlas method, variation, segmentation, etc. [3].
SVM (Support Vector Machine) classifier mostly used in different application for medical diagnoses. SVMs are originated from statistical theory developed by Vapnik in 1982 later introduced in 1995[5]
SVM fulfill the classification by modeled by N-dimension hyperplane that optimally categorized data into classes. [6]SVM optimized better result than other classifier; it is binary classification, based on supervised learning. [7] SVM classification depends on data (Feature Vector) these data implicate training and testing data instances. Training set comprises one “target value” and second “attribute” (feature) [6].
This manuscript is structured as follows:- Section II provides a interrelated work of different “feature extraction” techniques, “feature selection” techniques and different “classification” techniques to classify the tumor whether it is cancerous and non-cancerous. Section III and IV present our proposed work, includes DWT and GLCM for texture feature extraction , PCA(Principle Component Analysis ) for feature selection and feature reduction, and supervised classification techniques for the classification to detect types of tumors. Section V includes the performance measurement to check the accuracy using kernel SVM. Last section contains our conclusion and possible future work.
2.RELATEDWORK
LDA used for reduce the extracted feature. These features are input of classifiers (SVM) after those classifiers perform the classification. This approach compared with other existing methods (PCA & LDA).
Minakshi Sharma, Dr SaurabhMukherjee (2012)proposed a novel approach for classification of Astocytoma (Grade I to IV) tumor. They represent hybrid genetic algorithm for feature selection. Features were retrieving by GLCM (Gray Level Co-Occurrence Matrices). Hybrid Genetic Algorithm used for best feature selection, with this algorithm ANFIS (Artificial Neural Network Fuzzy Inference System) has been used and compare the result with ANN, K-Mean, FCM, SOM+DWT. ANFIS+hybrid genetic retrieve Better result as compared to existing algorithm.
The obtain result provided satisfactory accuracy but doesn’t calculate the thickness of tumor [9].
NitishZulpi et al., (2012) here works on to classify the different types of brain tumor Astrocytoma, Meningioma, Metastatic and Sarcoma. In this work first they extract texture feature using “GLCM (Gray Level Co-Occurrence Matrix)”.for classification purpose two layer feed forwarded neural network with LM (LevenbergMarquat) that gives 97.5% accuracy.[11]
Minakshi et al.(2012) proposed a new method to find out Sensitivity, Accuracy and specificity using “ANFIS(Adaptive network fuzzy inference system)” with “genetic algorithm” and get highest accuracy to detect brain tumor[10].
AyseDemirhan, Mustafa Toru InanGuler(2013)perform segmentation using unsupervised SOM(Self Organized Map)technique to segment image in to tumor, edema and cerebrospinal fluid. For this purpose using T1, T2 and FLAIR image of 20 subjects. For filtering anisotropic diffusion filter and input feature in SOM. For feature extraction SWT (Stationary Wavelet Transformation) used [12].
The result shows with contrast manual, grey level and color segment. With the help of SOM radiologist get high accuracy in tumor and edema.
Mu Zhou,Lawreance O et al.,(2013) Feature extraction plays an important role to classify brain tumor. In this proposed work they predict the survival time of tumor patient with help of ranking the feature. From MRI images, texture based feature extracted with the help of multiscale LBP (Local Binary Pattern), this method mainly applied for Region of Interest. Various features are duplicate, some are noisy so that they gives error and time consuming, to overcome this aspect they proposed new approach supervised feature selection method FRM(Feature Ranking Model),to rank the needed feature. These features are as input of SVM classifiers. After classification (SVM) and FRM (Feature Selection) they predict the survival time of patient with the help of RBF kernel [13].
The classification is accurate but prediction is not true. R.Meenakshi et al., (2014) they proposed new feature descriptor MLTP (Multiscale Ternary Local Pattern) create similar pattern. They found LTP (Local Ternary Pattern) is not best for feature extraction. MLTP used here as a feature descriptor which observe resemblance among pixels. These are used with SVM classifier to classify the tumor and get 96% accuracy. The obtain result compared with BPN classifier and found out SVM gives better and efficient accuracy over BPN [14].
The obtain result show SVM classifier is best technique for classification in medical field.
Mohan priya et al(2014)[18] detect the brain tumor using multi class SVM and they train their system with image features. They divide image features in two categories, first order and second order features. After that classify the tumor and evaluate the performance with kernal based SVM. They found second order of statistical feature gets 85% accuracy .
U.Rajendre et al(2014)[16]proposed a automatic classification algorithm to detect breast cancer that is based on thermograms. In this work they have proposed four texture features to diagnose the cancer. For the analysis and classification, used SVM (Support Vector Machine) classifiers to classify the breast cancer. They applied their classification algorithm on infrared thermography to diagnose the tumor and get 88% accuracy.
Ahmead Karat et al(2016)][15] used T2-weighted brain images to detect brain tumor. In the first part of paper they extract the texture features using DWT (Discrete wavelet transformation) and SGLDM (Spatial gray level dependence matrix). For the selection and classification purpose they used genetic algorithm and to classify the tumor they hybrid the GA(Genetic Algorithm) with SVM. Those method obtain the 95% of accuracy on T@-weighted images.
Mahmoud Khaled Abd-Ellah(2016)[17] they purposed the CAD(Computer Aided Design ) system to classify the cancer in to benign or malignant. The proposed system incorporate with different types of techniques , for feature extraction and selection they used DWT(Discrete wavelet transformation) and PCA(Principle component analysis) and classified tumor with SVM. They achieved 100% accuracy using KSVM (Kernal based Support Vector Machine).
3.PROPOSEDWORK
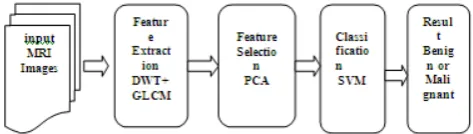
[image:2.595.319.556.599.666.2]The proposed work as illustrate in fig. 1 is based on the following techniques “Gray Level Co-occurrence Matrix (GLCM)”, the “principle components analysis (PCA)”, “Support Vector Machine (SVM)”. The methodology contains mainly three stages: - feature extraction, feature selection and classification. SVM classification with two classes as Benign and Malignant. This brain tumor dataset containing 3064 T1-weighted contrast-enhanced images from 233 patients with two kinds of brain tumor, for the experiment 50 MRI images are carried out. And those images are divided in to four parts Bottom, Top, Back, and Side.
Figure 1:- Process of Brain tumor extraction and Classification
A. Feature Extraction
analyzed for examine the specific purpose. Generally, the unprocessed data of a set of images is analyzed to get close problem, and how these features are useful to get desired result. “Feature extraction” is an essential step, which is a unique form of dimensionality reduction. The first order of statistical image features like skewness, kurtosis, entropy, mean and variance and second order of statistical image feature like contrast, homogeneity and energy. GLCM (Gray Level Concurrence Matrix) is use to extract second order image features.
The first-order histogram P(I) is defined as:
The second order Gray Level Co-occurrence Matrix, P(X,Y) is defined as follows.
Here image intensity values are i and j, spatial position of an image is X and Y in the image Img and the offset (Δx, Δy) rely on the way used and the distance at which the matrix is computed[18]
GLCM technique is use to extract textural features of an image in the above equation we use following notaions;-[19]
G:- number of gray levels µ:-mean value of p µx, µy:-means of Px and Py σx , σy:-Standard Deviation The following features are used:
• Homogeneity, Angular Second Moment (ASM) :
ASM=
Homogeneity is far above the ground when image pixels are incredibly related Angular Second Moment is also known as Homogeneity. Homogeneity is measure with the sum of squares of entries in the GLCM Angular Second Moment. [20]
• Contrast
Contrast=
• Inverse Difference Moment(IDM) IDM=
Inverse Difference Moment (IDM) is the local homogeneity. It is high when local gray level is homogeneous and contrary GLCM is high.
• Entropy
Entropy=
When the image is compressed amount of information is lost, to measure the how much information is lost when the signal is transmitted [20]
• Correlation=
• Variance= • Average=
For the texture feature extraction we have one more another method to extract the feature DWT . Basically to state the 2D images with different levels of resolutions DWT is used. DWT decomposes the images with different levels. As the decomposition level is greater than before, compressed and obscene estimated coefficients can be accomplished. In this paper, single level decomposition of “Daubechies wavelet “ is apply for the feature extraction. The following diagram show the decomposition process for images:
B. Feature Selection
One of the main ordinary forms of feature selection is “principal components analysis. For feature selection and reduction PCA use feature vector that calculated from wavelets. Through the feature vector PCA select the features for efficient classification using supervised approach .So; the major initiative behind by PCA method is to lessen the dimensionality of the “wavelet coefficients”. [21] It is essential to diminish the amount of features to drop off the computation time and the necessary storage. “Principal component analysis” (PCA) is an excellent technique used for modify input feature into a novel one through inferior dimension. PCA uses the major “eigenvectors” of the “correlation” matrix to restructure features according to their divergences [17].
C. Feature selection
wx b 0
With w and b are weight and bias parameters respectively.[2] (LK): k(xi, xj)=xi’ xj
(QK): k(xi, xj)=(xi’ xj +1) 2
(PK): k(xi, xj)=(xi’ xj +1) n
(RBFK):= k( xi , x j ) = exp( − || xi− x j ||2 ) / σ [22]
4.EXPERIMENTANDRESULTS
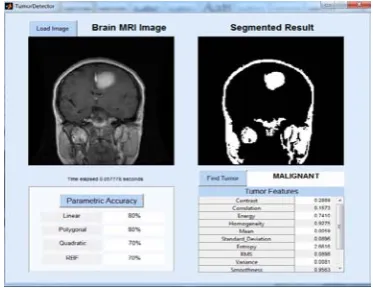
For brain tumor detection, segmentation, and classification a graphical user interface (GUI) system has been developed. The system is designed to process MRIs different formats like “tiff”, “jpg”, “png”, and “bmp”. In Fig. 1 overview of GUI is displayed–(a). The interface consists three buttons as; “load MRI” is used to select the target MRI image. A “find tumor “ button classifies the input MRI as a “normal” or “abnormal” image. Tumor type button is used to classify the tumor type into benign or malignant Parametric Accuracy to calculate the Kernel based SVM accuracy.
Figure:-2 (a)- Top View of Brain with Malignant Tumor
The above figure showing the proposed system’s GUI proposed. The GUI demonstrates the classification results of a brain tumor MRIs: (a) Benign brain tumor and (b) Malignant brain tumor. Both images have top view of brain from abnormal MRIs that come from the classification phase.
Figure:-3 (b)-Top View of Brain with BenignTumor
. Figure:-3 (c) Side View of Brain with Benign Tumor
The above figure showing the proposed system’s GUI proposed. The GUI demonstrates the classification results of a brain tumor MRIs: (c) Benign brain tumor and (d) Malignant brain tumor. Both images have Side view of brain from abnormal MRIs that come from the classification phase.
Figure:-4 (d) Side View of Brain with Malignant Tumor
Figure:-5 (e) Bottom View of Brain with Benign Tumor
Figure:-6 (e) Bottom View of Brain with Malignant Tumor
Figure:-7 (g) Back View of Brain with Benign Tumor
Figure:-8 (h) Back View of Brain with Malignant Tumor
The above figure showing the proposed system’s GUI proposed. The GUI demonstrates the classification results of a brain tumor MRIs: (g) Benign brain tumor and (h) Malignant brain tumor. Both images have Back view of brain from abnormal MRIs that come from the classification phase
5.PERFORMEANCEEVALUATION
[image:5.595.67.247.53.194.2]Performance assessment is an important part so one can amend the parameter through analyzing, testing and evaluating the outcomes and performance of methods so that the entire process can be optimized.
Table I: Parameter Analysis when Benign Tumor and Malignant Tumor Is Detected on Top view of Brain
kernel function.
Accuracy in percent(Beni
gn)
Accuracy in percent(Malign
ant)
Linear 80 90
Polynomial 80 70
RBF 80 80
[image:5.595.332.541.87.172.2]Quadratic 90 80
Table II: Parameter Analysis when Benign Tumor and Malignant Tumor Is Detected on Side view of Brain
kernel function.
Accuracy in percent(Beni
gn)
Accuracy in percent(Malign
ant)
Linear 90 80
Polynomial 70 70
RBF 70 80
[image:5.595.333.542.217.302.2]Quadratic 80 80
Table III: Parameter Analysis when Benign Tumor and Malignant Tumor Is Detected on Bottom view of Brain
kernel function.
Accuracy in percent(Beni
gn)
Accuracy in percent(Malign
ant)
Linear 90 80
Polynomial 80 80
RBF 80 70
Quadratic 80 80
Table IV: Parameter Analysis when Benign Tumor and Malignant Tumor Is Detected on Back view of Brain
kernel function.
Accuracy in percent(Beni
gn)
Accuracy in percent(Malign
ant)
Linear 90 80
Polynomial 80 80
RBF 80 70
Quadratic 80 70
6. CONCLUSIONANDFUTUREWORK
[image:5.595.66.248.238.388.2] [image:5.595.332.542.358.444.2] [image:5.595.71.258.435.579.2] [image:5.595.332.541.501.586.2]of brain. We find that RBF and Quadratic Kernal gives the 80% to 90% accuracy.
Future work involve to get the area and volume of tumor and measure the accuracy of SVM classifier.
7.REFERENCES
[1] Jafarpour, S., Sedghi, Z., & Amirani, M. C. (2012). A robust brain MRI classification with GLCM features. Int. J. Comput. Appl, 37(12), 1-5.
[2] Rathi, V. P., & Palani, S. (2012). Brain tumor MRI image classification with feature selection and extraction using linear discriminant analysis. arXiv preprint arXiv:1208.2128. [3] Sharma, M., & Singh, S. (2014). A Modified and Improved
Method for Detection of Tumor in Brain Cancer. International Journal of Computer Applications, 91(6).
[4] Gondal, A. H., & Khan, M. N. A. (2013). A review of fully automated techniques for brain tumor detection from MR images. International Journal of Modern Education and Computer Science (IJMECS), 5(2), 55.
[5] Biradar C, Shantkumari (2013). Measurement based Human Brain Tumor Recognition by Adapting Support Vector Machine. IOSR Journal of Engineering (IOSRJEN) e-ISSN: 2250-3021, p-ISSN: 2278-8719 Vol. 3, Issue 9 (September. 2013), (1)(pp. 26-31).
[6] Chandra, S., Bhat, R., Singh, H., &Chauhan, D. S. (2009). Detection of brain tumors from MRI using gaussian RBF kernel based support vector machine.IJACT, 1(1), 46-51. [7] Singh,D., KamaljeetKaur (2012). Classification of
Abnormalities in Brain MRI Images Using GLCM, PCA and SVM. IJEAT, (1) (pp 243-248).
[8] Rathi, V. P., & Palani, S. (2012). Brain tumor MRI image classification with feature selection and extraction using linear discriminant analysis. arXiv preprint arXiv:1208.2128.
[9] Sharma, M., &Mukharjee, S. (2012). Brain tumor segmentation using hybrid genetic algorithm and artificial neural network fuzzy inference system (anfis).International Journal of Fuzzy Logic Systems, 2(4), 31-42.
[10] Sharma, M., & Mukherjee, S. (2014). Fuzzy c-means, anfis and genetic algorithm for segmenting astrocytoma-a type of brain tumor. IAES International Journal of Artificial Intelligence, 3(1), 16.
[11] Zulpe, N., &Pawar, V. (2012). GLCM textural features for brain tumor classification. IJCSI International Journal of Computer Science Issues, 9(3), 354-359.
[12] 21 synopsis Demirhan, A., Toru, M., &Guler, I. (2014). Segmentation of Tumor and Edema Along with Healthy Tissues of Brain Using Wavelets and Neural Networks. [13] Zhou, M., Hall, L. O., Goldgof, D. B., Gatenby, R., &Gillies,
R. J. (2013, October). A texture feature ranking model for predicting survival time of brain tumor patients. In Systems, Man, and Cybernetics (SMC), 2013 IEEE International Conference on (pp. 4533-4538). IEEE.
[14] R. Meenakshi and P. Anandhakumar, (2014). An Improved Local Ternary Pattern Based Tumour Classification of MRI of Brain.Research Journal of Applied Sciences, (9) (pp. 99-103). [15] Kharrat, A., Halima, M. B., & Ayed, M. B. (2015,
December). MRI brain tumor classification using support vector machines and meta-heuristic method. In Intelligent Systems Design and Applications (ISDA), 2015 15th International Conference on (pp. 446-451). IEEE.
[16] Acharya, U. R., Ng, E. Y. K., Tan, J. H., & Sree, S. V. (2012). Thermography based breast cancer detection using texture features and support vector machine. Journal of medical systems, 36(3), 1503-1510.
[17] Abd-Ellah, M. K., Awad, A. I., Khalaf, A. A., & Hamed, H. F. (2016, December). Design and implementation of a computer-aided diagnosis system for brain tumor classification. In Microelectronics (ICM), 2016 28th International Conference on (pp. 73-76). IEEE.
[18] Priya, K. M., Kavitha, S., & Bharathi, B. (2016, January). Brain tumor types and grades classification based on statistical feature set using support vector machine. In Intelligent Systems and Control (ISCO), 2016 10th International Conference on (pp. 1-8). IEEE.
[19] Albregtsen, F. (2008). Statistical texture measures computed from gray level coocurrence matrices. Image processing laboratory, department of informatics, university of oslo, 5. [20] Mohanaiah, P., Sathyanarayana, P., & GuruKumar, L. (2013).
Image texture feature extraction using GLCM approach. International Journal of Scientific and Research Publications, 3(5), 1.
[21] Sawakare, S., & Chaudhari, D. (2014). Classification of Brain Tumor Using Discrete Wavelet Transform, Principal Component Analysis and Probabilistic Neural Network. International Journal For Research In Emerging Science And Technology, 1.