Towards Automatic Scoring of a Test of Spoken Language with
Heterogeneous Task Types
Klaus Zechner and Xiaoming Xi
Educational Testing Service Rosedale Road, Princeton, NJ 08541, USA
{kzechner,xxi}@ets.org
Abstract
This paper describes a system aimed at auto-matically scoring two task types of high and medium-high linguistic entropy from a spoken English test with a total of six widely differing task types.
We describe the speech recognizer used for this system and its acoustic model and lan-guage model adaptation; the speech features computed based on the recognition output; and finally the scoring models based on mul-tiple regression and classification trees.
For both tasks, agreement measures between machine and human scores (correlation, kappa) are close to or reach inter-human agreements.
1 Introduction
As demand for spoken language testing and cost of human scoring have increased in recent years, there is a growing interest in building both research and industrial systems for automatically scoring non-native speech (Bernstein, 1999, Zechner and Bejar, 2006, Zechner et al, 2007).
However, past approaches have focused typi-cally only on one type of spoken language, or on a range of types similar in linguistic entropy. En-tropy in this context can be seen as a measure for how predictable the language in the expected spo-ken response is: Some tests, such as SET-10 (Bern-stein 1999), are focused mostly on the lower entropy aspects of language, using tasks such as “reading” or “repetition”, where the expected se-quence of words is highly predictable. Other as-sessments, such as the TOEFL® Practice Online Speaking test, on the other hand, focus on more
spontaneous, high-entropy responses (Zechner et al., 2007).
In this paper, we describe a spoken language test with heterogeneous task types, ranging from read speech to tasks that require candidates to give their opinions on an issue, whose goal is to assess com-municative competence (Bachman, 1990; Bach-man & Palmer, 1996); we call this test THT (Test with Heterogeneous Tasks). Communicative com-petence, in this context, refers to a speaker's ability to use the language for communicative purposes. The effectiveness of the communication typically consists of a few aspects including comprehensibil-ity, accuracy, clarcomprehensibil-ity, coherence and appropriate-ness, and is evident in a speaker's pronunciation, fluency, use of grammar and vocabulary, develop-ment of ideas, and sensitivity to the context of the communication.
This test has the advantage of being able to as-sess a wide range of non-native speakers’ profi-ciencies by using tasks of varying difficulty levels to allow even low proficiency speakers some de-gree of success on easier task types.
We select two tasks from this test, one of higher and one of medium to high entropy, and first adapt a non-native English speech recognizer (trained on TOEFL® Practice Online data) to transcribed THT task responses, then compute a set of relevant speech features based on the recognition output, and finally build a scoring model using a subset of these features to predict trained human rater scores. In this paper, we will demonstrate that the ma-chine-human score agreements on these two task types come close to or even exceed the level of inter-human agreement.
per-formed, and Section 5 describes the speech fea-tures selected for use in the scoring model. In Sec-tion 6, we report the construcSec-tion of the scoring model and its results, Section 7 contains a general discussion and Section 8 concludes the paper with a brief discussion of future research.
2 Related work
There has been previous work to automatically characterize aspects of communicative competence such as fluency, pronunciation, and prosody. Franco et al. (2000) present a system for automatic evaluation of the pronunciation quality of both na-tive and non-nana-tive speakers of English on a phone level and a sentence level (EduSpeak). Candidates read English texts and a forced alignment between the speech signal and the ideal path through the Hidden Markov Model (HMM) is computed. Next, the log posterior probabilities for pronouncing a certain phone at a certain position in the signal are computed to achieve a local pronunciation score. These scores are then combined with other auto-matically derived measures such as the rate of speech (number of words per second) or the dura-tion of phonemes to yield global pronunciadura-tion scores.
Cucchiarini et al. (1997a, 1997b) describe a sys-tem for Dutch pronunciation scoring along similar lines. Their feature set, however, is more extensive and contains, in addition to log likelihood Hidden Markov Model scores, various duration scores, and information on pauses, word stress, syllable struc-ture, and intonation. In an evaluation, correlations between four human scores and five machine scores range from 0.67 to 0.92.
Bernstein (1999) presents a test for spoken Eng-lish (SET-10) that uses the following types of task-s: reading, sentence repetition, sentence building, opposites, short questions, and open-ended ques-tions. All types except for the last are scored auto-matically and a score is reported that can be interpreted as an indicator of how native-like a speaker’s speech is. In Bernstein et al. (2000), an experiment is performed to investigate the per-formance of the SET-10 test in predicting speak-ers’ oral proficiency. It is shown that the SET-10 test scores can predict different levels on the Oral Interaction Scale of the Council of Europe’s Framework (North, 2000) for describing oral pro-ficiency of second/foreign language speakers with
reasonable accuracy. This paper further reports on studies done to correlate the SET-10 automated scores with the human scores from two other tests of oral English communication skills. Correlations are found to be between 0.73 and 0.88.
Zechner and Bejar (2006) investigate the auto-mated scoring of unrestricted, spontaneous speech of non-native speakers. They focus on exploring a number of different fluency features for the auto-mated scoring of short (one minute) responses to test questions in a TOEFL-related program. They explore scoring models based on classification and regression trees (CART) as well as support vector machines (SVM). Their findings are that the SVM models are more useful for a quantitative analysis, whereas the CART models allow for a more trans-parent summary of the patterns underlying the data.
In this paper, we use CART to build the scoring model for one task type. We also adopt multiple regression for another task type which has the ad-vantage of being more easily interpreted than, for example, SVMs. Another major difference be-tween previous work and the work reported in this paper is that we use feature normalization and transformation to obtain statistically more mean-ingful input variables for the scoring model. In ad-dition, we do not use the whole set of features in an exploratory fashion. Instead, we have carefully selected a subset of features that are both good pre-dictors of human scores and maximize the repre-sentation of the concept of communicative competence.
3 The THT test
3.1 Task types and scoring rubrics of the THT Speaking test
Task type 1: Reading-aloud (Planning time: 45 seconds; Response time: 45 seconds; zero/very-low entropy)
There are two read-aloud tasks. Each task requires the test-taker to read a short paragraph of 40-60 words aloud. The reading materials include an-nouncements, advertisements, introductions, etc. These two tasks are rated analytically on pronun-ciation and intonation and stress on a 3-point scale. That is to say, two separate scores are given on each task – one for pronunciation and one for into-nation and stress.
Task type 2: Picture description (Planning time: 30 seconds; Response time: 45 seconds; me-dium-high entropy)
This task requires the test-taker to describe a pic-ture in as much detail as possible.
This task is rated holistically on the combined impact of delivery (fluency, pronunciation etc.), use of structures, vocabulary, content relevance and fullness on a 3-point scale.
Task type 3: Open-ended short-answer ques-tions (Planning time: none; Response time: 15-30 seconds; low/low-medium entropy)
The test-taker responds, without preparation, to three questions about familiar and accessible topics that draw on immediate personal experience. The first two questions each elicit a 15-second response that covers one or two pieces of information lated to the specified topic. The third question re-quires a 30-second response that expresses an opinion or gives an explanation related to the topic. This task is rated holistically on the combined im-pact of delivery, use of structures, vocabulary, and task appropriateness on a 3-point scale.
Task type 4: Constrained short-answer ques-tions (Planning time: none; Response time: 15-30 seconds; low/low-medium entropy)
The test-taker responds to three questions about a schedule/agenda that is provided in written form. All the information needed to answer the questions should be included on or easily inferred from the schedule. The test-taker has 15 seconds to respond to each of the first two questions. These questions ask for specific information on the schedule or eas-ily inferred information about the schedule. The test-taker has 30 seconds to respond to the last question which requires a summary of multiple
events or multiple pieces of information on the schedule. This task is rated holistically on the combined impact of delivery, use of structures, vocabulary, task appropriateness and content accu-racy on a 3-point scale.
Task type 5: Respond to a voice mail (Planning time: 30 seconds; Response time: 60 seconds; high entropy)
In this task, the test-taker listens to a voicemail that describes a problem, question or situation and then assumes a particular role (bank teller, office assis-tant, etc.) to respond with a proposed solution or answer. This task is rated holistically on the com-bined impact of fluency, pronunciation, intonation and stress, grammar, vocabulary, register, content relevance, and cohesion and idea progression on a 5-point scale.
Task type 6: Opinion task (Planning time: 15 seconds; Response time: 60 seconds; high en-tropy)
In this task, the test-taker is expected to state an opinion or position on an issue that is familiar and accessible and to express support for the opinion or position with reasons, examples, arguments, etc. This task is rated holistically on the combined im-pact of fluency, pronunciation, intonation and stress, grammar, vocabulary, content relevance, and cohesion and idea progression on a 5-point scale.
3.2 Challenges of the THT test design to auto-matic scoring
work and the complexity in integrating different types of recognizers into the real-time automated scoring system.
2. Furthermore, the scoring criteria of these six different task types are somewhat different. This suggests that different scoring models may need to be developed for different task types since the relevant speech features to be included in the scor-ing model for each task type may differ.
3. THT speaking tasks use two kinds of score scales: 0-3 and 0-5. Classification techniques, such as classification trees or cumulative logit models (Agresti, 2002; Menard, 2001), may be more ap-propriate for task types that use a 3-point scale. Prediction techniques such as multiple regression may be better suited for task types that are on a 5-point scale. Training different types of scoring models will certainly increase the complexity and the amount of scoring model development and evaluation work.
In summary, the complexity of the design of the THT Speaking test is expected to have a ma-jor impact on our efforts to develop an automated scoring system. Given these challenges and the research resources available, we decided on a strat-egy of starting with high entropy task types and proceeding to low entropy task types. For this pa-per, we selected the high entropy Opinion task and the medium-high entropy Picture tasks for system development.
4 Adaptation of the speech recognizer
For this work, we are using a state-of-the-art gen-der-independent Hidden Markov Model speech recognizer whose acoustic model was trained on about 30 hours of non-native speech and whose language model was built on several hundred hours of both native and native speech. The non-native data came from the TOEFL® Practice Online system, a web-based practice program for prospective takers of the Test Of English as a For-eign Language (TOEFL) (Zechner et al., 2007). This data is somewhat different from the THT, as there are only high-entropy tasks in TOEFL Speak-ing and as the speakers are generally more profi-cient. Due to this difference, the baseline word accuracy was fairly low (see Table 1).
Therefore, as a first step, we needed to adapt the automatic speech recognition engine to the THT speech data.
We had approximately 1,000 responses each from the Picture and Opinion tasks transcribed. As mentioned above, while the Opinion task responses are generally more spontaneous, the Picture task requires the candidate to accurately describe a pic-ture and thus restricts the possible answer space considerably. Still, there is more room for individ-ual choice and variation in the vocabulary, gram-mar and content produced than there is in the more restricted low-medium and low entropy task types in the THT Speaking test.
When using our baseline automatic speech rec-ognition (ASR) engine without any adaptation to the THT speech data, we only obtained word accu-racies between 25% and 33%, which was clearly inadequate, and far below a word accuracy where, at least for some speakers, meaningful information can be drawn from the ASR hypothesis.
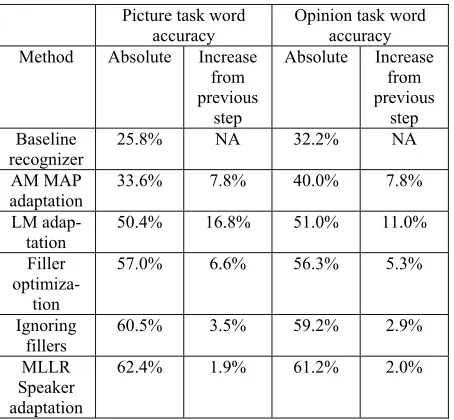
Therefore, we undertook a series of adaptation and optimization steps with the goal of maximizing the word accuracy on the two task types for the THT Speaking test. We first adapted the acoustic model in batch mode with supervised maximum a-posteriori (MAP) adaptation using the combined data from both tasks, then the language model, op-timized the filler cost parameter and finally con-ducted unsupervised maximum likelihood linear regression (MLLR) acoustic model adaptation based on individual speakers.
4.1 Acoustic model batch adaptation
We randomly selected about 90% of Picture and Opinion task response data for acoustic model (AM) adaptation, which contained 1,800 response files (over 25 hours of speech, adult speakers with typically low to intermediate English proficiency). Results are always reported on the held-out evalua-tion data containing 100 files for the Picture task and 80 files for the Opinion task.
We performed supervised maximum a posteriori (MAP) adaptation which is the method of choice for larger amounts of data and is typically per-formed in batch mode (Tomokiyo and Waibel, 2001; Wang et al., 2003). After one cycle of adap-tation, word accuracy improved by about 8%, as is shown in Table 1. We also performed unsupervised maximum likelihood linear regression (MLLR) adaptation, which is discussed in Section 4.4 be-low.
Picture task word
accuracy Opinion task word accuracy
Method Absolute Increase from previous
step
Absolute Increase from previous
step Baseline
recognizer 25.8% NA 32.2% NA
AM MAP
adaptation 33.6% 7.8% 40.0% 7.8%
LM
adap-tation 50.4% 16.8% 51.0% 11.0%
Filler
optimiza-tion
57.0% 6.6% 56.3% 5.3%
Ignoring fillers
60.5% 3.5% 59.2% 2.9%
MLLR Speaker adaptation
[image:5.612.73.300.68.278.2]62.4% 1.9% 61.2% 2.0%
Table 1. Word accuracies after each incremental step of adaptation or optimization and performance improvement within each step for Picture and Opin-ion task types.
4.2 Language model adaptation
The second step was language model (LM) adapta-tion. The Picture and Opinion tasks were adapted separately using the same training sets as above. We built interpolated models between the task-specific LM and the baseline LM (from the origi-nal recognizer).
We obtained the best results using only the task-specific LM trained on the THT data set (given in Table 1). This indicates that the domain of each of the tasks is narrow enough that it can be suffi-ciently described with a set of about 900 tran-scribed examples each and it does not benefit from a larger LM such as our baseline LM.
4.3 Filler cost optimization
“Filler cost” is a recognizer-internal parameter that determines the likelihood of filler and noise words to be inserted into the hypothesis before or after “real” words. The higher the parameter’s value, the less likely fillers will be inserted.
The experiments with the filler cost parameter grew out of an observation that the baseline recog-nizer has a tendency to hypothesize too many words when faced with different kinds of “uncer-tain” audio, such as mumbled words, noises or fill-ers. Therefore we conjectured that having the recognizer hypothesize more filler and noise words
in these cases and be more restrictive with actual word hypotheses might increase the word accuracy overall.
We varied the filler cost parameter from its de-fault, 3, down to its lowest meaningful value, 0. Our experiments show that for fillercost=0, a maximum word accuracy was achieved (given in Table 1), albeit at the cost of more than doubling the length of the recognizer’s hypothesis by intro-ducing a large amount of fillers (such as “um” or “uh”, noises, mumbles etc.). We observe that using such a low filler cost parameter setting can nega-tively affect some speech features which are can-didates for being used in a scoring model, such as “language model score”. Therefore we have to carefully assess whether achieving a higher word accuracy is more beneficial to the overall perform-ance of the feature set or whether it has too many negative effects on some important speech fea-tures. In future work we will attempt to tune the recognizer in such a way that it is not only opti-mized for a high word accuracy, but also for high accuracy in filler (and noise) prediction.
Word accuracy was computed with the fillers included or excluded. Since fillers are not real words, and in this round of scoring model devel-opment we did not use any features based on fill-ers, it was reasonable to compute the overall word accuracy with the fillers removed from the human and recognizer transcriptions, resulting in a moder-ate performance gain (see Table 1).
4.4 Unsupervised speaker adaptation
Feature
Number Feature Name Feature Class Description Used in
1 hmmscore
Pronuncia-tion Acoustic Model score: sum of the log probabilities of every frame, normalized for length Opinion & Picture
2
typesper-second Fluency & Vocabulary
diversity
Number of unique words in response (“types”)
di-vided by length of response Opinion & Picture
3
silences-persecond Fluency Number of silences per second Opinion & Picture
4 repetitions Fluency Number of repetitions divided by number of words Opinion
5
relevance-cos5 Vocabulary & Content Cosine word vector product between a response and all responses in the training set that have the highest
score (5 for the Opinion task)
Opinion
6
relevance-cos3 Vocabulary & Content Cosine word vector product between a response and all responses in the training set that have the highest
score (3 for the Picture task)
[image:6.612.73.509.69.235.2]Picture
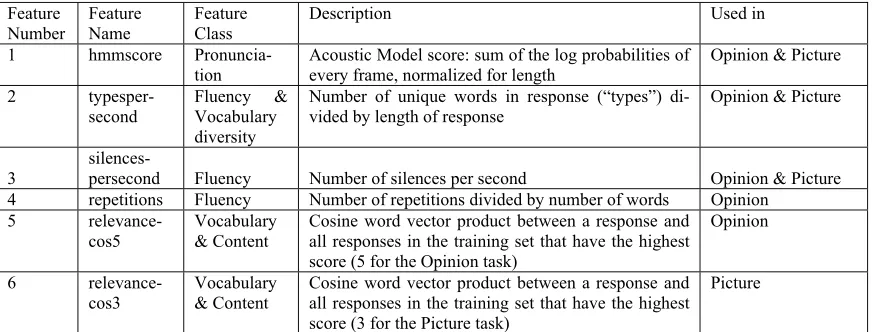
Table 2. Final features used for the scoring models for the Opinion and Picture tasks
approximately 2% for the Picture and Opinion tasks (see Table 1). There were large differences between different speakers in terms of the per-formance gain of MLLR adaptation on our data set, however. There was also a large variation of word accuracies between speakers (13-100%). The variation in accuracy across speakers can be due to many different factors, including the degree of ac-cent, the grammaticality of the response, the voice quality and the recording quality.
5 Speech features
Based on the output of the ASR engine, a feature computation module computes a set of about 40 features for each response, mostly in the fluency domain (e.g. “average silence duration”), but also some features related to pronunciation, vocabulary diversity and content.
Instead of using all of these features in a scoring model, we used a process of iterative refinement and selection to narrow down the feature set, based on both the coverage of the concept of communica-tive competence and empirical performance (corre-lations with human scores) of the features. Following this process, five features were selected to be included in developing the scoring models for the Opinion task type and four for the Picture task type (see Table 2).
When we look at the correlations of these fea-tures to the human scores, we find that hmmscore, after being transformed to improve normality, was the strongest predictor of human scores for both the Opinion and Picture tasks with typespersecond as the second strongest (0.5 <= Pearson r <= 0.7).
6 Scoring models
All the responses were double scored by a ran-domly selected pair of raters who were trained for scoring this test. The agreements between the two ratings (both kappa and Pearson r correlation) were around 0.50 for the Picture and 0.72 for the Opin-ion task. (Note that the fewer points a scale has, the lower correlation we can expect due to less score variability, everything else being equal.)
While we use the same training sets for the scor-ing model experiments as for the above ASR ex-periments (sm-train), we add about 600 responses each to the evaluation sets (these responses were untranscribed) to yield a scoring model evaluation set size of about 700 responses each (sm-eval).
Scoring models were developed and evaluated for the Opinion and Picture task types separately. The Opinion tasks are on a 0-5 point scale whereas the Picture tasks are on a 0-3 point scale. There were only a handful of 0s on each task and they were excluded in building the scoring models.
the least squares optimization procedure using the sm-train data. All features were normalized to have a mean of 0 and a standard deviation of 1, such that their respective baseline influence on the model is comparable across features.
For the Picture task type, CART was used to predict the score class each response should be assigned to. CART 5.0 (Steinberg & Colla, 1997) was used to build the classification trees.
In addition, generic and task-specific models were developed for both task types. The task-specific models made use of task-task-specific vocabu-lary features (Features 5 and 6 in Table 2) which required using previous response data to each of the tasks within a particular task type. (Both task types had 4 different tasks each). The generic models, in contrast, used features that were the same across all tasks for a particular task type and did not use any task-specific vocabulary features. As it would be much more time-consuming and costly to build task-specific models, it is worth-while to investigate how much more predictive power the task-specific vocabulary features could add over and beyond the features in the generic models.
6.1 Opinion task type
For the Opinion tasks, four features were used in building the generic models and five in developing the task-specific models. The following features Were used: hmmscore, typespersecond, silences-persecond, repetitions and relevancecos5 (the latter only in the task-specific model).
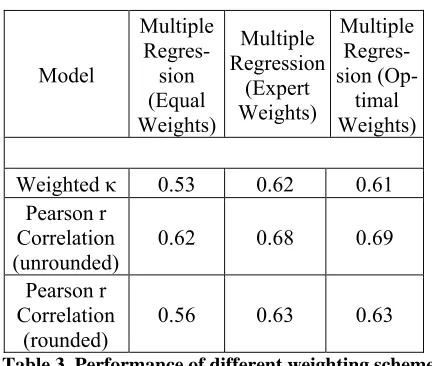
Table 3 shows the results on the sm-eval set. The Expert Weights model and the Optimal Weights models yielded very similar results (weighted kappa and correlation = 0.61-0.63) if we look at predicted scores that were rounded to the nearest integer. The agreements between regres-sion model predicted scores and scores of human rater 1 were just a little below the agreements be-tween two human raters (weighted kappa and cor-relation = 0.72). However, the results for the Equal Weights model were inferior.
The results for the task-specific models showed no improvement over the generic models, suggest-ing that the task-specific vocabulary feature did not contribute more predictive power beyond the four features already in the generic models.
Model
Multiple
Regres-sion (Equal Weights)
Multiple Regression
(Expert Weights)
Multiple Regres-sion
(Op-timal Weights)
Weighted κ 0.53 0.62 0.61
Pearson r Correlation
(unrounded) 0.62 0.68 0.69
Pearson r Correlation
[image:7.612.312.528.65.248.2](rounded) 0.56 0.63 0.63
Table 3. Performance of different weighting schemes on THT scoring model evaluation set for Opinion tasks (generic model)
6.2 Picture task type
As mentioned earlier, the Picture tasks are on a 0-3 point scale and we removed a small number of 0-scores from the analyses, making it a 3-point scale. Given this particular score scale, multiple regres-sion may not be appropriate for this data as it re-quires a continuous or a quasi-continuous dependent variable (i.e. a variable that has at least 5 or more data points). Some classification tech-niques such as CART (Brieman et al., 1984) or logistic regression, which can take ordered score categories as the outcome variable, are better suited for this data. In this study, we analyzed the data with CART models.
CART 5.0 (Steinberg and Colla, 1997) was used to build the classification trees. We built two sets of CART models, one set with the task-specific vocabulary feature (relevancecos3) and one set without it. We explored different model configura-tions, i.e., different combinations of priors and splitting rules. For each combination, a 10-fold cross-validation was conducted. Subsequently, the optimal sub tree that was a relatively small tree with the highest or near-highest agreement with the human scores (weighted kappa) on the cross-validation sample was identified. Then the cases in the sm-eval data set were dropped down the opti-mal tree to obtain the evaluation results on the held-out data.
models, CART trees built using the Twoing1
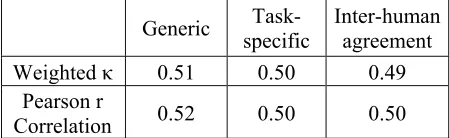
split-ting rule combined with mixed priors (average of equal priors for different score classes and sm-train sample priors) yielded the best kappa values on the cross-validation data and were selected as the op-timal trees. The agreements between the CART model predicted scores and first rater scores slightly exceeded that between two human raters on the sm-eval data set. Another observation from Table 4 was that for this task type, the task-specific CART model did not demonstrate an advantage over the generic model; actually, its performance was slightly worse than that of the generic model, a finding in line with the Opinion task.
Generic specific Task- Inter-human agreement
Weighted κ 0.51 0.50 0.49
Pearson r
[image:8.612.77.302.246.315.2]Correlation 0.52 0.50 0.50
Table 4. Performance of CART models on THT scoring model evaluation set for Picture tasks (ge-neric model vs. task-specific model)
7 Discussion
This paper investigates the feasibility of develop-ing an automatic scordevelop-ing system for the THT Speaking test, focusing on the particular challenges posed by the design of the test. The main challenge posed by the test design is the high variability in task types -- ranging from low-entropy Reading-aloud tasks to high-entropy Opinion tasks. While previous tests of spoken language have focused mainly on either high or low entropy tasks (Bern-stein, 1999; Zechner and Bejar, 2006), we have made an attempt at starting to address the whole scale of entropy within a single test.
In this paper, we selected one high entropy task (Opinion) and one medium-high entropy task (Pic-ture) to start our explorations. While we found that we could, for the most part, use a similar set of features for both tasks, we had to address the dif-ference in score scales between these two task types. While we could use multiple regression for scoring the 5-point-scale Opinion task, we had to
1The Twoing rule divides the cases into two
groups, gathers similar classes together, and at-tempts to separate the two groups in descendant nodes.
employ CART trees for the 3-point-scale Picture task, demonstrating that one can not necessarily use one type of scoring model for all tasks.
When moving to low and low-medium entropy tasks, we expect further adaptations, both in terms of the feature set (e.g., the higher importance of pronunciation features in Reading-aloud tasks), and in speech recognition, where more restrictive language models will be needed.
We have reported findings associated with the performance of the scoring models for the Opinion and Picture task types. Overall, the preliminary findings are quite promising: with a few key speech features, we were able to achieve prediction accuracies that could almost emulate or slightly exceed the agreements between two human raters at task level. Once we have developed scoring models for all task types, it is conceivable to ag-gregate the task level scores to produce a total summary score at the test level and it is very likely we would see a much stronger association between human scores and automated scores for the whole test.
The findings also suggest that task-specific modeling efforts did not seem to be necessary for the two task types investigated. This does not pre-clude the possibility, though, that task-specific scoring models are superior for other task types in which the expected content is much more restricted (such as the Constrained short-answer questions).
8 Conclusions and future work
We have demonstrated that by using a three-stage architecture of automatic speech recognition, fea-ture computation, and scoring models, we are able to achieve some degree of success in generating automated scores for two task types of a spoken language test with a wide variation in entropy in its tasks. The agreement between machine scores and human scores comes close to or reaches the inter-human agreement levels for these two tasks.
References
Agresti, A. (2002). Categorial data analysis (2nd ed.). New York: Wiley.
Bachman, L.F. (1990). Fundamental Considera-tions in Language Testing. New York: Oxford University Press.
Bachman, L. F., and Palmer, A. S. (1996). Lan-guage testing in practice. Ox-ford:OxfordUniversity Press.
Bernstein, J. (1999). PhonePass testing: Structure and construct. Menlo Park, CA: Ordinate Corpo-ration.
Bernstein, J., DeJong, J., Pisoni, D., and Town-shend, B. (2000). Two experiments in automatic scoring of spoken language proficiency. In-STILL2000, Dundee, Scotland.
Brieman, L., Jerome F., Olshen, R., and Stone, C. (1984). Classification and Regression Trees. Pa-cific Grove: Wadsworth.
Cucchiarini, C., Strik, H., & Boves, L. (1997a). Using speech recognition technology to assess foreign speakers' pronunciation of Dutch. Third international symposium on the acquisition of second language speech: NEW SOUNDS 97, Klagenfurt, Austria.
Cucchiarini, C., Strik, S., and Boves, L. (1997b). Automatic evaluation of Dutch pronunciation by using speech recognition technology. IEEE Automatic Speech Recognition and Understand-ing Workshop, Santa Barbara, CA.
Franco, H., Abrash, V., Precoda, K., Bratt, H., Rao, R., and Butzberger, J. (2000). The SRI EduSpeak system: Recognition and pronuncia-tion scoring for language learning. InSTiLL-2000 (Intelligent Speech Technology in Lan-guage Learning), Dundee, Scotland.
Menard, S. (2001). Applied logistic regression analysis. Sage University Paper Series on Quan-titative Applications in the Social Sciences 07-106, Thousand Oaks, CA: Sage.
North, B. (2000). The Development of a Common Framework Scale of Language Proficiency. New York, NY: Peter Lang.
Steinberg, D., and Colla, P. (1997). CART -- Clas-sification and Regression Trees. San Diego, CA: Salford Systems.
Tomokiyo, L. M., and Waibel, A. (2001). Adapta-tion methods for non-native speech. Multilin-guality in Spoken Language Processing, Aalborg.
Wang, Z., Schultz, T., and Waibel, A. (2003). Comparison of acoustic model adaptation tech-niques on non-native speech. IEEE International Conference on Acoustics, Speech, and Signal Proc-essing (ICASSP-2003), Hong Kong, China.
Zechner, K., and Bejar, I. (2006). Towards Auto-matic Scoring of Non-Native Spontaneous Speech. HLT-NAACL-06, New York, NY. Zechner, K., Higgins, D., and Xi, X. (2007).